42 News
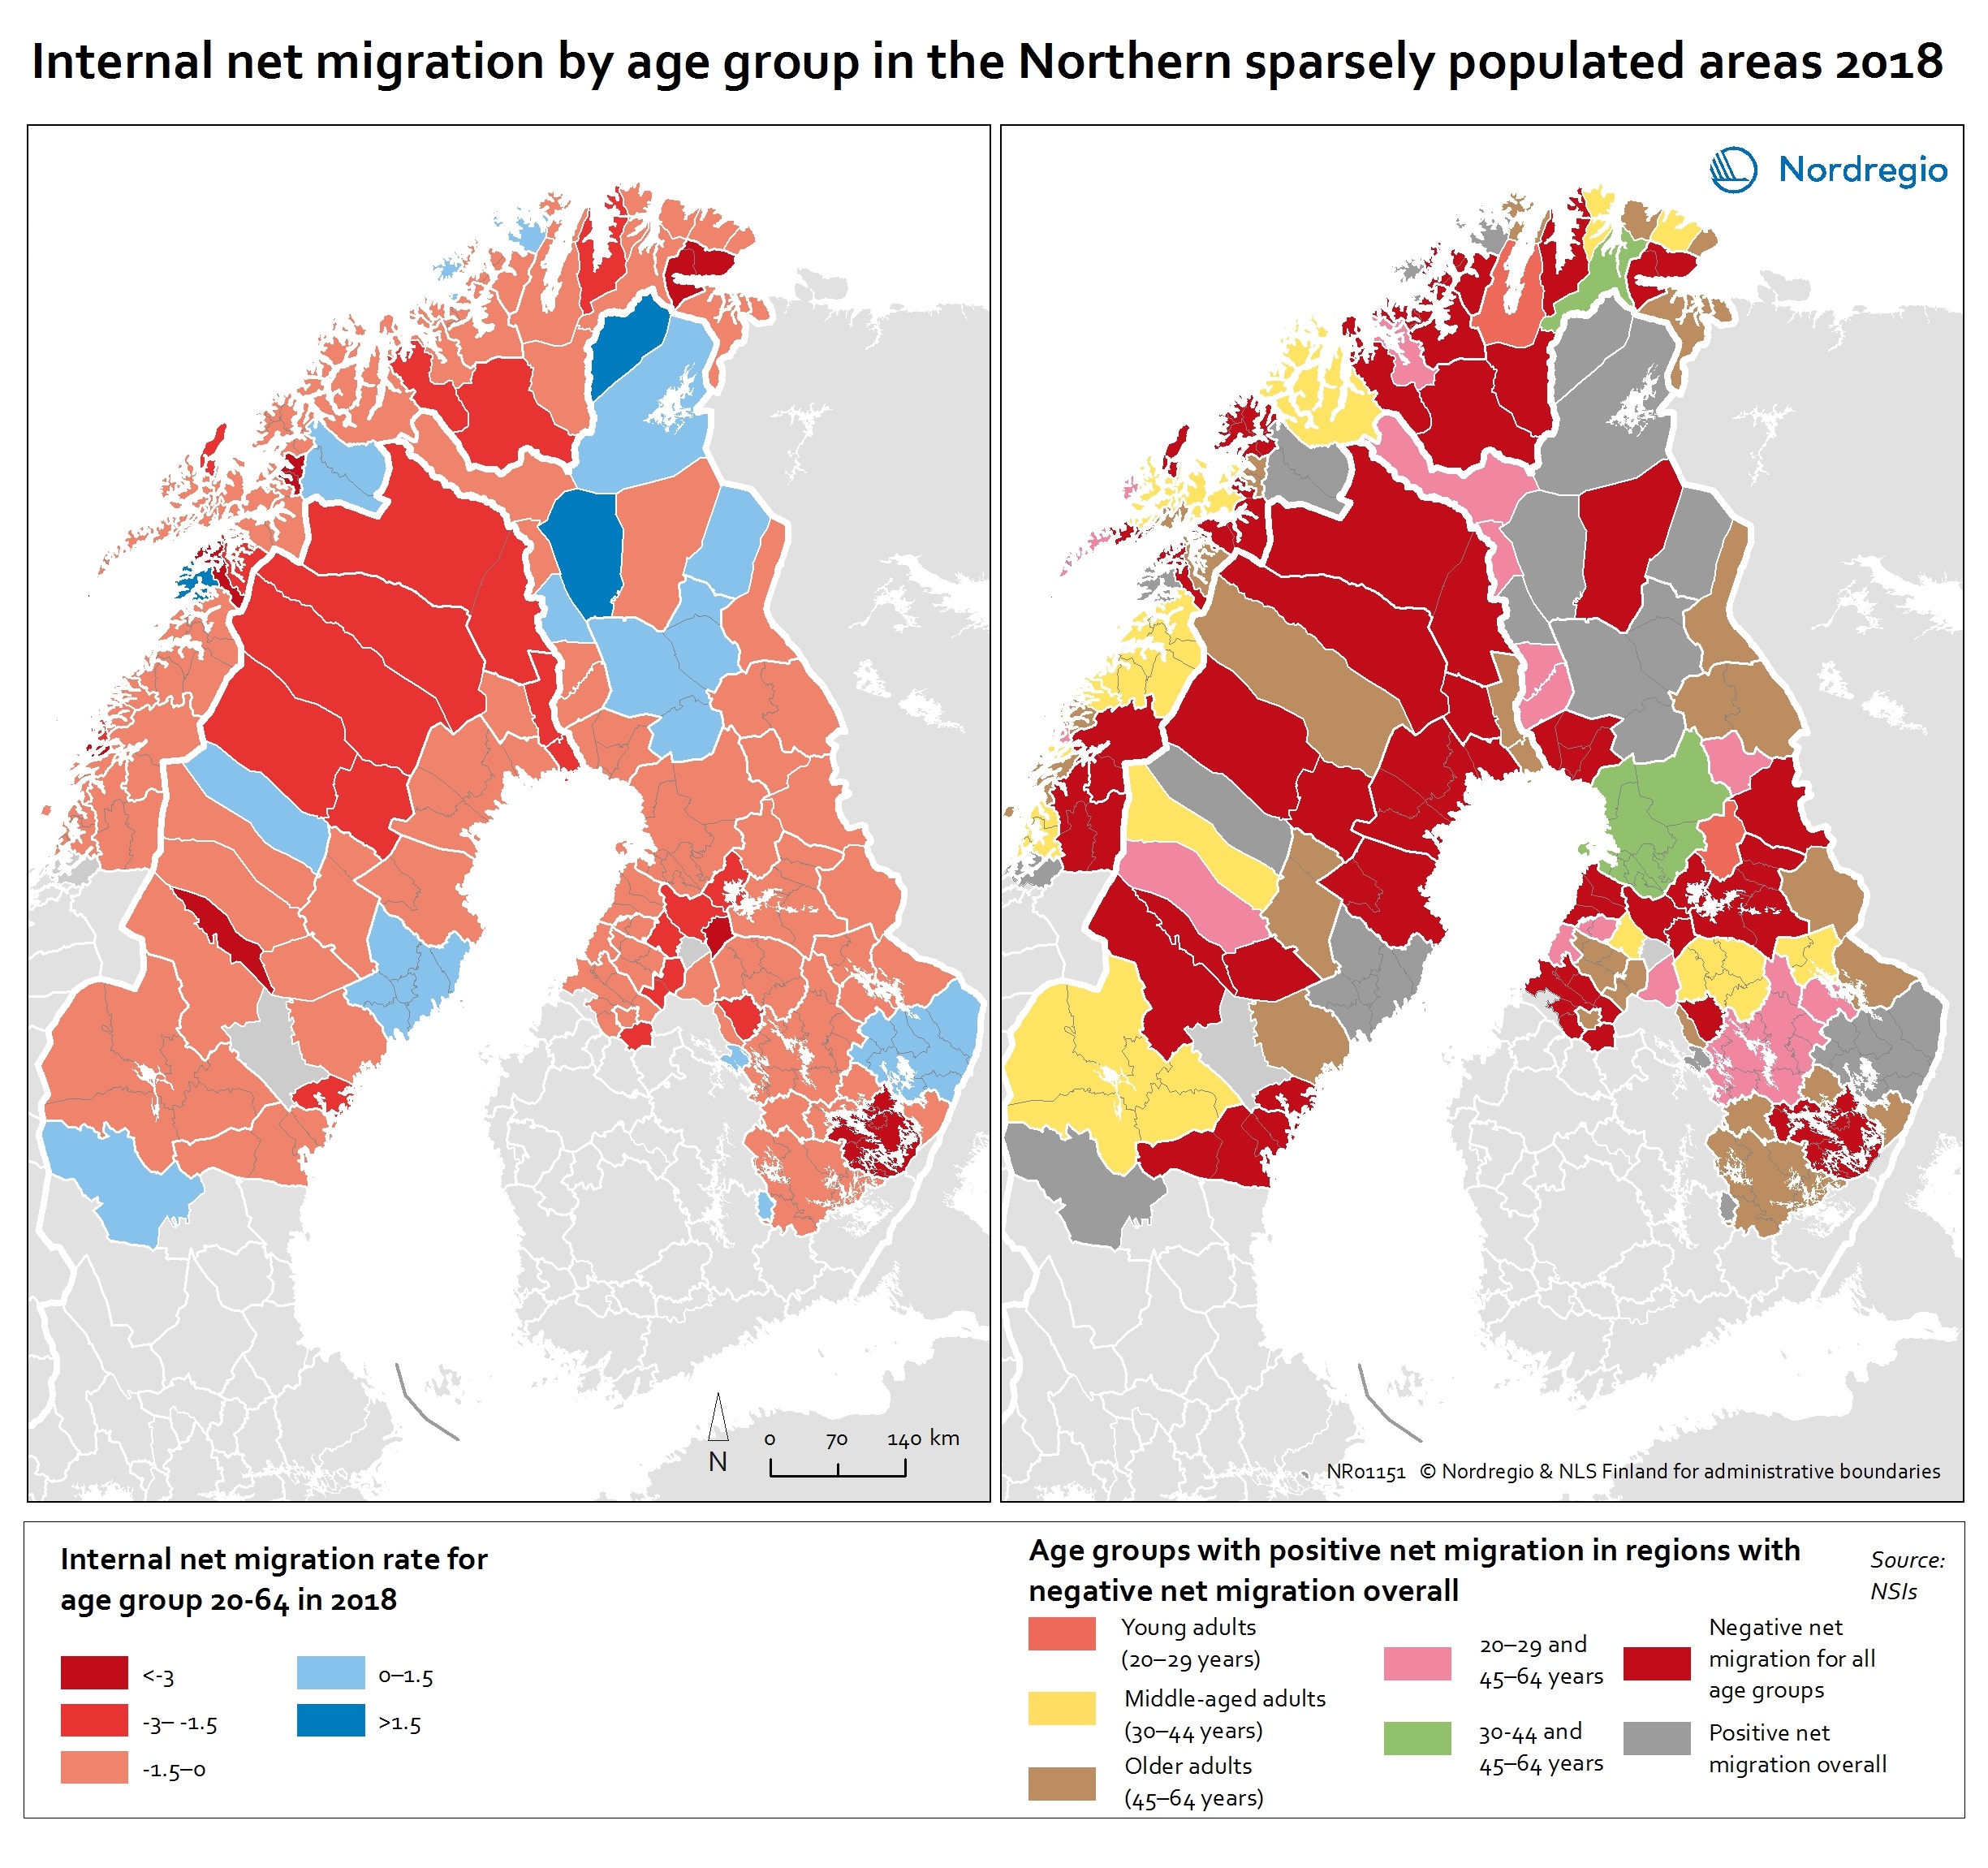
Internal net migration by age group in the Northern sparsely populated areas 2018
This map shows the internal net migration rate in 2018 (left map) and net migration by age group (right map) in local labour market areas of the Northern sparsely populated areas in 2018 The map on left shows the internal net migration rate in the NSPAs in 2018. Although many regions experienced negative net migration, this was not the case for all segments of the population. The map on the right of shows the age groups in which more people moved in than moved out, despite these regions having negative net migration overall. The red colours on the map on the left indicates a net out-migration, while the blue colours indicate a positive net migration. In the map on the right, the red colours indicate net out-migration for all age groups and the grey positive net migration overall. The other colours indicate age groups with a positive net migration (while having negative net migration overall). Inward and outward migration are slightly different in the local labour market areas (LLMAs) compared to the independent labour markets. Among the LLMAs, Rovaniemi is the only one that has positive net migration in all age groups. This positive development may be due to the number of governmental offices, the strength of the tourism industry and the presence of two universities. On the contrary, 18 local labour market areas– four in Sweden, nine in Norway and five in Finland – have negative net migration in all age groups. Out-migration of young adults is seen in most of LLMAs, the exceptions being Umeå, Målsev, Joensuu and Oulu. The inflows of young adults in these regions reflect the presence of the universities in Umeå, Joensuu and Oulu and the army bases in Målselv. Despite this positive inflow, most of these LLMAs are unable to retain adults in…
 2020 February
 - Demography
- Labour force
- Migration
- NSPA and North Atlantic
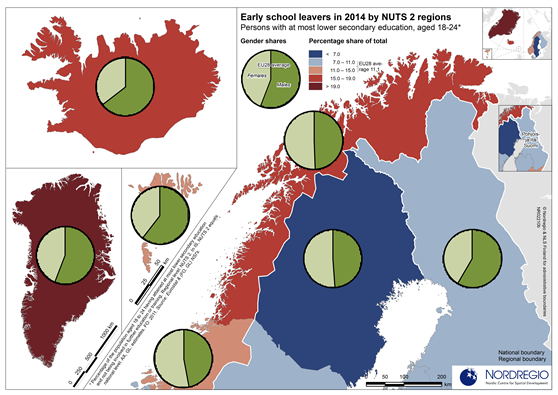
Early school leavers in 2014 by NUTS 2 regions
Persons with at most lower secondary education as share of total population aged 18-24 The map indicates variations within the Nordic countries with the lowest rates of early school leaving found in Swedish regions. In six of the eight Swedish NUTS 2 regions (riksområden) early school leavers make up less than seven percent of the population aged 18-24 years. Hovedstaden in Denmark is the only other Nordic region with a similar rate. In Finland (suuralue/storområde) and Norway (landsdel), variations between the NUTS 2 regions are bigger than in Sweden and Denmark. In the northernmost Finnish region, Pohjois- ja Itä-Suomi (North & East Finland), early school leavers make up a small portion of the population aged 18-24 years, below both the EU average (11.1%) and the two southernmost Finnish NUTS 2 regions. In the Faroe Islands, Iceland, Northern Norway, and, in particular, Greenland, the percentage of the population aged 18-24 years with lower-secondary school as their highest level of education is well above the EU average. With respect to gender, the balance is fairly even in northern Sweden and northern Norway. All other countries and regions included in the map show patterns consistent with the EU average, with males making up a larger portion of the early school leaving population.
- 2016 October
- Labour force
- NSPA and North Atlantic