43 News
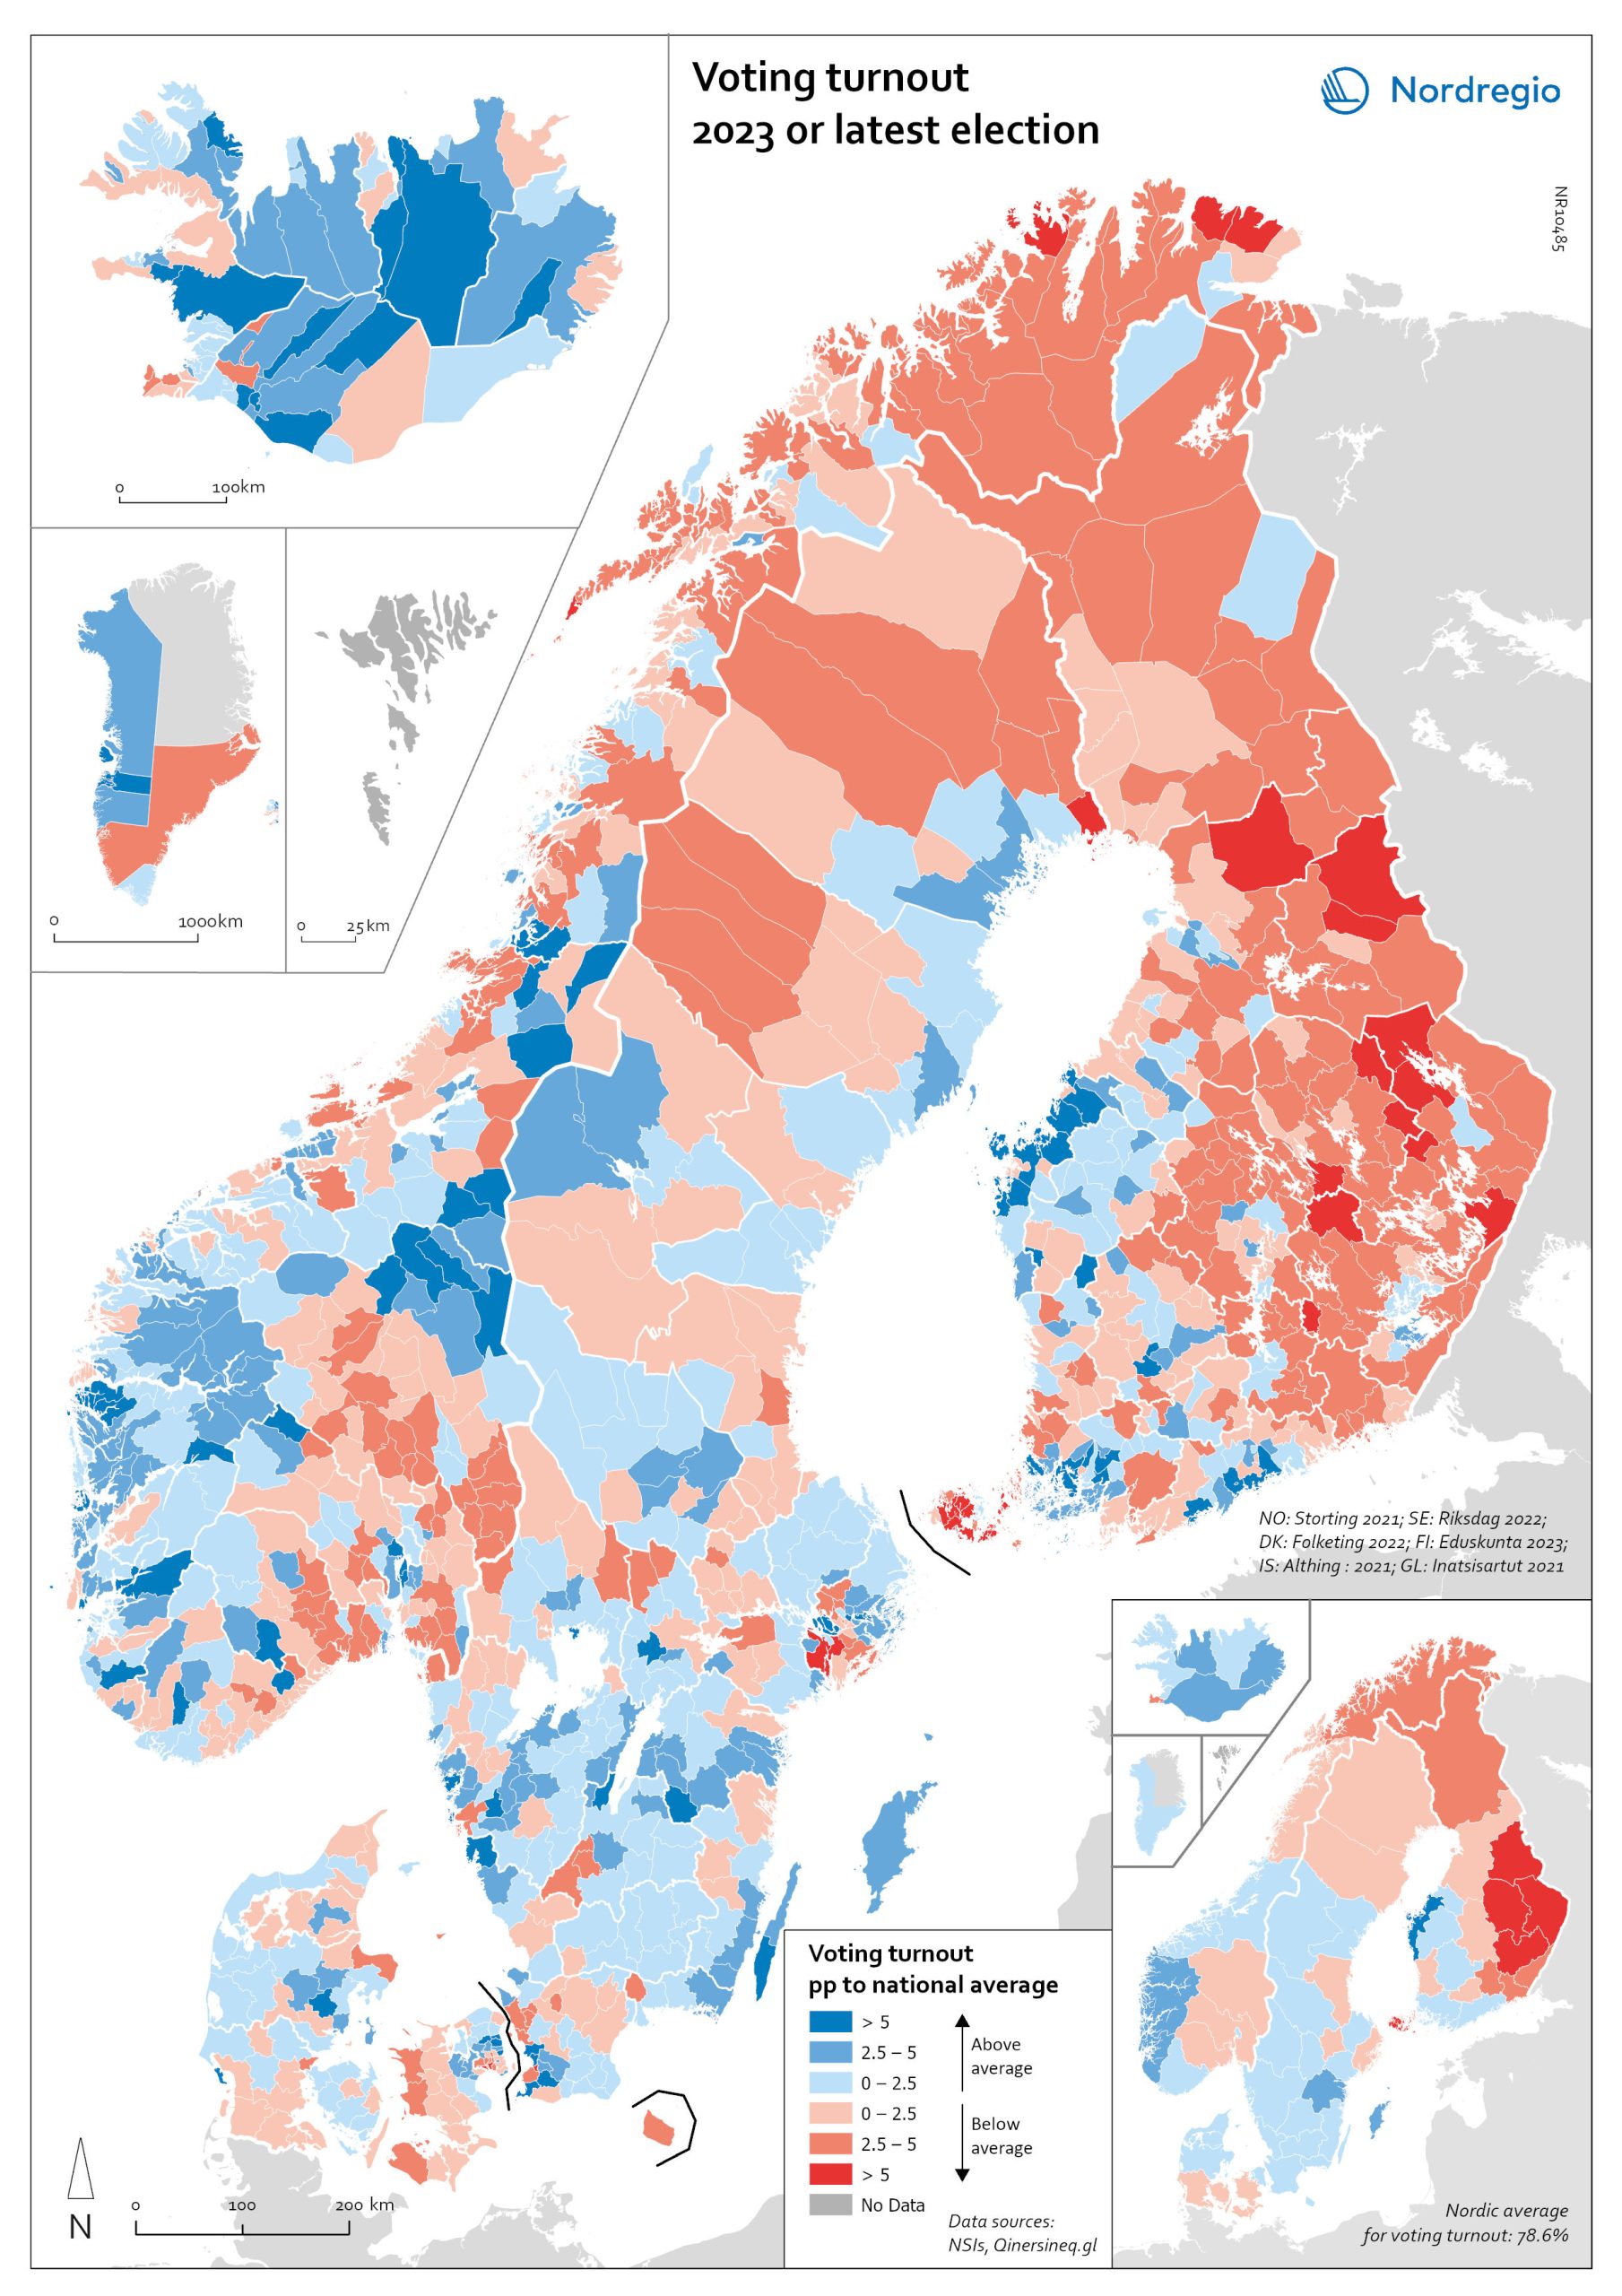
Voting turnout in national elections
Voting turnout in 2023 (or latest national election). The map illustrates voter turnout as a percentage point relative to national averages, highlighting differences in participation levels between countries. This method removes inter-country differences in participation levels, providing a clearer view of the urban-rural divide. Lower turnout is observed in eastern Finland, northern Sweden, and the more rural parts of Denmark. In Norway, the lowest turnout occurs in the north and in municipalities outside Oslo. Nationally, the highest voter turnouts are in the Faroe Islands (88%), Sweden (84.2%), and Denmark (84.16%). Lower participation rates are found in Iceland (80.1%), Norway (77.2%), Finland (68.5%), and Greenland (65.9%).
 2024 May
 - Nordic Region
- Others
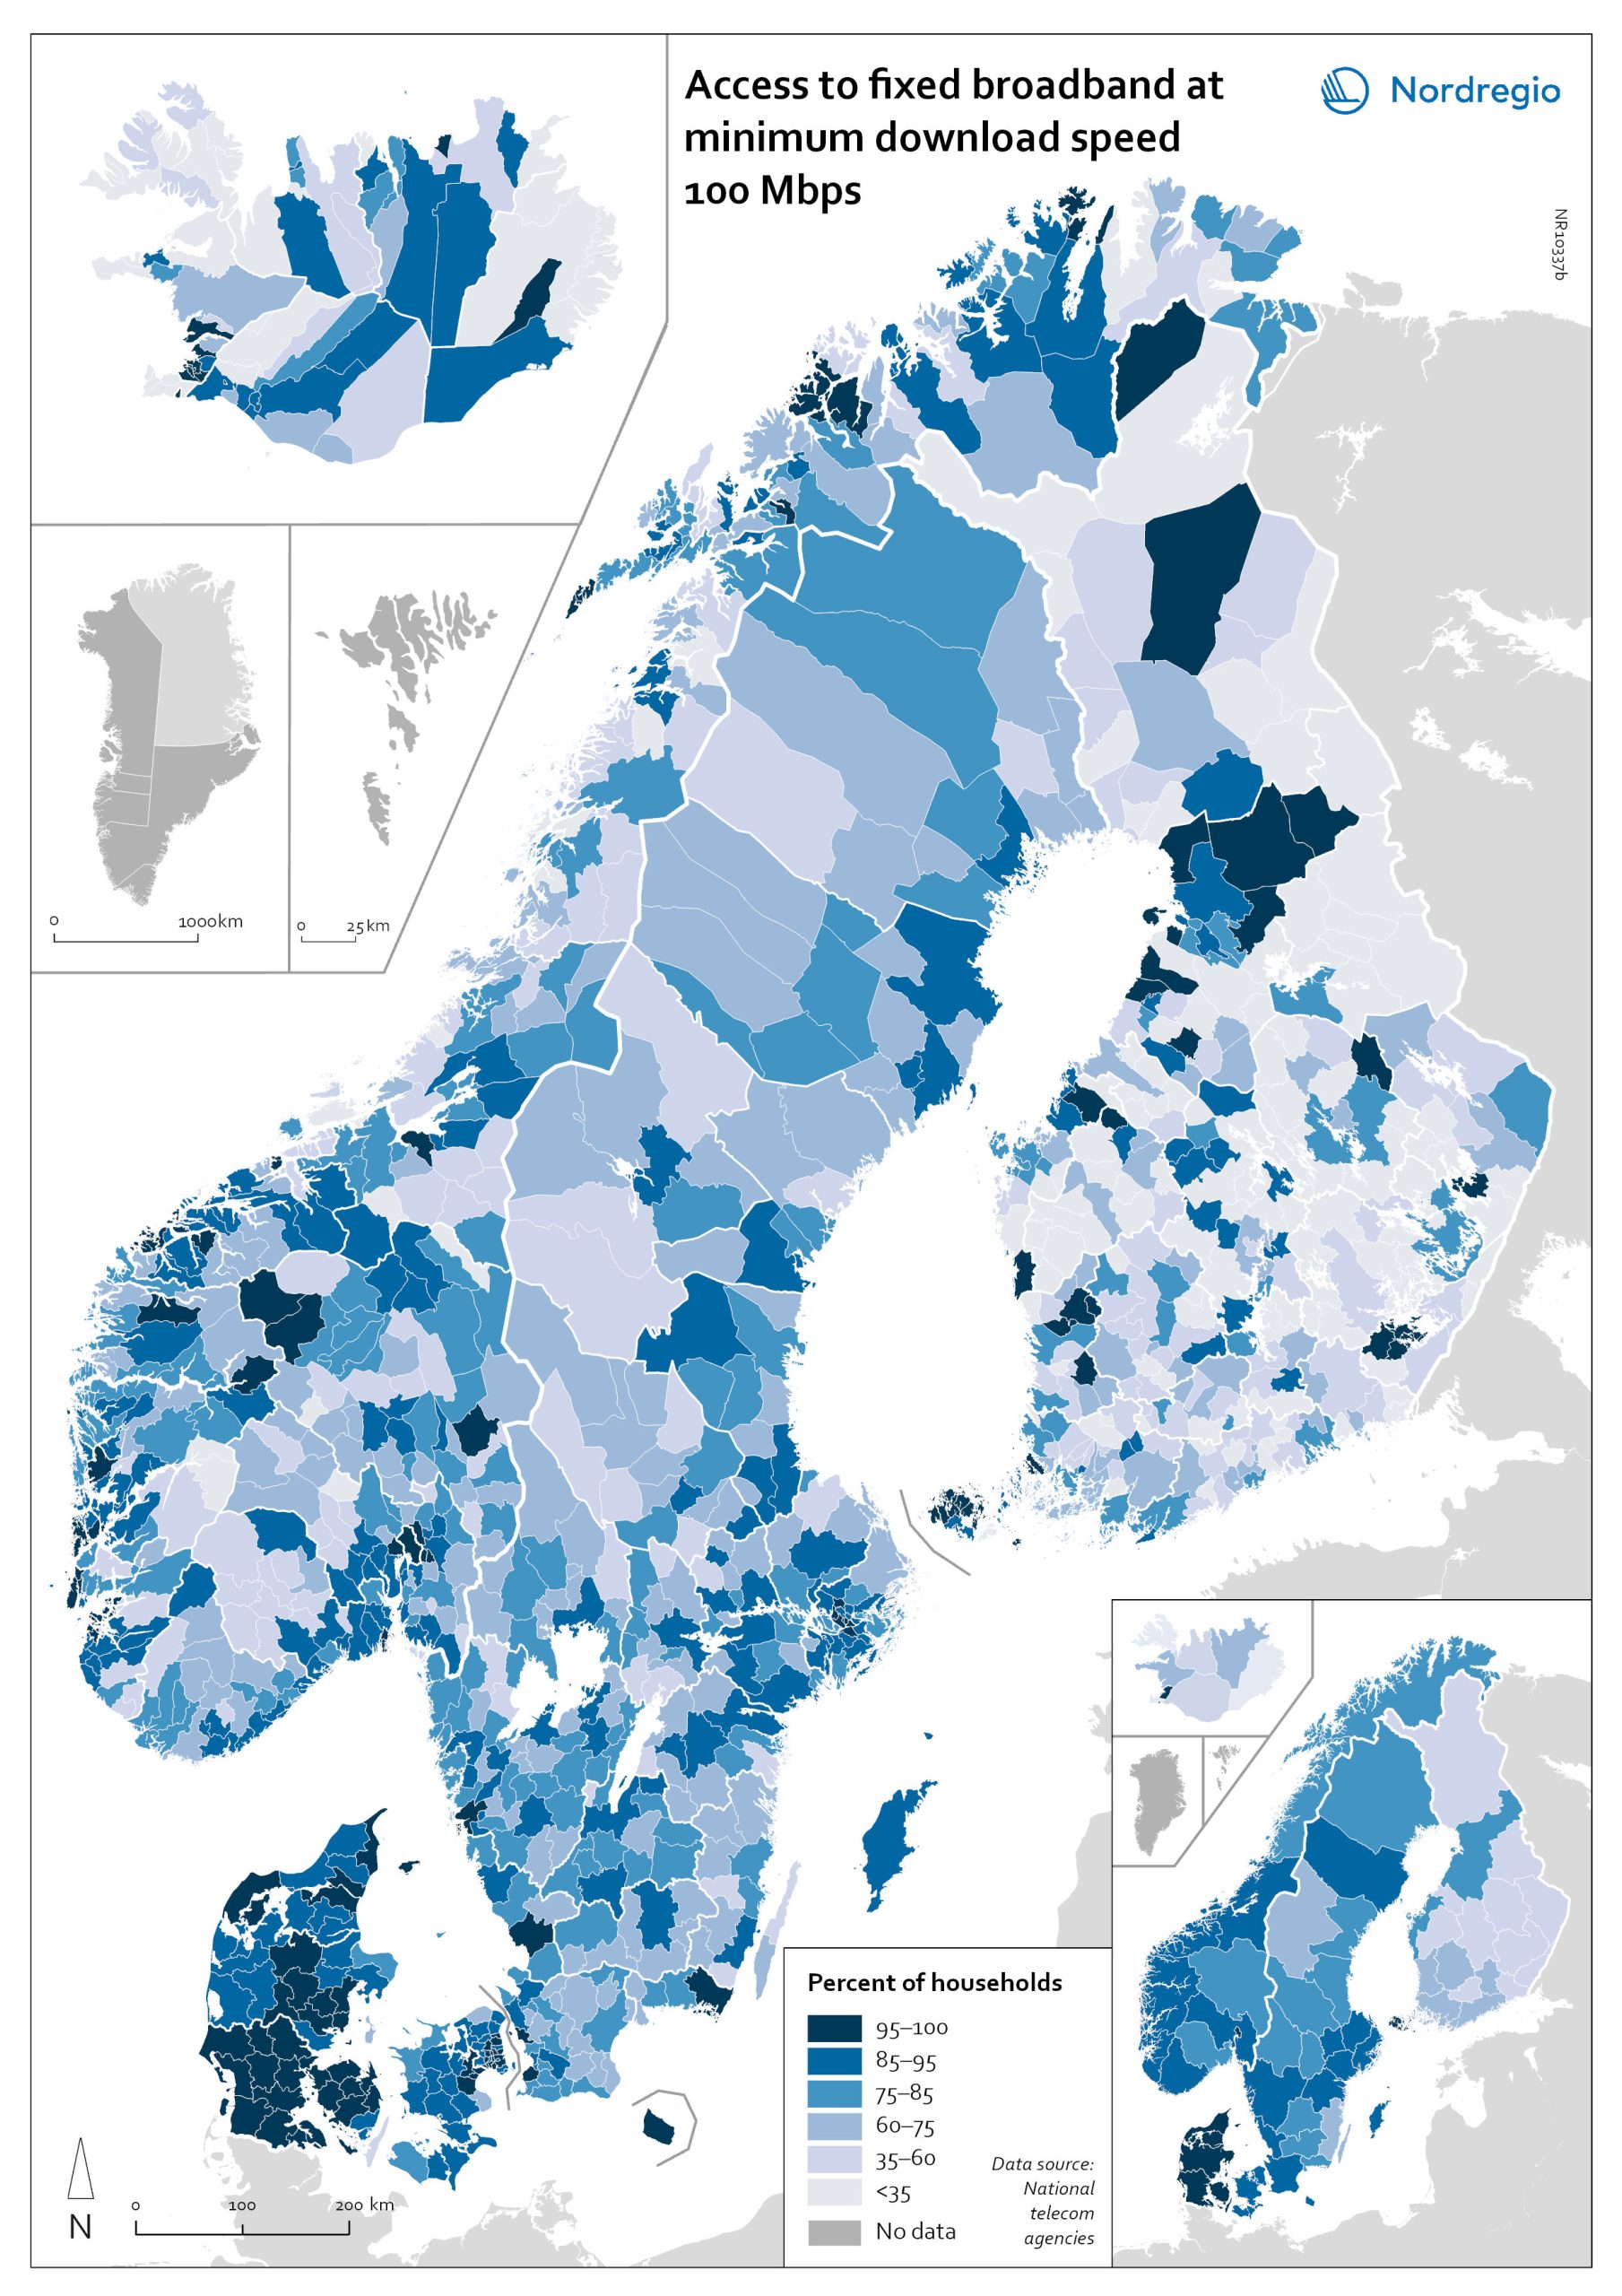
Access to fixed broadband at minimum download speed 100 Mpbs
The map shows the proportion of households that had access to fixed-line broadband with download speeds >100 Mbps (superfast broadband) at the municipal level, with darker colours indicating higher coverage. Overall, Denmark has the highest levels of connectivity, with 92% of municipalities providing superfast broadband to at least 85% of households. In over half (59%) of all Danish municipalities, almost all (>95%) of households have access to this connection speed. The lowest levels of connectivity are found in Finland. This is particularly evident in rural municipalities where, on average, less than half of households (48%) have access to superfast broadband. Connectivity levels are also rather low in some parts of Iceland, for example, the Westfjords and several municipalities in the east. Households in urban municipalities are still more likely to have access to superfast broadband than households in rural or intermediate municipalities, but the gap appears to be closing in most. This is most evident in Norway, where the average household coverage for rural municipalities increased by 31% between 2018 and 2020. By comparison, average household coverage for urban municipalities in Norway increased by only 0.7%. In the archipelago (Åland Islands, Stockholm and Helsinki), general broadband connectivity is good; however, some islands with many second homes still have poor coverage.
- 2022 March
- Labour force
- Nordic Region
- Others
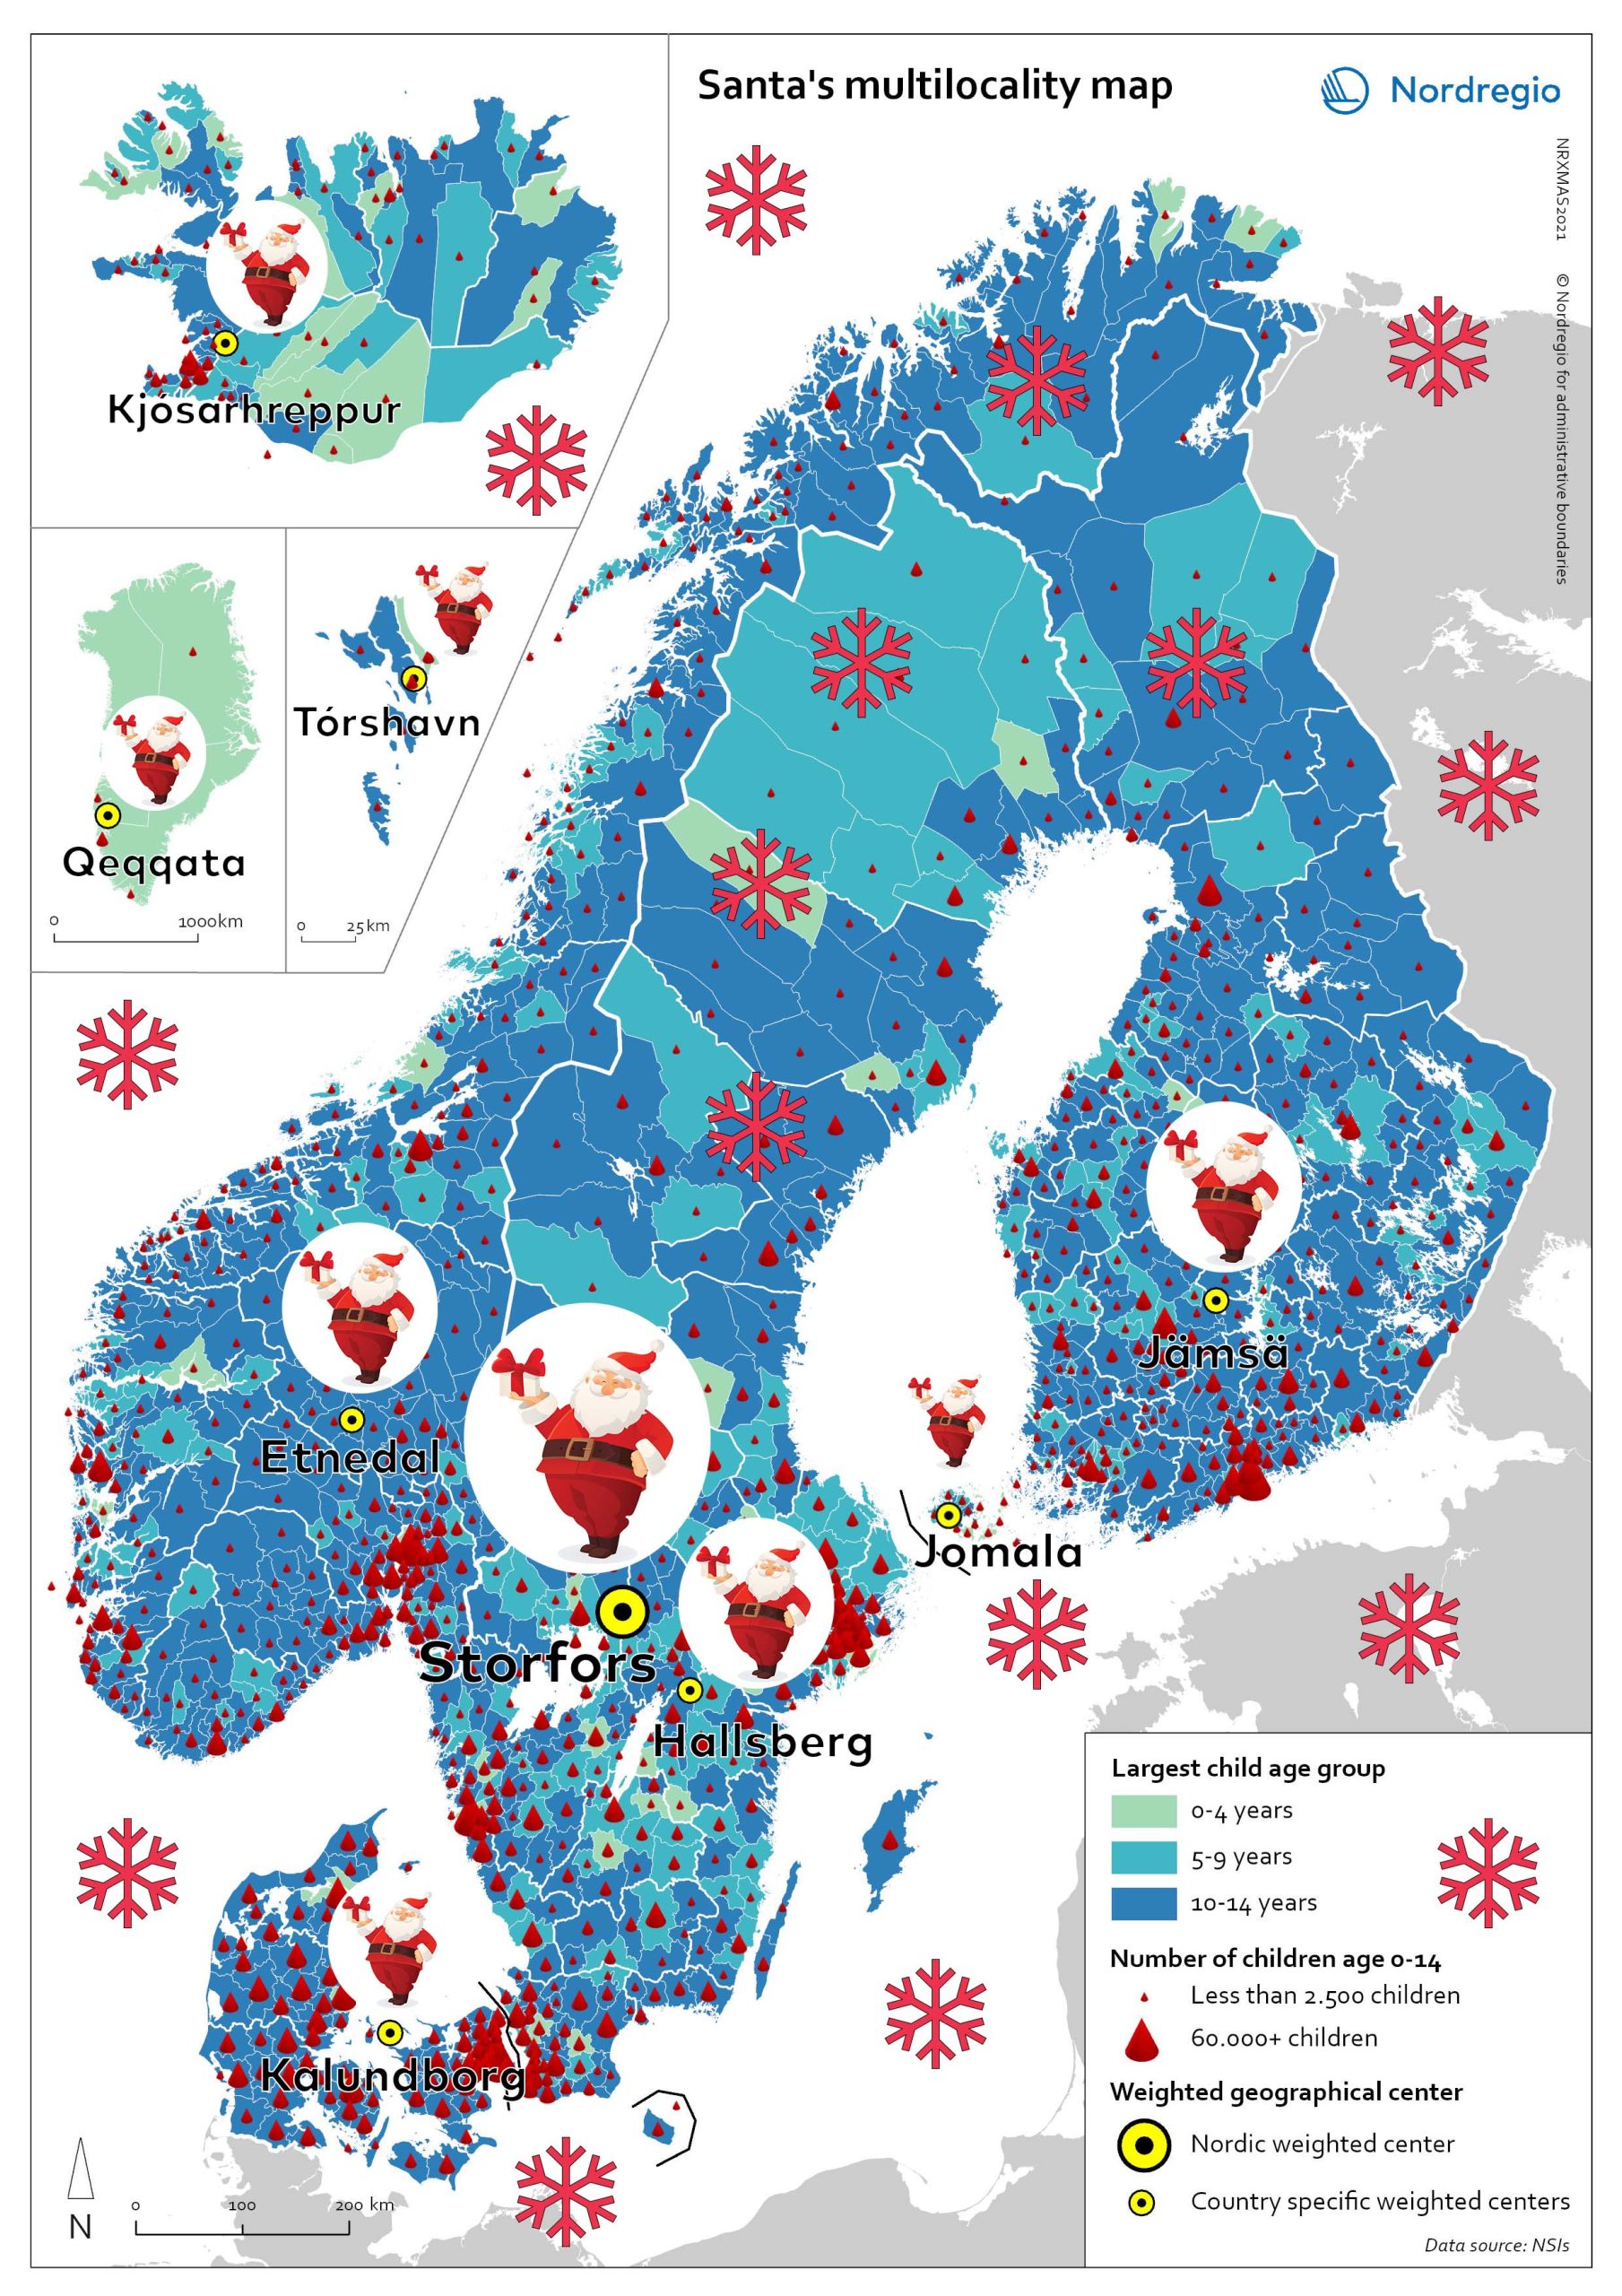
Help Santa to work remotely – where to locate in 2021?
Help Santa! To reduce his transit times and emissions – reindeers burn a lot of (green) fuel – and find an optimal remote workplace from where to deliver gifts to all the children in the Nordic Region! Santa has heard about this new trend “multilocational lifestyle” and he would like to know if this would suit him as well. But where to move? Santa’s little researchers have worked hard this year and done some mapping for him – and discovered places you have never even heard of! If Santa is to serve all children (0-14 years old) throughout the Nordic Region from a single address, the solution lies in Storfors Municipality. WHERE? – you might think. It is a real place, in Central-Southern Sweden. Here Santa has an average distance of 425 km distance to each child from his own backyard. This still sounds like awfully many kilometers. Could he be even more multilocal – with a home in each of the Nordic countries? This would help him to reduce his overall commuting to work significantly. Let’s try it! If he serves all 4.974 children in Åland from a residence (like a luxury hotel with all-inclusive and pets allowed) in Jomala Municipality, he will only have to travel 11 km to work on average. In Greenland, the distances are somewhat larger, and Santa, even with the most optimal location from a residence (a cabin) in Qeqqata Municipality would have to travel 288 km to each of the 11,748 children in the country. Can you guess what the other optimal locations would be in the Nordics? I bet you can’t so I will tell you: it’s the municipalities of Hallsberg in Sweden, Jämsä in Finland, Etnedal in Norway, Kalundborg in Denmark, Kjósarhreppur in Iceland and Tórshavn in Faroe Islands. Well, Santa…
- 2021 December
- Nordic Region
- Others
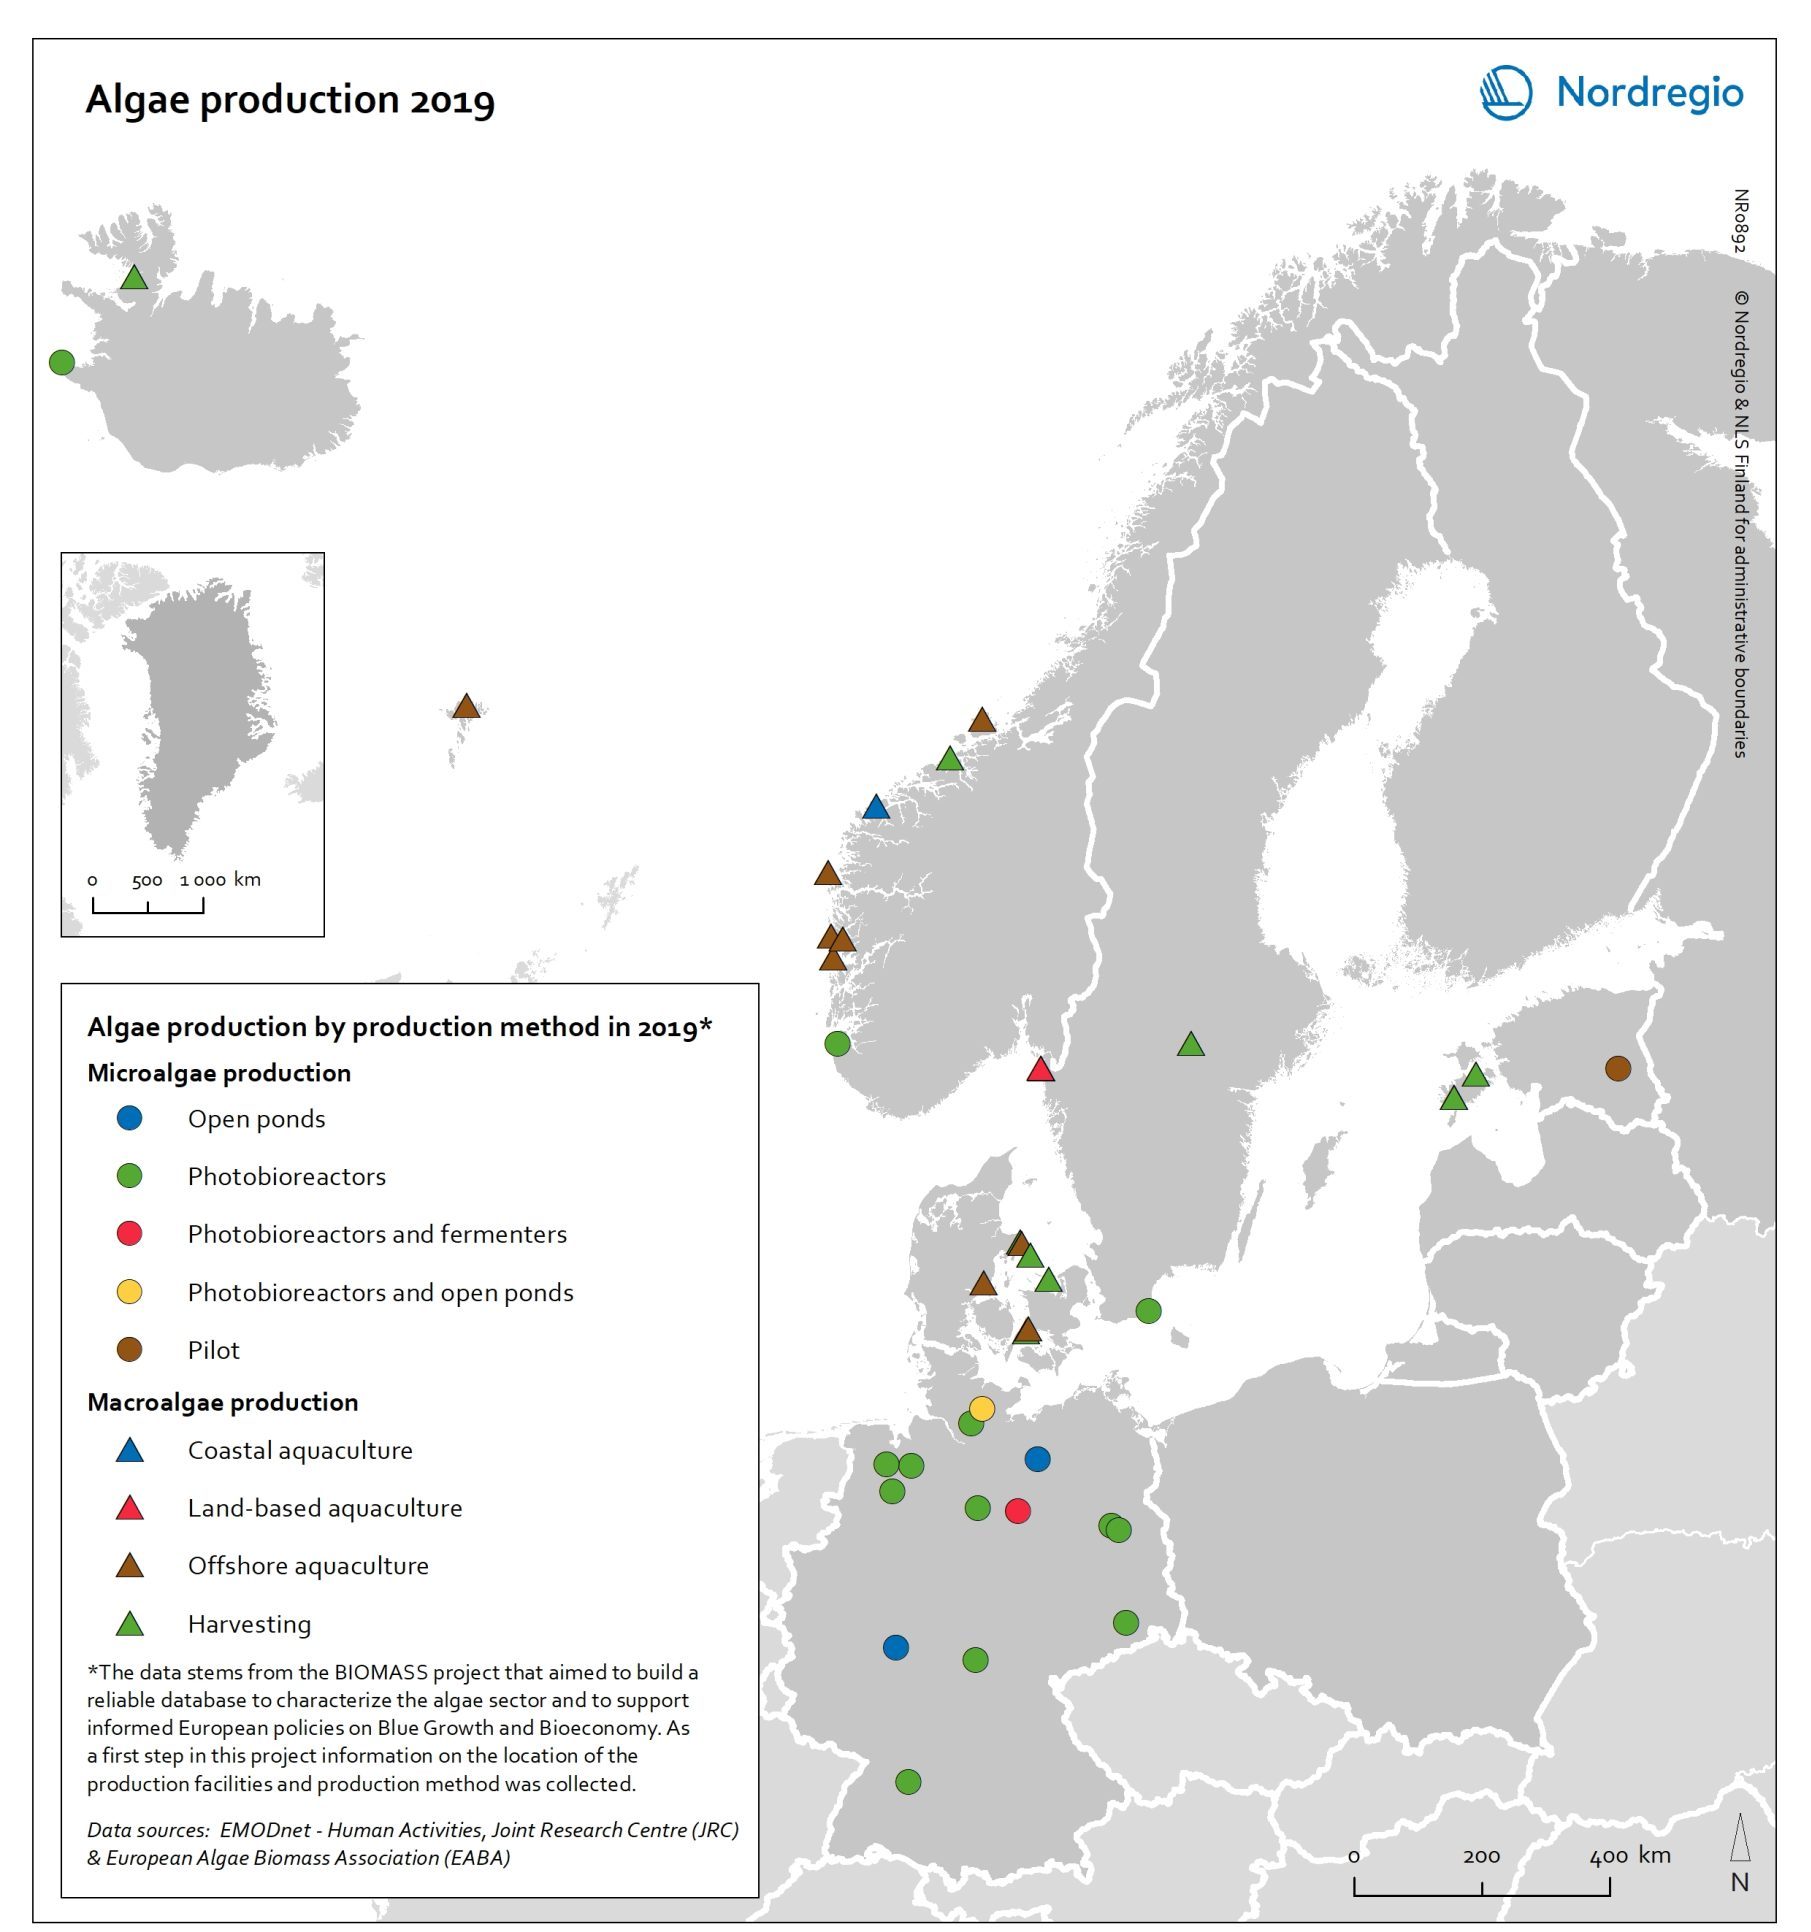
Algae production in 2019
This map shows location of algae production by production method in the Nordic Arctic and Baltic Sea Region in 2019 Algae and seaweeds are gaining attention as useful inputs for industries as diverse as energy and human food production. Aquatic vegetation – both in the seas and in freshwater – can grow at several times the pace of terrestrial plants, and the high natural oil content of some algae makes them ideal for producing a variety of products, from cosmetic oils to biofuels. At the same time, algae farming has added value in potential synergies with farming on land, as algae farms utilise nutrient run-off and reduce eutrophication. In addition, aquatic vegetation is a highly versatile feedstock. Algae and seaweed thrive in challenging and varied conditions and can be transformed into products ranging from fuel, feeds, fertiliser, and chemicals, to third-generation sugar and biomass. These benefits are the basis for seaweed and algae emerging as one of the most important bioeconomy trends in the Nordic Arctic and Baltic Sea region. The production of algae for food and industrial uses has hence significant potential, particularly in terms of environmental impact, but it is still at an early stage. The production of algae (both micro- and macroalgae) can take numerous forms, as shown by this map. At least nine different production methods were identified in the region covered in this analysis. A total of 41 production sites were operating in Denmark, Estonia, the Faroe Islands, Iceland, Norway, Germany, and Sweden. Germany has by far the most sites for microalgae production, whereas Denmark and Norway have the most macroalgae sites.
- 2021 December
- Arctic
- Baltic Sea Region
- Nordic Region
- Others
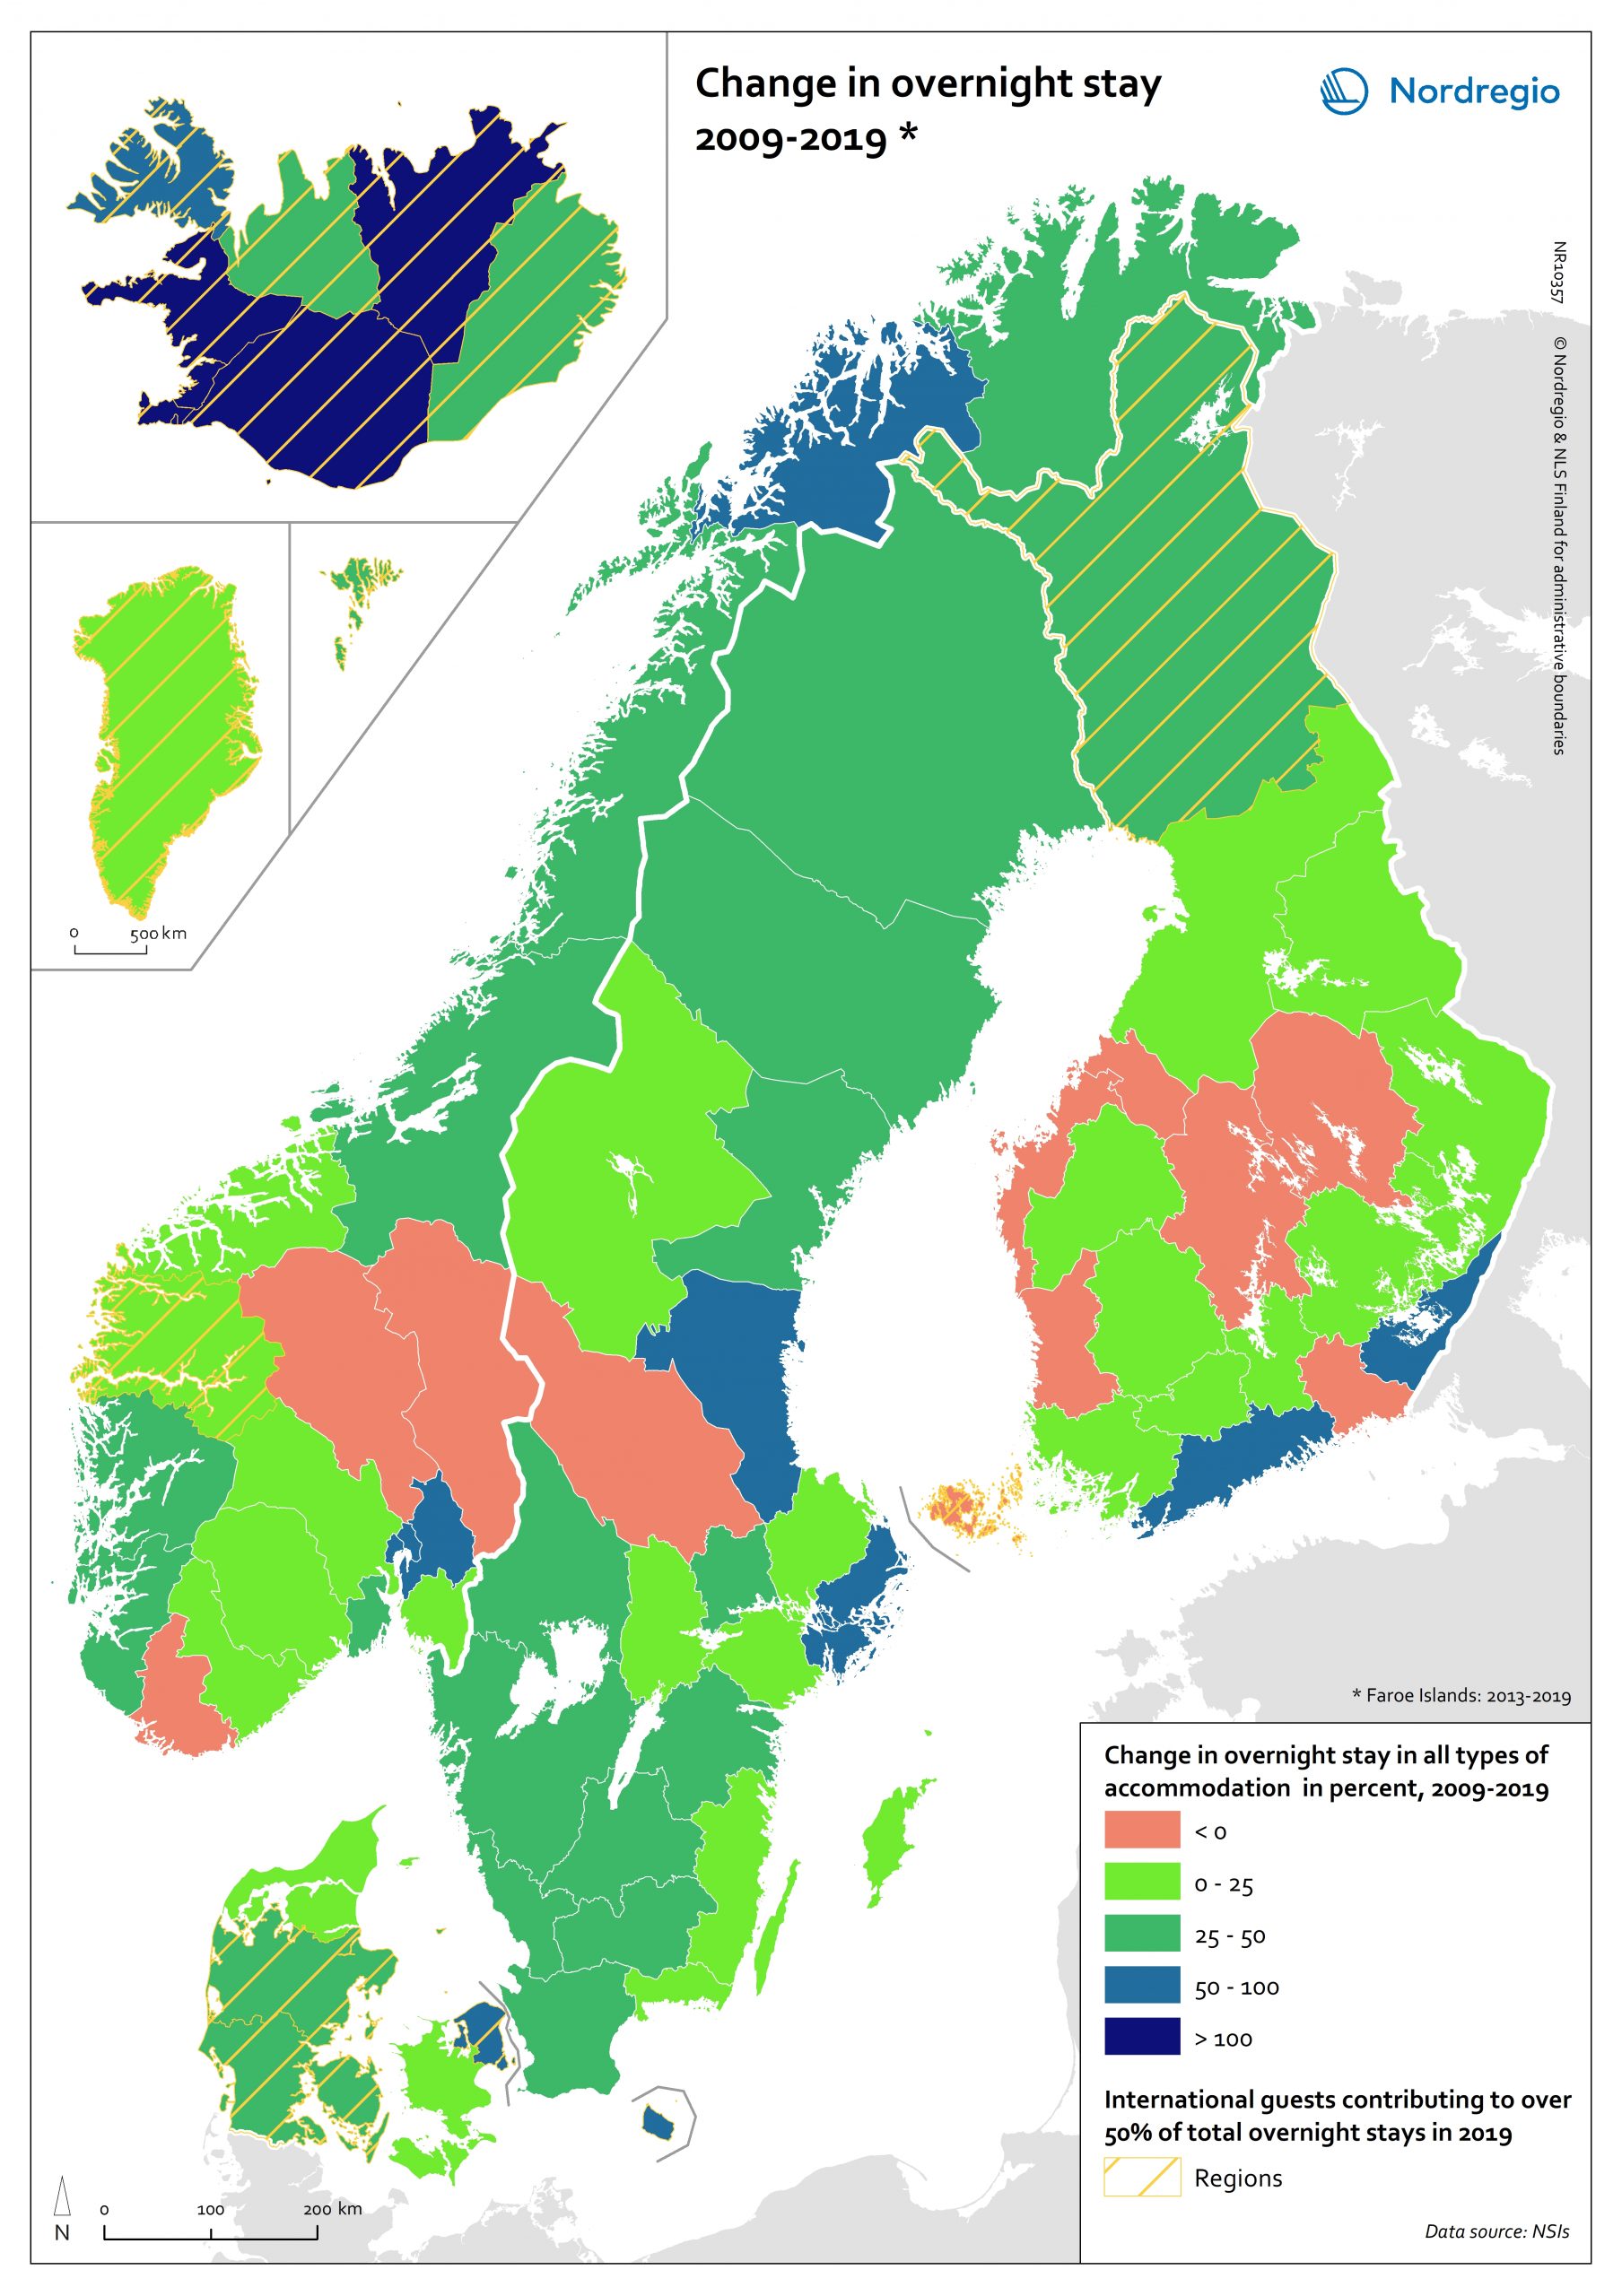
Change in overnight stay 2009-2019
The indicator measures the total overnight stays by guests in all types of accommodation, i.e., hotels and holiday resorts, camping sites, youth hostels, marinas, and holiday cottages. The map shows the change in percent from 2009 and 2019 (Faroe Island: 2013-2019 due to limited data availability). The orange colour indicates a shrink, while bluish colours indicate an increase. Bluer the colour is, larger is the increase. The shaded colour in yellow highlights the regions where international guests contributed to more than half of the total overnight stays in 2019. Most Nordic regions and territories have experienced an increase in the number of overnight stays during the last decade. The most dramatic increase can be observed in Iceland, with 5 of its 8 regions witnessing an increase in overnight stays over 100% between 2009-2019. The overnight stays in Suðurnes have increased by 451% during 2009-2019, being the largest increase in the Nordic Region. It’s also worth noting that the nearly all the regions and territories with more international guests have an increase in the total number of overnight stays, indicating that international tourism is playing a more important role in the Nordic tourism industry. The only exception is Åland, whose overnight stays dropped by 5% during 2009-2019. The traditional skiing destinations in Norway and Sweden have also witnessed a decrease in their total overnight stays, i.e., Hedmark, Oppland and Dalarna. Hedmark, among all the Nordic regions and territories, experienced the largest decline of overnight stays of 15% between 2009-2019. The number of overnight stays in some regions in eastern and central Finland also decreased from 2009 to 2019, e.g., Central Ostrobothnia and Satakunta, with domestic guests as the main tourists.
- 2021 February
- Nordic Region
- Others
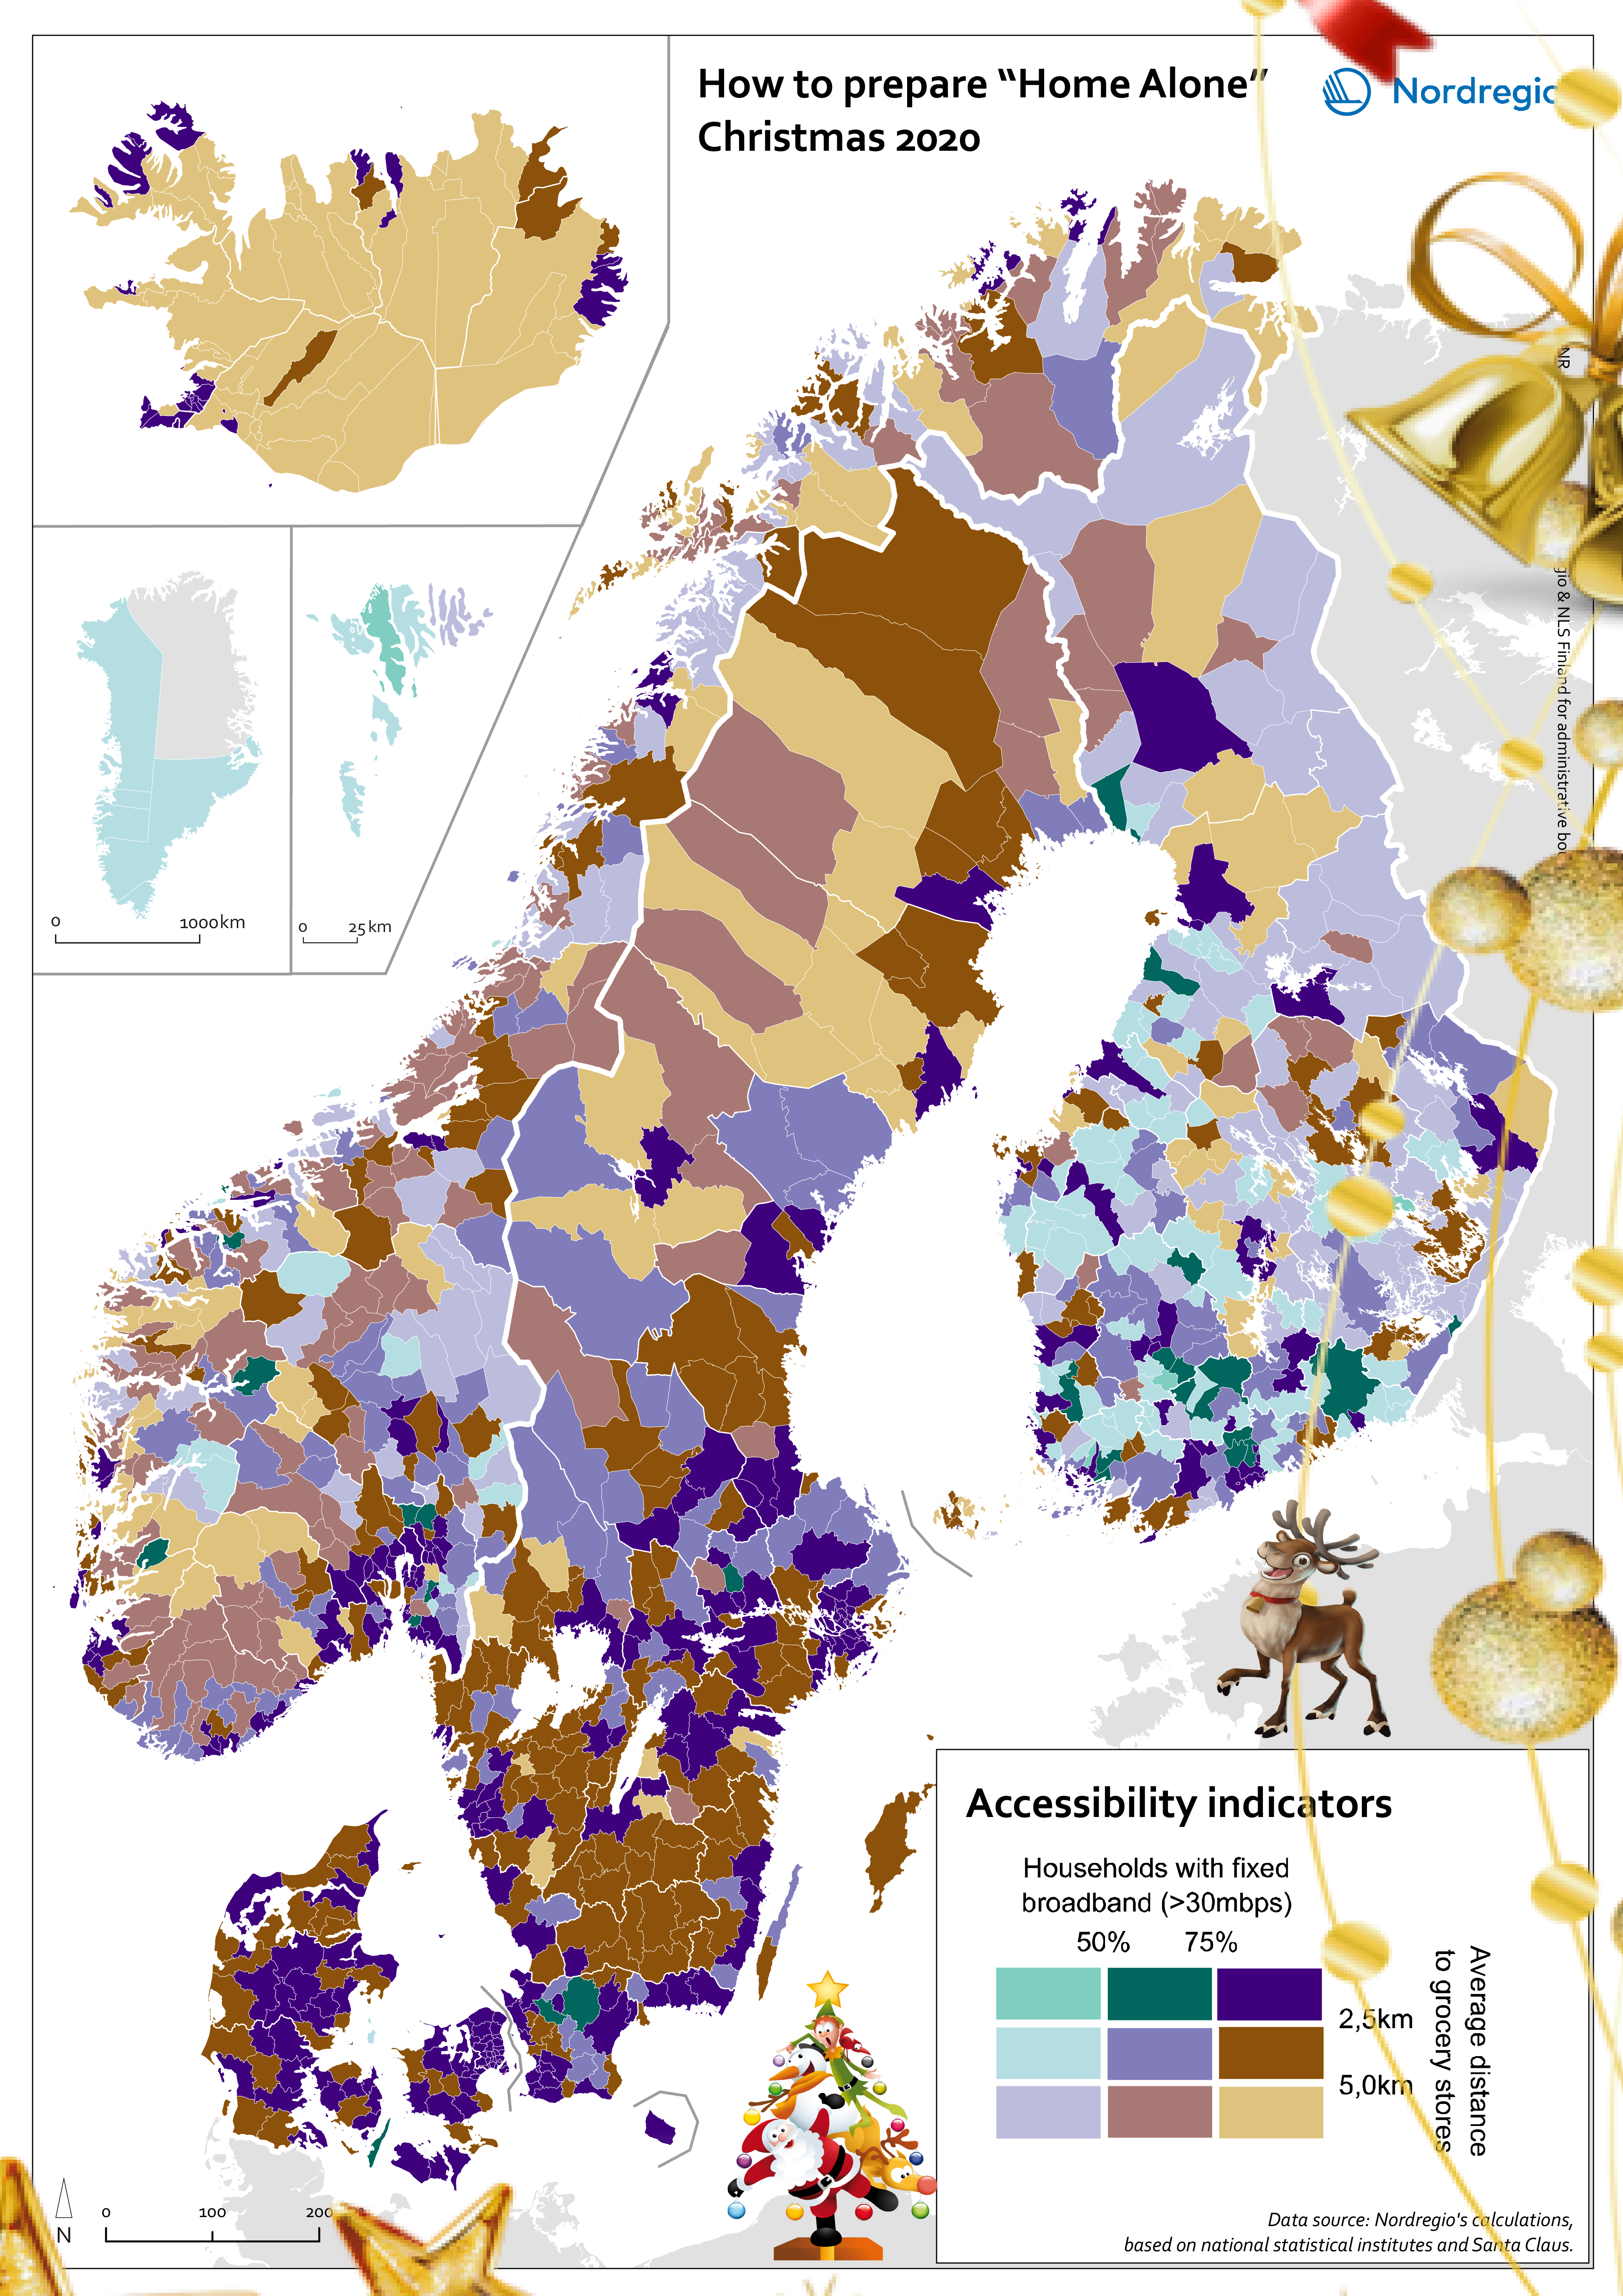
How to prepare for Home Alone Christmas 2020?
The conditions for a Home Alone Christmas vary greatly across the Nordic Region. The combination of the selected two accessibility indicators is visualised on Nordregio’s Christmas Map 2020. It classifies the Nordic municipalities into nine categories, based on: – The share of households with fixed broadband of at least 30mbps is used to measure the quality and distribution of internet connection. The higher the percentage, the bigger chance you will have an uninterrupted online celebration! – The average distance to grocery stores is used to estimate the time required to get your Christmas food: the closer to a grocery store, the more spontaneous you can be. On one side of the spectrum are about a fourth of the municipalities having a high share of households (>75%) with a decent broadband connection and a short average distance to the closest grocery store (<2,5 km). This enhances last-minute Christmas preparation and high-quality online celebrations. These municipalities are colored in dark purple on the map and are mostly, but not exclusively, located in urban areas in Denmark, Finland, Iceland, Norway and Sweden. On the other side of the spectrum, about 10% of Nordic municipalities have rather weak fixed broadband coverage (<50%) and relatively long travel distances to the closest grocery store (> 5km), requiring more planning for celebrating Christmas. These municipalities are colored in light purple on the map and are mostly found in sparsely population municipalities in Finland and mountainous municipalities in Norway.
- 2020 December
- Nordic Region
- Others
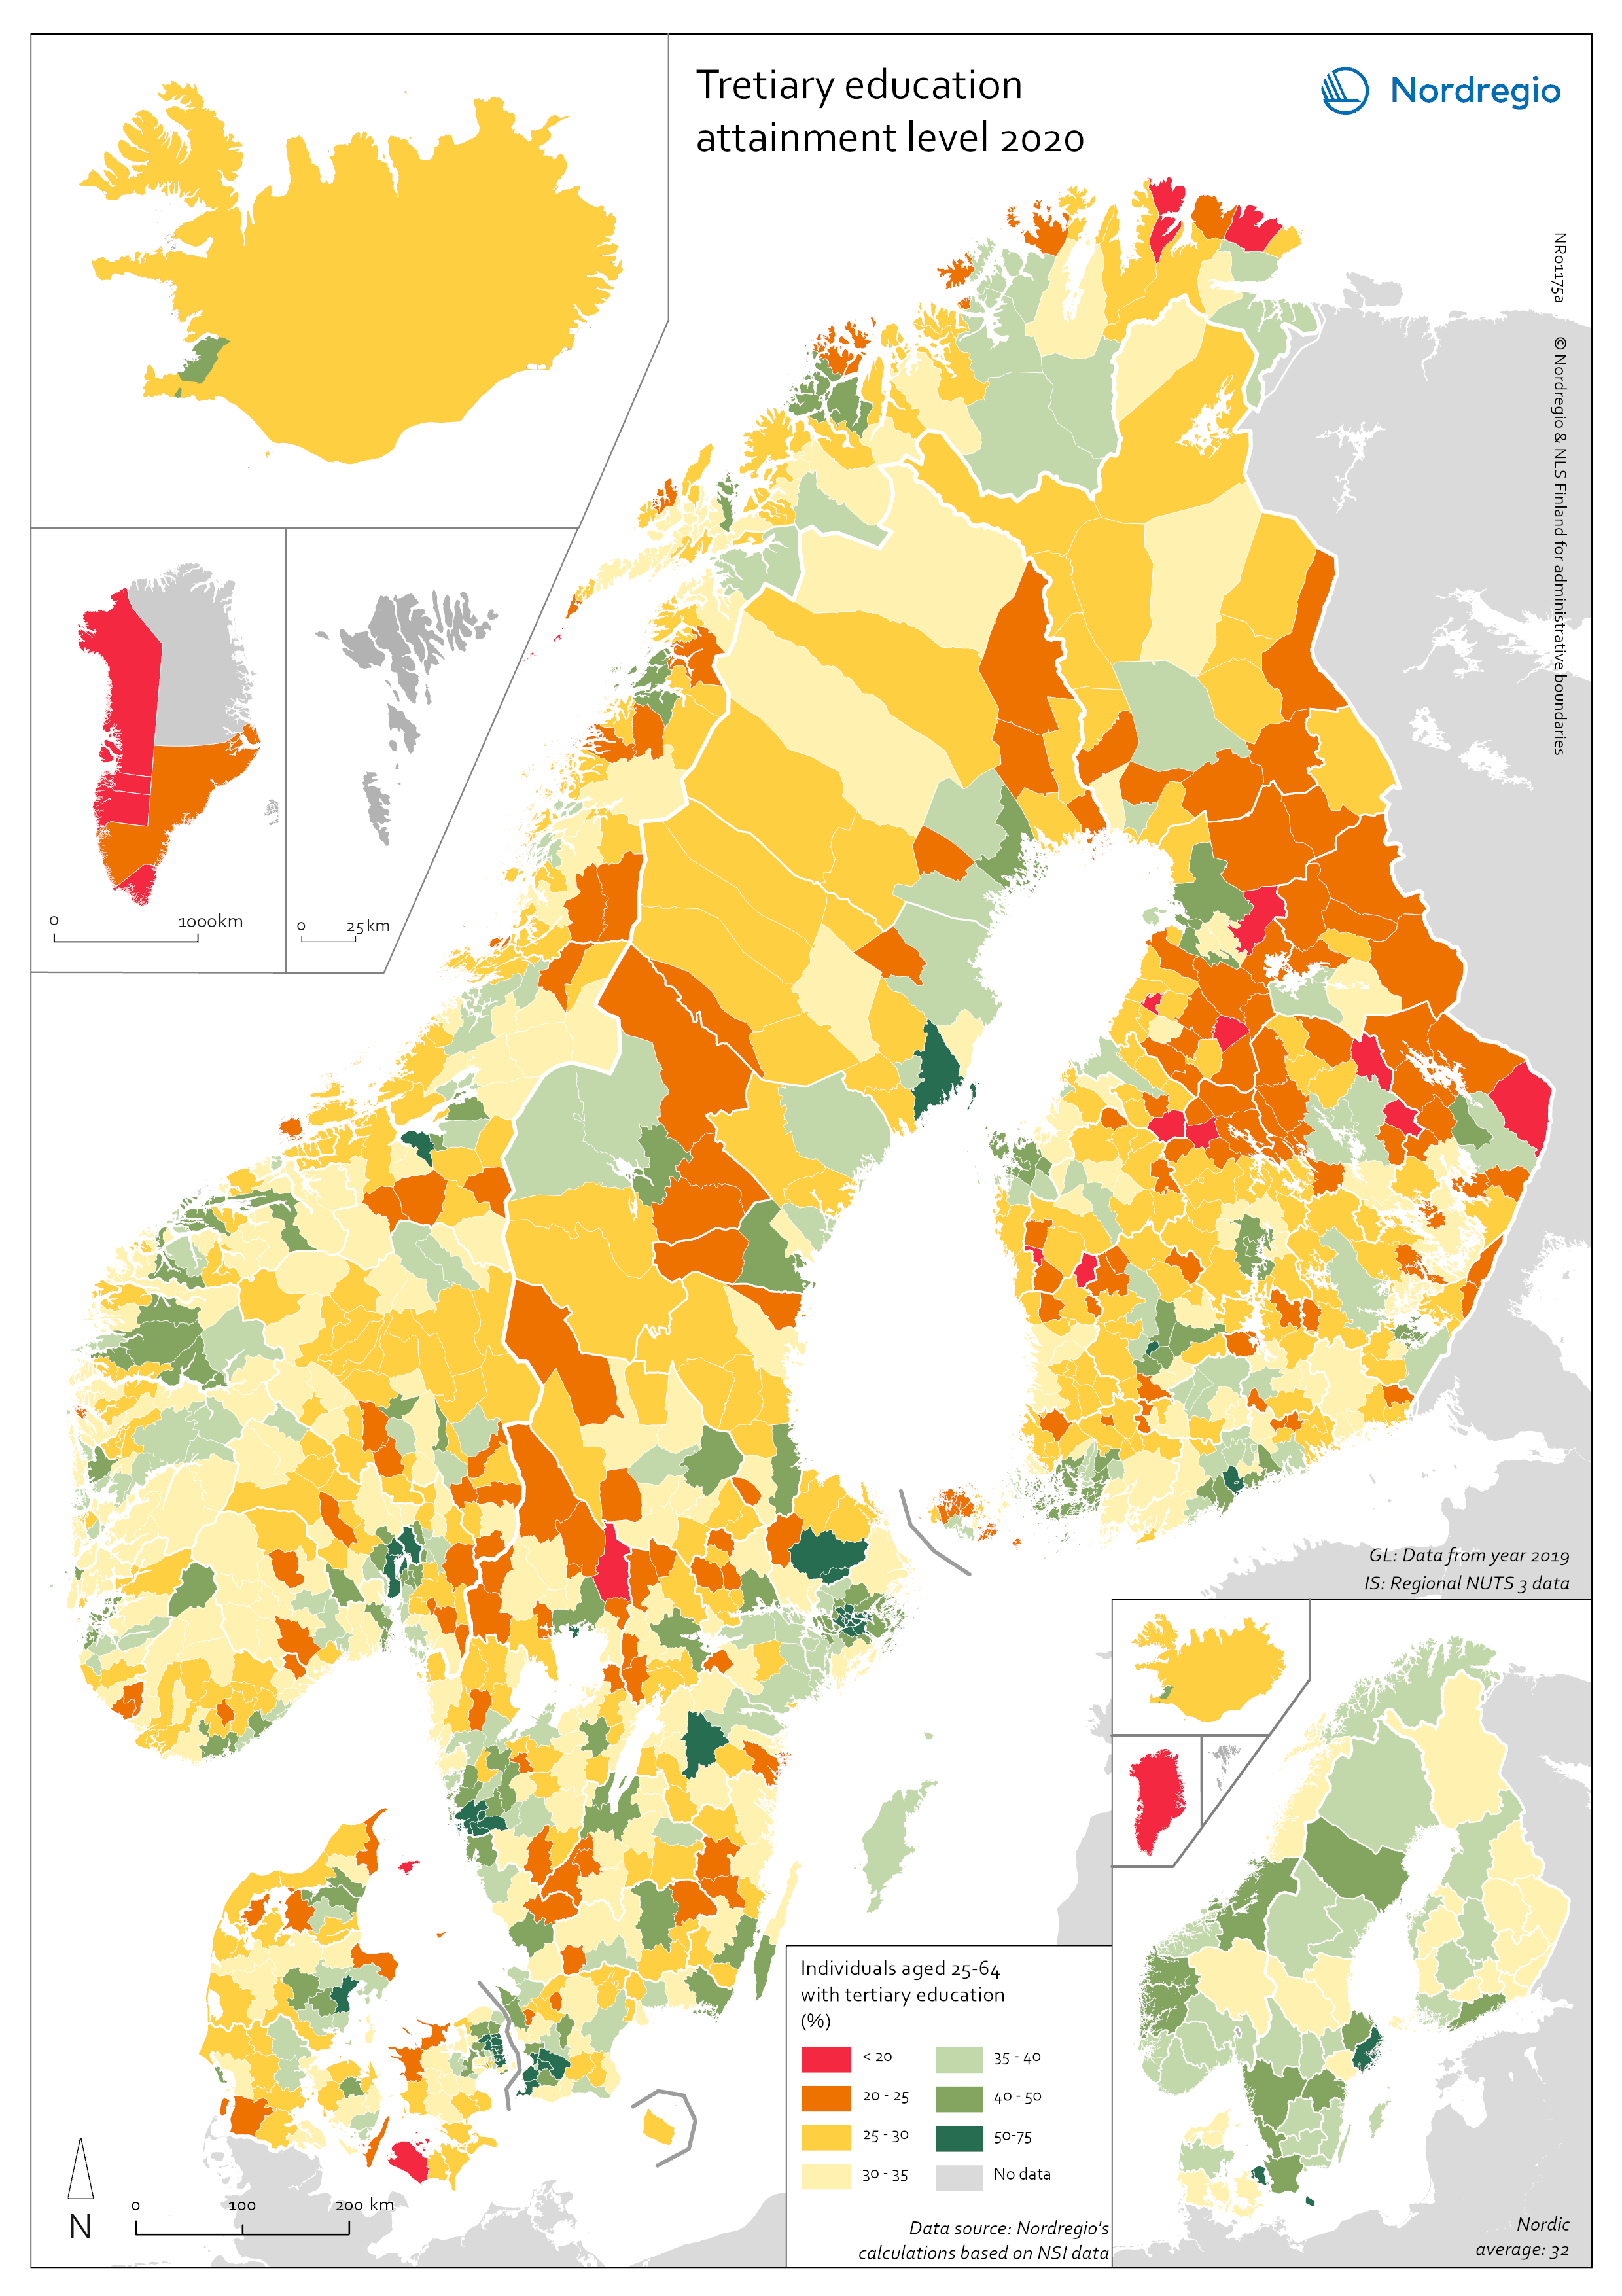
Tertiary education attainment level of 30- to 34-year-olds 2019
The map shows the proportion of the population aged 30-34 years old, who had a tertiary education at the European level in 2019. Purple shades indicate higher proportions, and pinkish shades reflect lower proportions. It is common to show the education attainment for the age group 30-34 since it is an age group where most people have finalised their studies. The focus on this age group makes it easier to see recent trends and outcomes of policies. Overall, over 40% of Europeans aged 30-34 years old had a tertiary education in 2019. Young people in the Nordic countries are among the most educated, with approximately half of 30 to 34-year-olds achieving a tertiary education across all Nordic countries. The highest proportions can be found in the capital regions. Stockholm is particularly noteworthy, with over 60% of 30 to 34-year-olds having had a tertiary education. Regions with prominent universities also stand out – for example, Skåne, Uppsala, Västerbotten and Västra Götaland (Sweden), Trøndelag (Norway) and Østjylland (Denmark).
- 2020 October
- Baltic Sea Region
- Demography
- Europe
- Nordic Region
- Others
Broadband speed availability and coverage
Ambitious broadband connectivity targets have been set across the Nordic Region, with most countries working towards universal access to download speeds of >100 Mbps for all households. The deadline for reaching this target varies between countries, from 2020 (Denmark) to 2023 (Iceland) to 2025 (Finland & Sweden). Norway aims to provide access to download speeds of >100 Mbps for 90% of households by 2020. The map measures progress towards these targets, showing the minimum download speed that was available to at least 50% of households in each municipality through a fixed-line connection in 2018, along with the proportion of households which had access this speed. The blue shading shows municipalities where over 50% of households had access to fixed broadband with download speeds >100 Mbps. The green shading indicates municipalities where less than 50% had access to fixed broadband with download speeds >100 Mbps but where at least 50% of the population had access to fixed broadband with download speeds >30 Mbps. The orange shading shows the percentage of households who have access to fixed broadband with download speeds >10 Mbps for municipalities where less than 50% of households have access to fixed broadband with download speeds >30 Mbps.
- 2020 May
- Nordic Region
- Others
Household coverage of NGA broadband 2018
These maps highlight the urban-rural divide with respect to household coverage of Next Generation Access (NGA) broadband in the Nordic-Baltic Region in 2018. NGA includes a range of technologies, all of which deliver minimum download speeds of 30 Mbps. The map on the left-hand side shows NGA coverage for “all households”, with darker shading representing higher levels of coverage. Here we see that over 75% of households have access to NGA coverage in most regions for most countries, with the exception of Finland and Lithuania. The highest levels of household coverage can be found in regions in Denmark, Iceland and Latvia. The map on the right-hand side shows the same indicator but includes only rural households. Here we see a quite different picture. In most of Finland and Lithuania, as well as many regions in Sweden, less than 35% of rural households have NGA coverage. Norway performs somewhat better, with NGA access for 35-65% of rural households in most regions. Again, regions in Denmark, Iceland and Latvia have the best coverage. Estonia also performs relatively well, with 65-95% of rural households covered in three of its five regions.
- 2020 May
- Nordic Region
- Others
Household access to broadband 100Mbps
Ambitious broadband connectivity targets have been set across the Nordic Region, with most countries working towards universal access to download speeds of >100 Mbps for all households. The deadline for reaching this target varies between countries, from 2020 (Denmark) to 2023 (Iceland) to 2025 (Finland & Sweden). Norway aims to provide access to download speeds of >100 Mbps for 90% of households by 2020. The map measures progress towards these targets, showing the percentage of households with access to a fixed-line broadband connection with a minimum download speed of 100 Mbps in 2018.* Darker shading represents proportionally higher levels of coverage. According to the map, a substantial proportion of households (>75%) had access to 100 Mbps in most Danish municipalities in 2018. Sweden also has relatively good fixed broadband coverage across most of the country, though there are several municipalities where coverage drops below 60% of households. The most limited coverage can be found in Finland, parts of Norway and the Westfjords and easternmost municipalities of Iceland. *Municipal level data was not available for the Faroe Islands or Greenland. Due to municipal level data availability, Icelandic figures are from 2020.
- 2020 May
- Nordic Region
- Others
Mobility changes due to COVID-19
This map shows the difference in mobility to workplaces between a weekday (April 23rd, 2020) and the corresponding weekday during the period January 7th to February 6th, 2020 (in percent). The data highlights the percent change in visits to workplaces within each administrative region in Denmark, Finland, Norway and Sweden. Data is not available for the Faroe Islands, Greenland, Iceland and Åland. Read more about the data here. The average value of the Nordic regions included in the map is a reduction by 34% of the number of visits to workplaces on April 23rd (in comparison to a baseline). This average value hides large variations within the Nordic Region with the most modest change occurring in Gotland (-12%) and the most severe change in Oslo (-57%). More generally, variations can be identified both between and within countries. The variations between countries reveal differences in recommendations and restrictions from published by the different national governments. Details for each country have been gathered by Info Norden and can be found here. As a result, the change in visits to workplaces decreased by 26% in Sweden, 39% in Denmark, 41% in Norway and 47% in Finland. The variations within countries also reveal differences in government´s decisions (e.g. lockdown of the Helsinki-Uusimaa region reducing the mobility to workplaces by 53%), but not only. There are indeed a number of local characteristics of the labour markets that contribute at explaining that the largest changes in mobility to workplaces are found in capital city regions. These local characteristics are a greater dependency on public transport for commuters, who are adviced to avoid using such means of transportation under the COVID-19 context; and having a higher share of jobs that can be done by teleworking, among others.
- 2020 May
- Labour force
- Nordic Region
- Others
- Transport
Nordic Midsummer analysis
After the long winter it is finally time to celebrate the solstice and the nightless nights in the Nordic countries, Midsummer. Or Sankthansaften, as they say in Norway, Sankthans in Denmark, Juhannus in Finland, Midsommar in Sweden and Jónsmessa in Iceland. To prevent any cultural and regional collisions during Nordic Midsummer festivities Nordregio dived into the Nordic celebrations to find out: Should there be a bonfire or maypole? Who is most concerned about rainy Midsummer weather? Nordregio undertook a thorough data collection (Google Trends) to create this representative picture of Nordic Midsummer interests. The analysis depicts different Midsummer activities with five different colors, in some regions it is a battle between the two most dominating interests (regions with two colors) and some regions have taken all the cherries on top and adopted a balanced midsummer interest (green). According to our analysis, the maypole dance, an old fertility rite, still lives on as a tradition in Sweden and Åland, while the actual dancing around the pole might have absorbed some new moves along the centuries. Instead of dancing, Finland and Denmark light bonfires to celebrate warmth and the power of the sun, except the region Satakunta in Finland which is busy worrying about the weather. Denmark takes the bonfire tradition one step further as they also burn a figurine witch in the fire. What should be served on Midsummer? Beer, when in Norway. With beer there should also be herring when celebrating with people from Sogn og Fjordane and prepare to light a bonfire when in Møre og Romsdal or Rogaland region. Sweden seems to have the most significant regional differences in traditions. While the rest of Sweden is dancing around the fertility poles, people on Gotland focus on sipping beer with herring. Värmland combines beer and dancing around the maypole…
- 2019 June
- Nordic Region
- Others
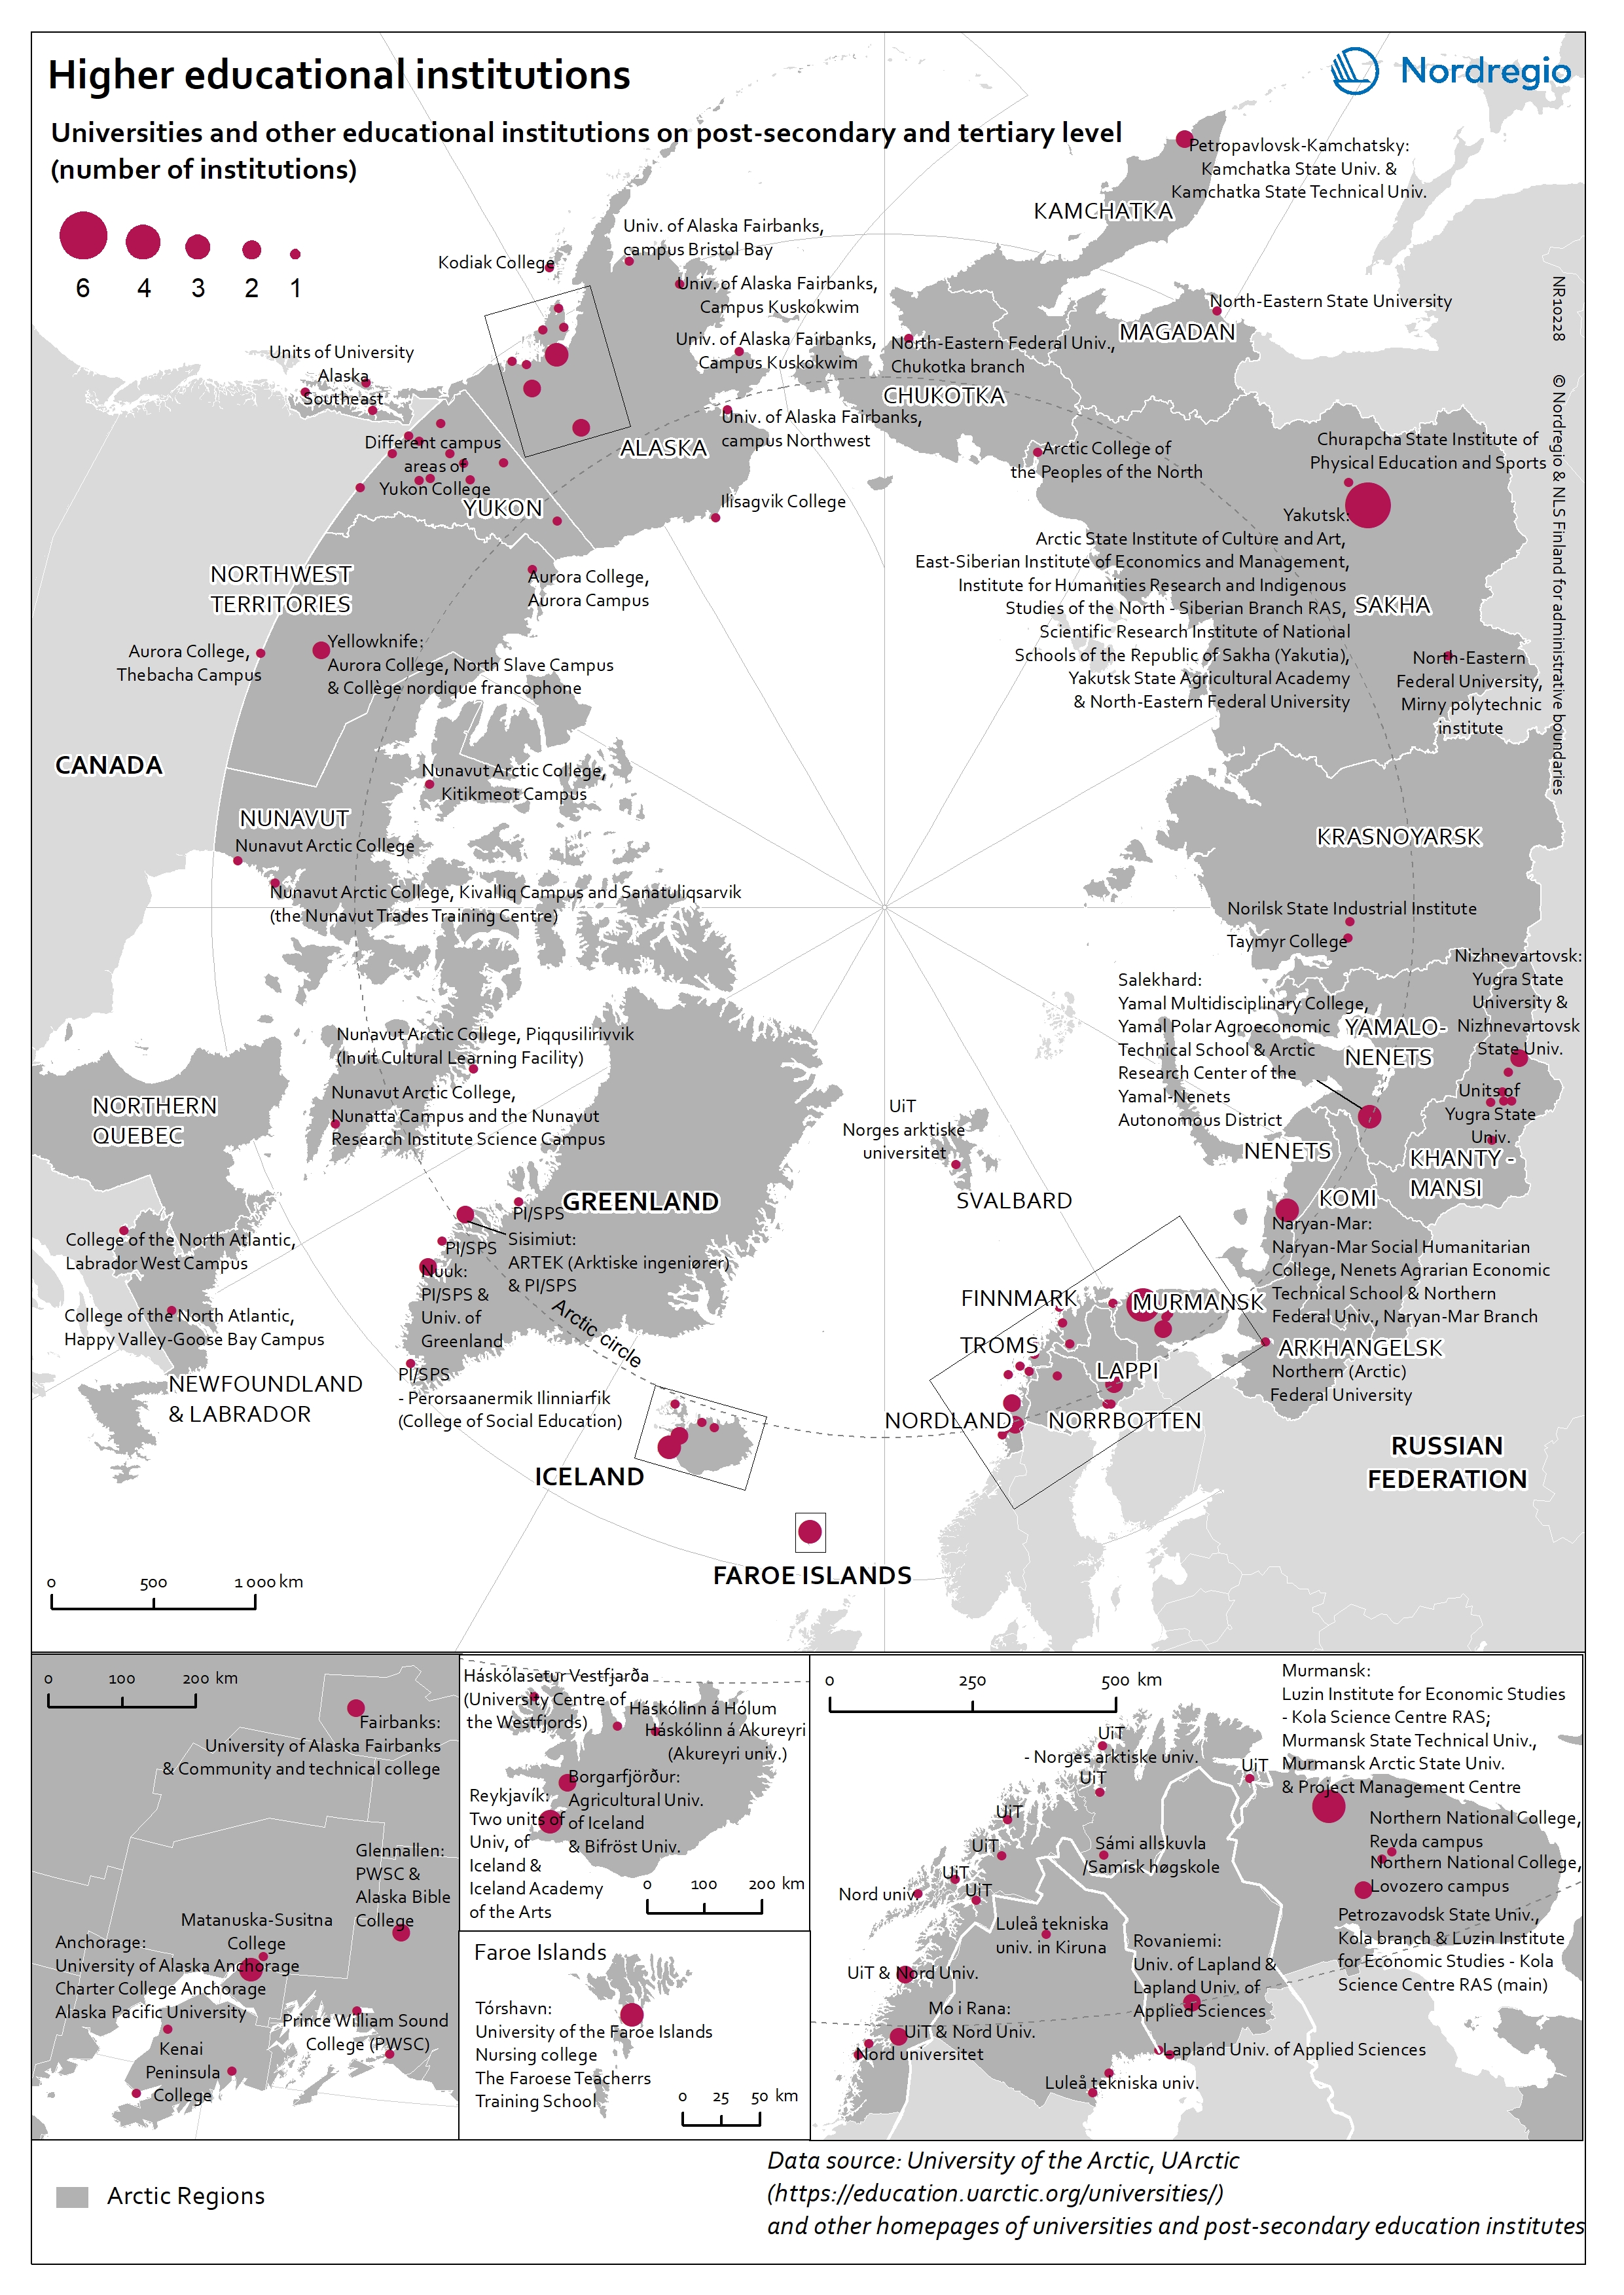
Higher educational institutions in the Arctic
The map shows universities and other educational institutions on post-secondary and tertiary level located in the Arctic. The red circles indicate a location of a university, college, or campus areas within the Arctic. The size of the circle corresponds to the number of educational institutions in a specific location. There is a high density of educational education institutions around Anchorage (Alaska), in Iceland, the Faroe Islands and the Arctic Fennoscandia (see zoom-in maps). In the Yukon (Canada), the Yukon College is the main educational institution, which has several campus areas across the region. In the Russian Arctic the largest centres with higher educational institutions are in Murmansk, Naryan-Mar (Nenets), Nizhnevartovsk (Khanty-Mansi), Salekhard (Yamalo-Nenets), and Yakutsk (Sakha).
- 2019 March
- Arctic
- Others
- Research and innovation
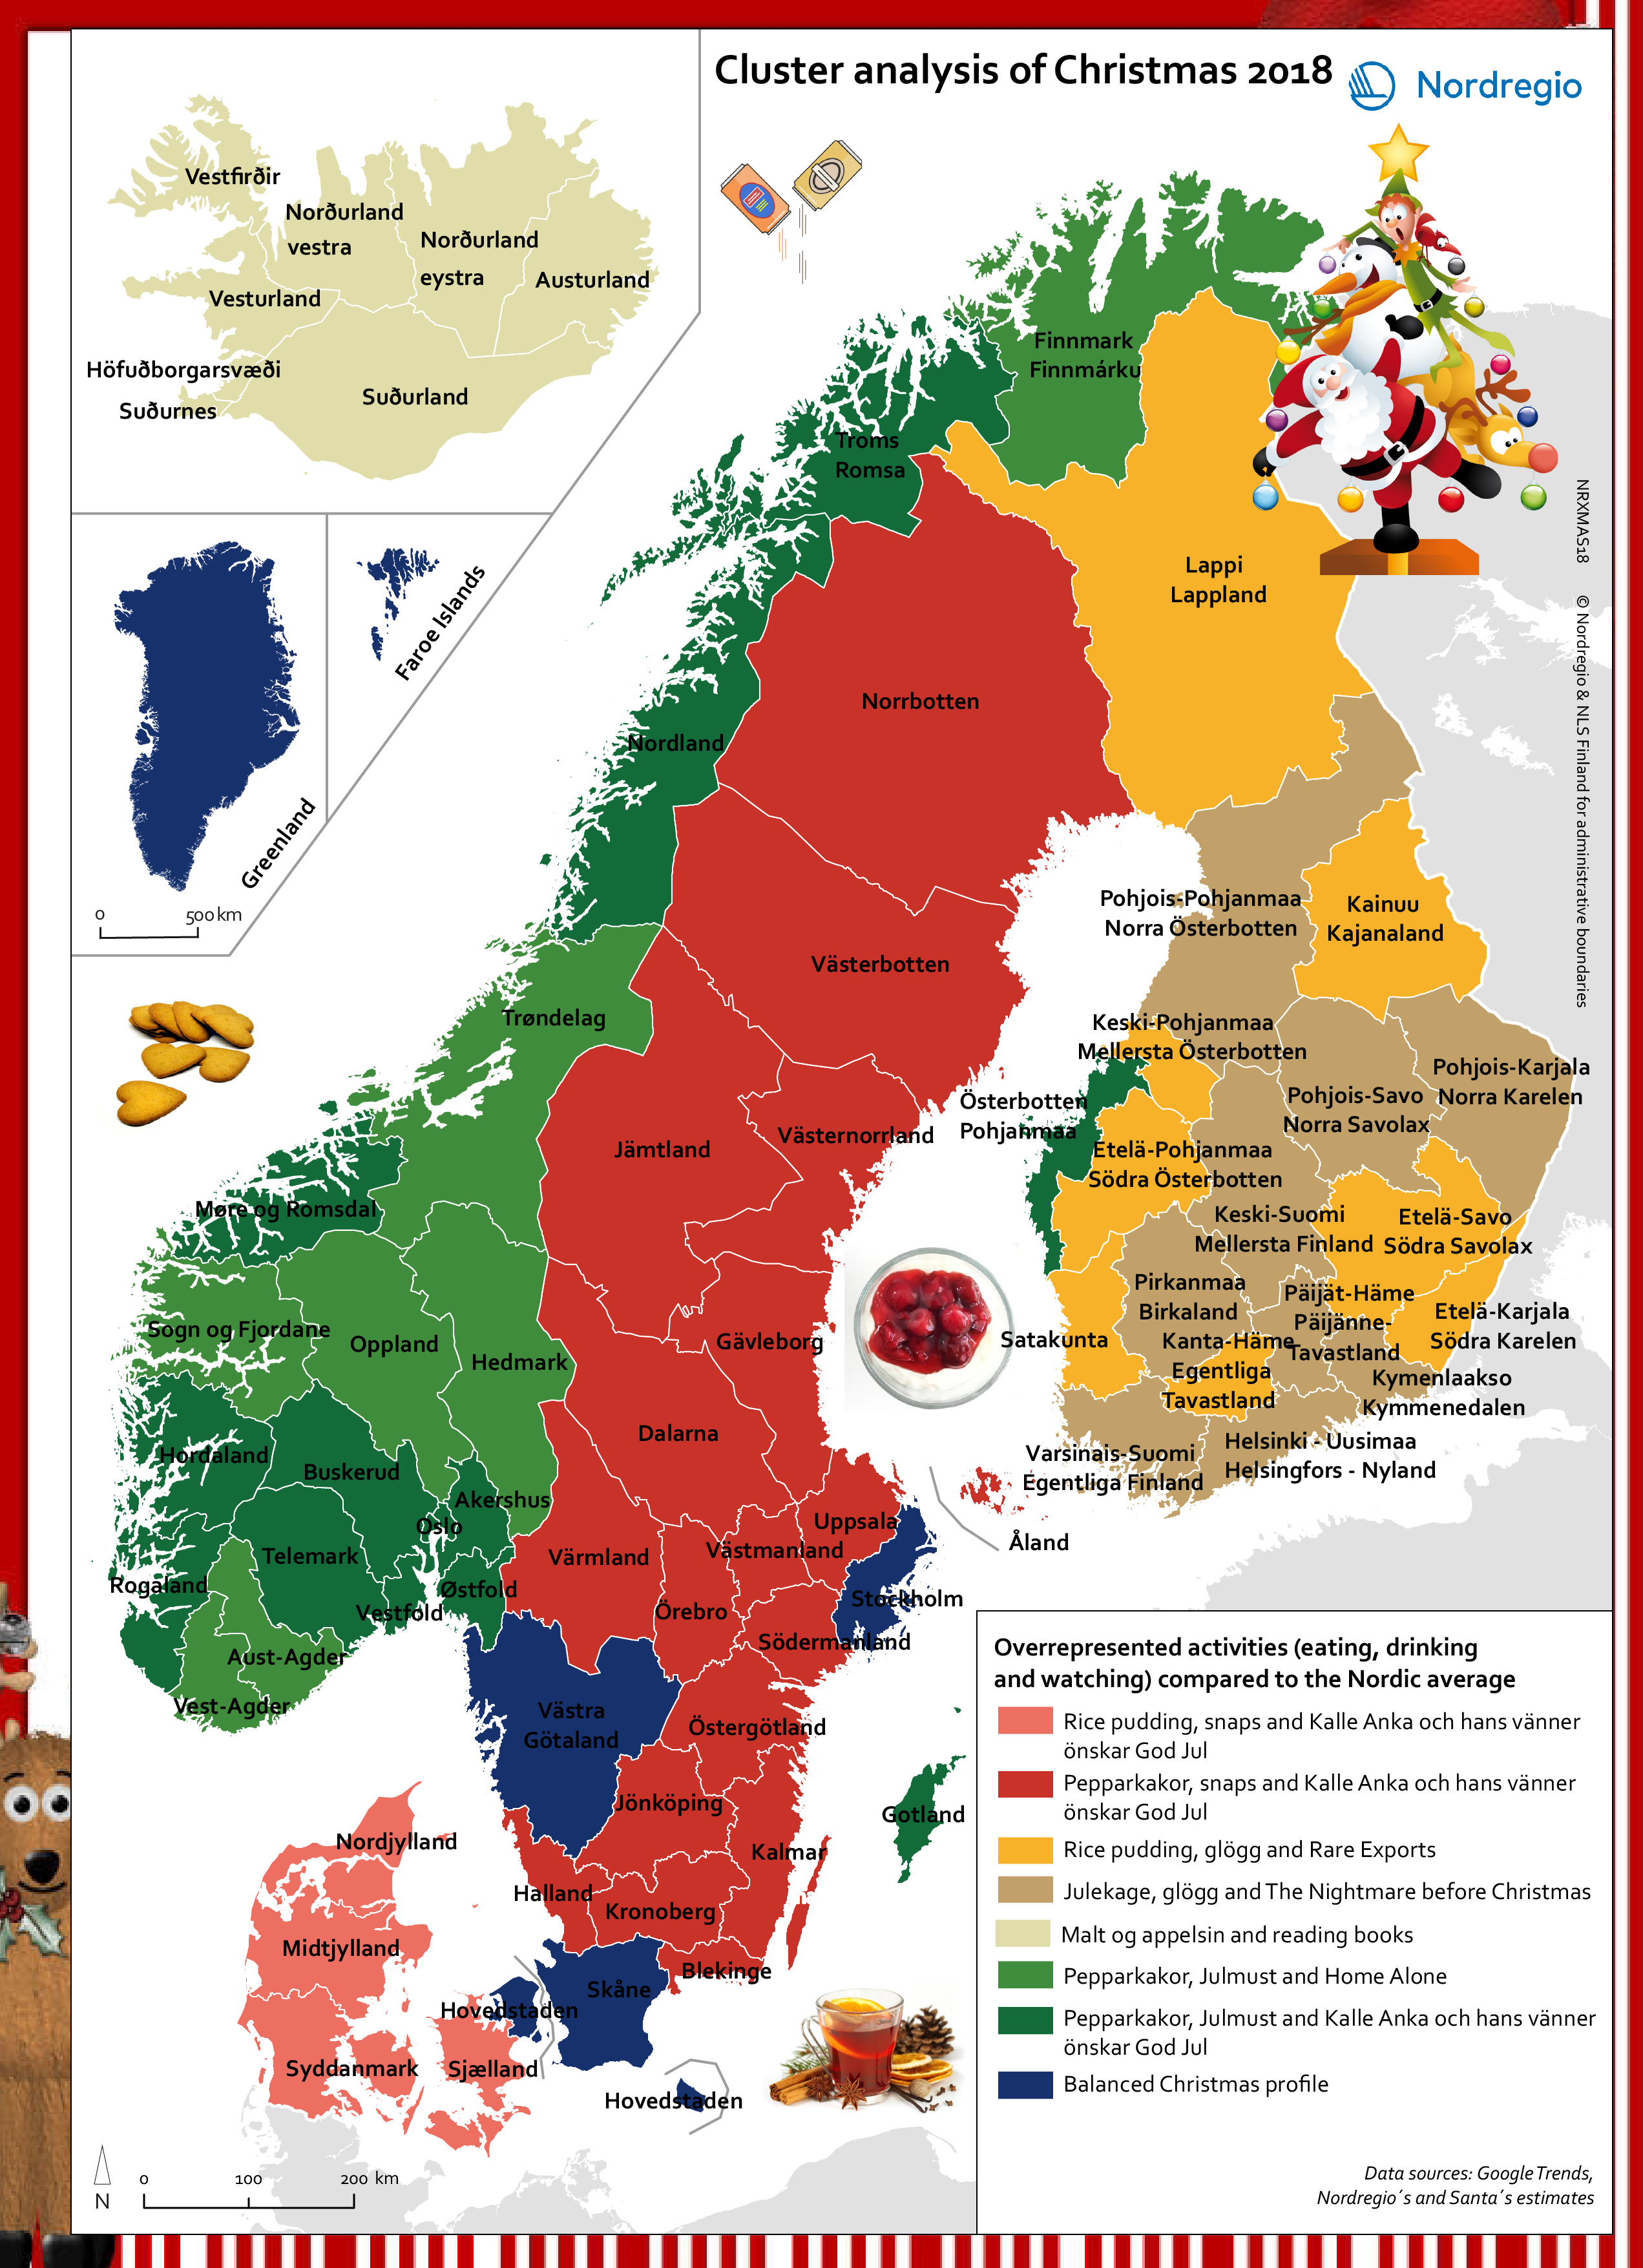
Cluster analysis of Christmas 2018
The Nordic Nightmare before Christmas: have we failed to integrate Christmas traditions? Risalamande, luumukiisseli, malt og appelsin, gløgg, julmust, Kalle Anka och hans vänner önskar God Jul, Home Alone and The Nightmare before Christmas are dishes, drinks and movies that are part of the Christmas season traditions in the Nordic Region. Nordregio, with a little help from Santa, has done a very thorough study across the Nordic Region on Christmas traditions and one observation is quite striking: the Nordic Christmas traditions are very country-specific and not integrated at all! Indeed, zooming-in at the regional level, there is not much variation within a country on how people spend their Christmas. In Norway for instance, pepparkakor and Julmust seem to be quite popular in all the regions, but there are differences among the favourite movies: Home Alone is the most searched movie in seven regions, including the newest administrative region of Trøndelag. The eight other regions of Norway, as well as Gotland and Österbotten, prefer Kalle Anka to accompany pepparkakor and Julmust. In Finland, Christmas seems to be connected to glögi and either rice pudding or Christmas cake. However, the main difference when compared the other parts of the Nordic Region is the favourite movie: Christmas comedies and romantic movies in Finland do not seem to be as popular as dark fantasy Christmas movies such as Rare Exports or The Nightmare before Christmas. In Åland, Sweden and Denmark, the large majority of regions highlight a preference for Kalle Anka och hans vänner önskar God Jul along with snaps. The main difference is in the Christmas treat: risalamande in Denmark and pepparkakor in Sweden and Åland. Note that a number of administrative regions have a balanced Christmas profile, i.e. no specific dish, drink or movie is significantly above the Nordic average. It can be explained by a relatively significant mix of citizens from different parts of the…
- 2018 December
- Nordic Region
- Others
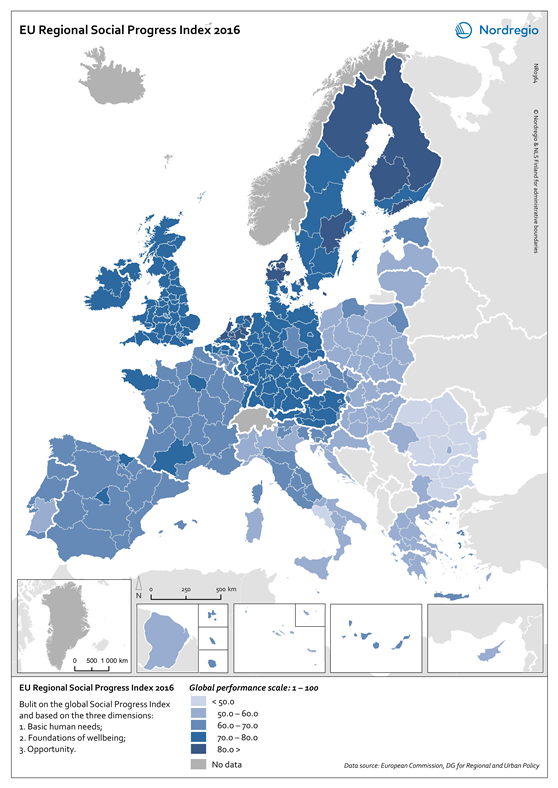
EU Regional Social Progress Index 2016
This map shows the regional social progress index in the regions of the European Union (EU) in 2016. Social progress is defined in this index as the capacity of a society to meet the basic human needs of its citizens, establish the building blocks that allow citizens and communities to enhance and sustain the quality of their lives and create the conditions for all individuals to reach their full potential. The EU Regional Social Progress Index is an aggregate index of 50 social and environmental indicators capturing three dimensions of social progress and its underlying components: basic human needs, foundation of well-being, and opportunity. This index is a complement to other indexes which are being developed currently to reflect similar dimensions of social situations or development. The blue tones indicate different levels of social progress index in the EU regions in 2016. The darker the tone the higher the social progress index. The grey colour indicates no data. All the Nordic regions perform well in terms of social progress. High scores are observed in all categories of the index. For some dimensions the Nordic regions are the top regions throughout Europe. At the regional scale the Nordic regions are among the top performers and only really challenged by some Dutch, UK, Austrian and German regions. The very top regions are found in Finland, northern and central Sweden, and in northern Denmark. Övre Norrland in Sweden is the top region in Europe, closely followed by the Danish capital region Hovedstaden, Helsinki-Uusimaa in Finland, Midtjylland in Denmark and Åland.
- 2018 February
- Demography
- Economy
- Europe
- Others
