53 News
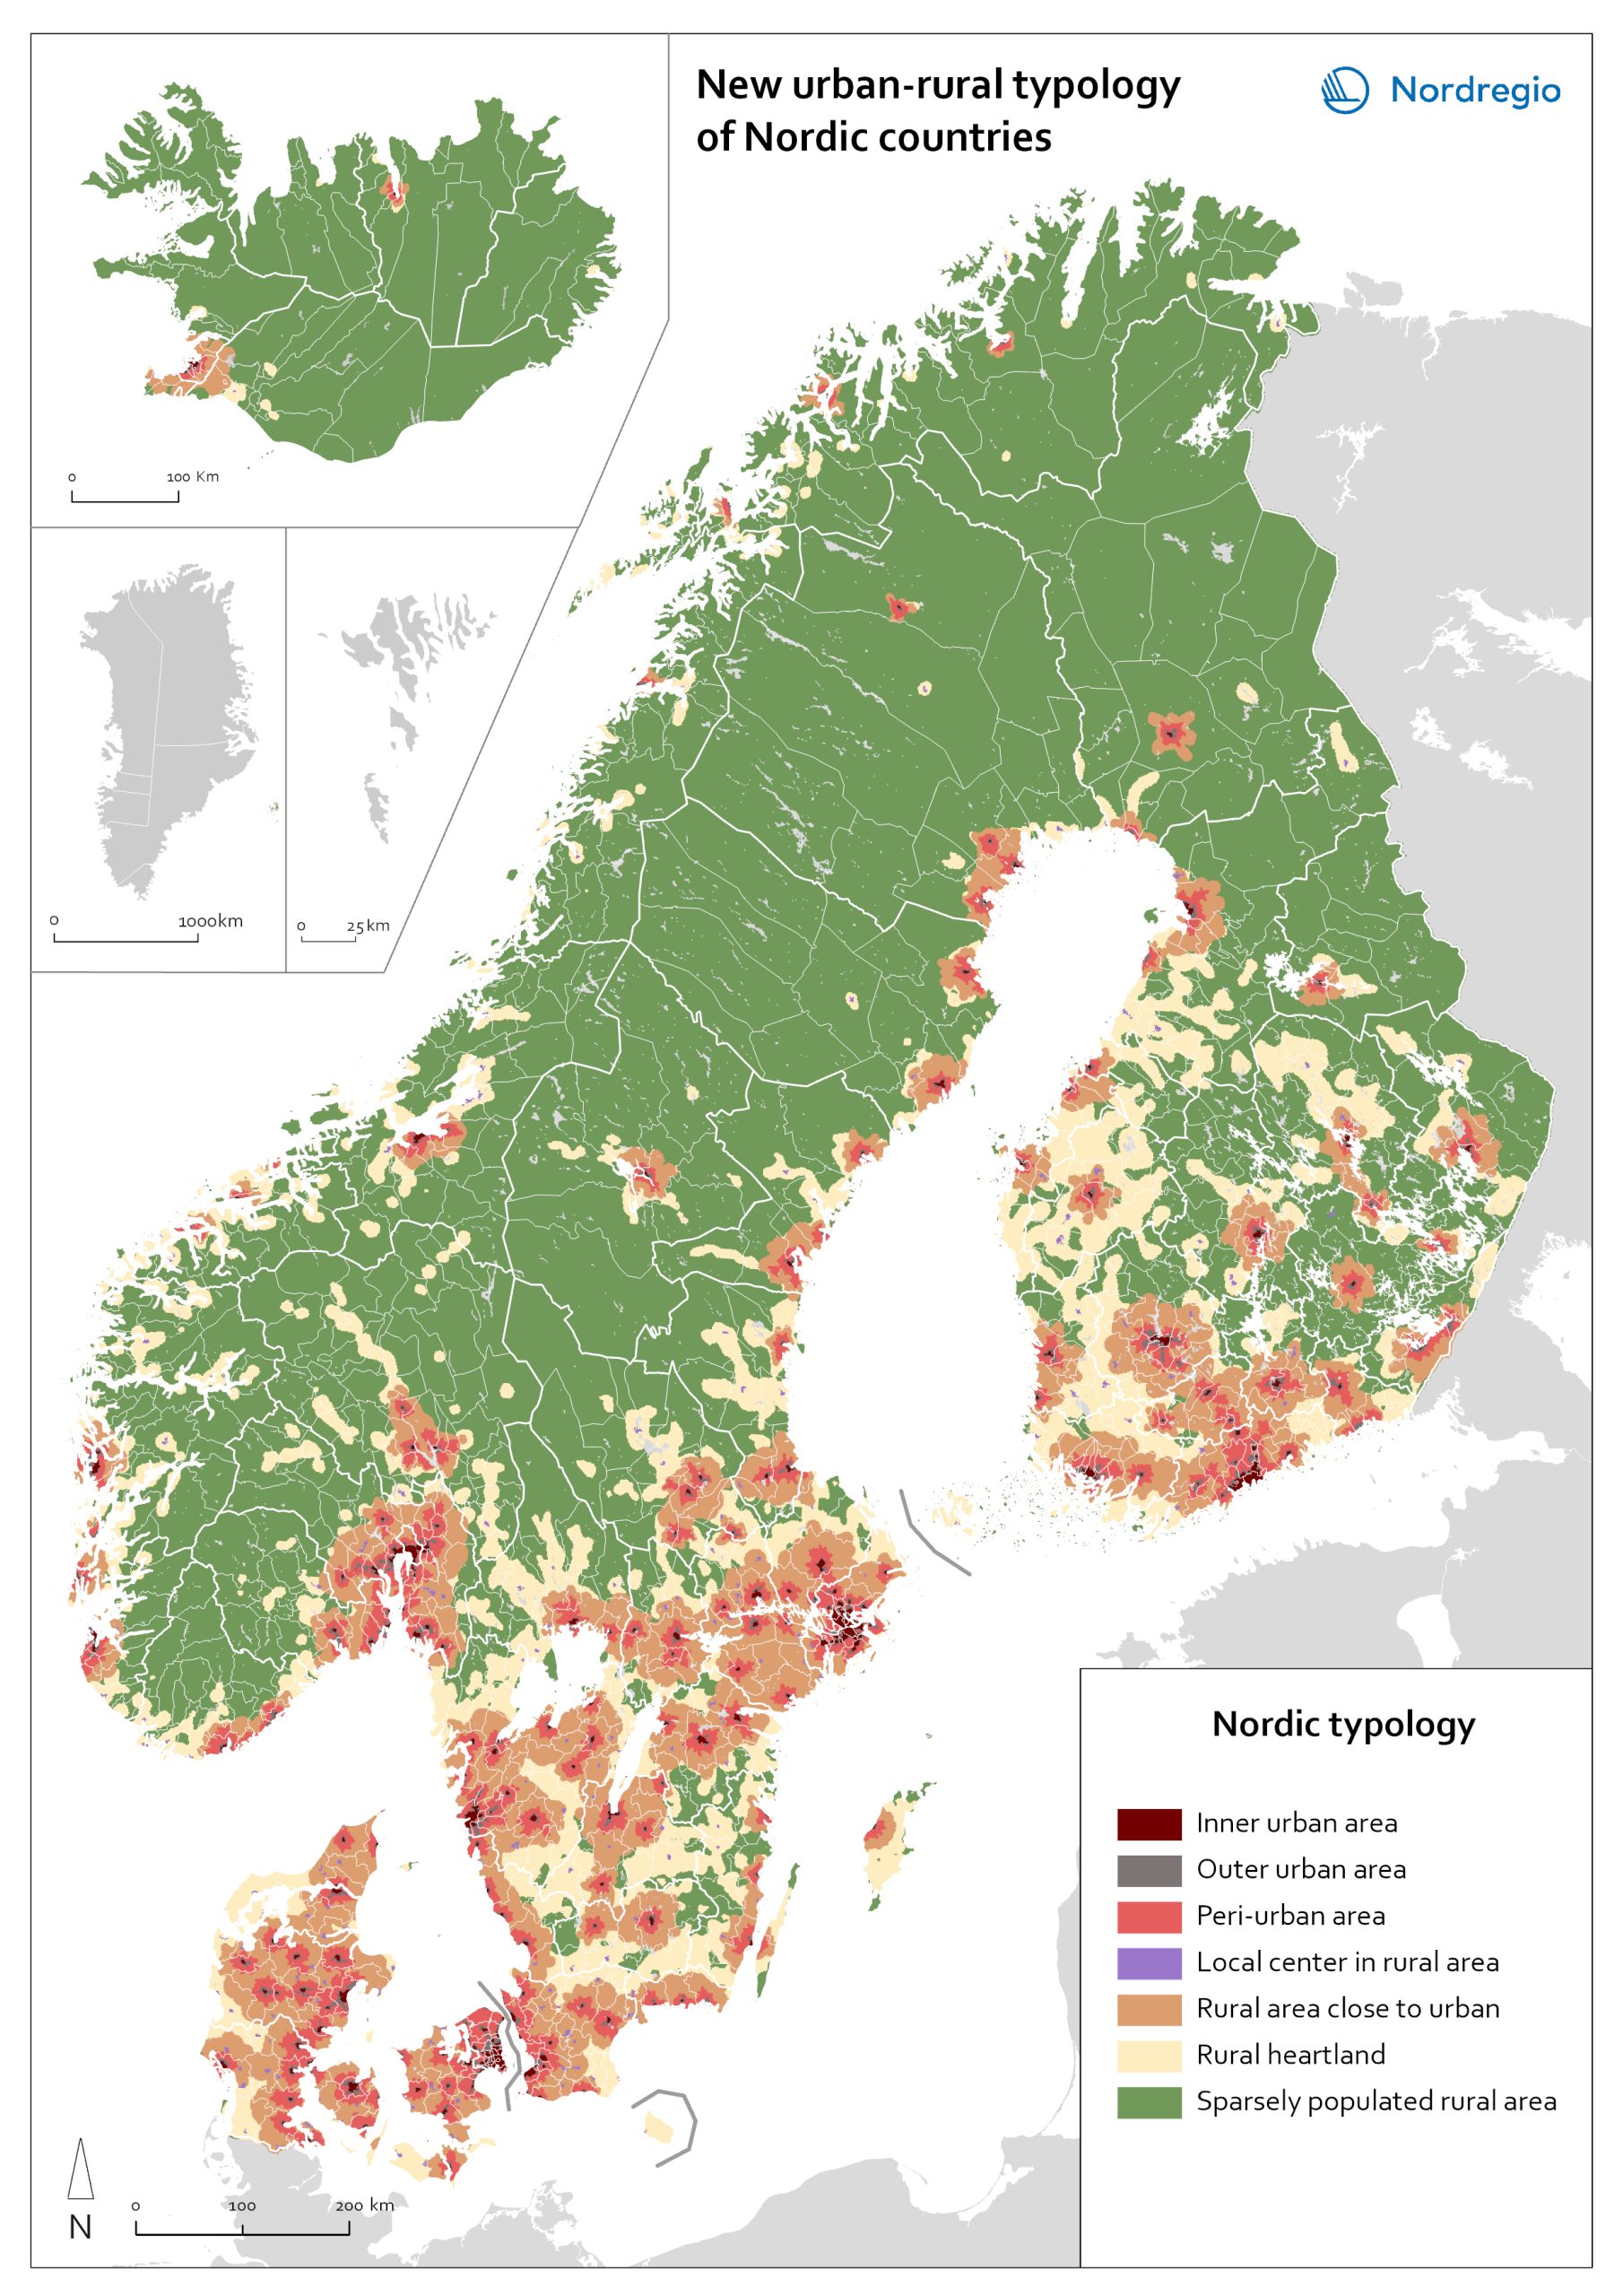
Urban-rural typology of the Nordic regions 2020
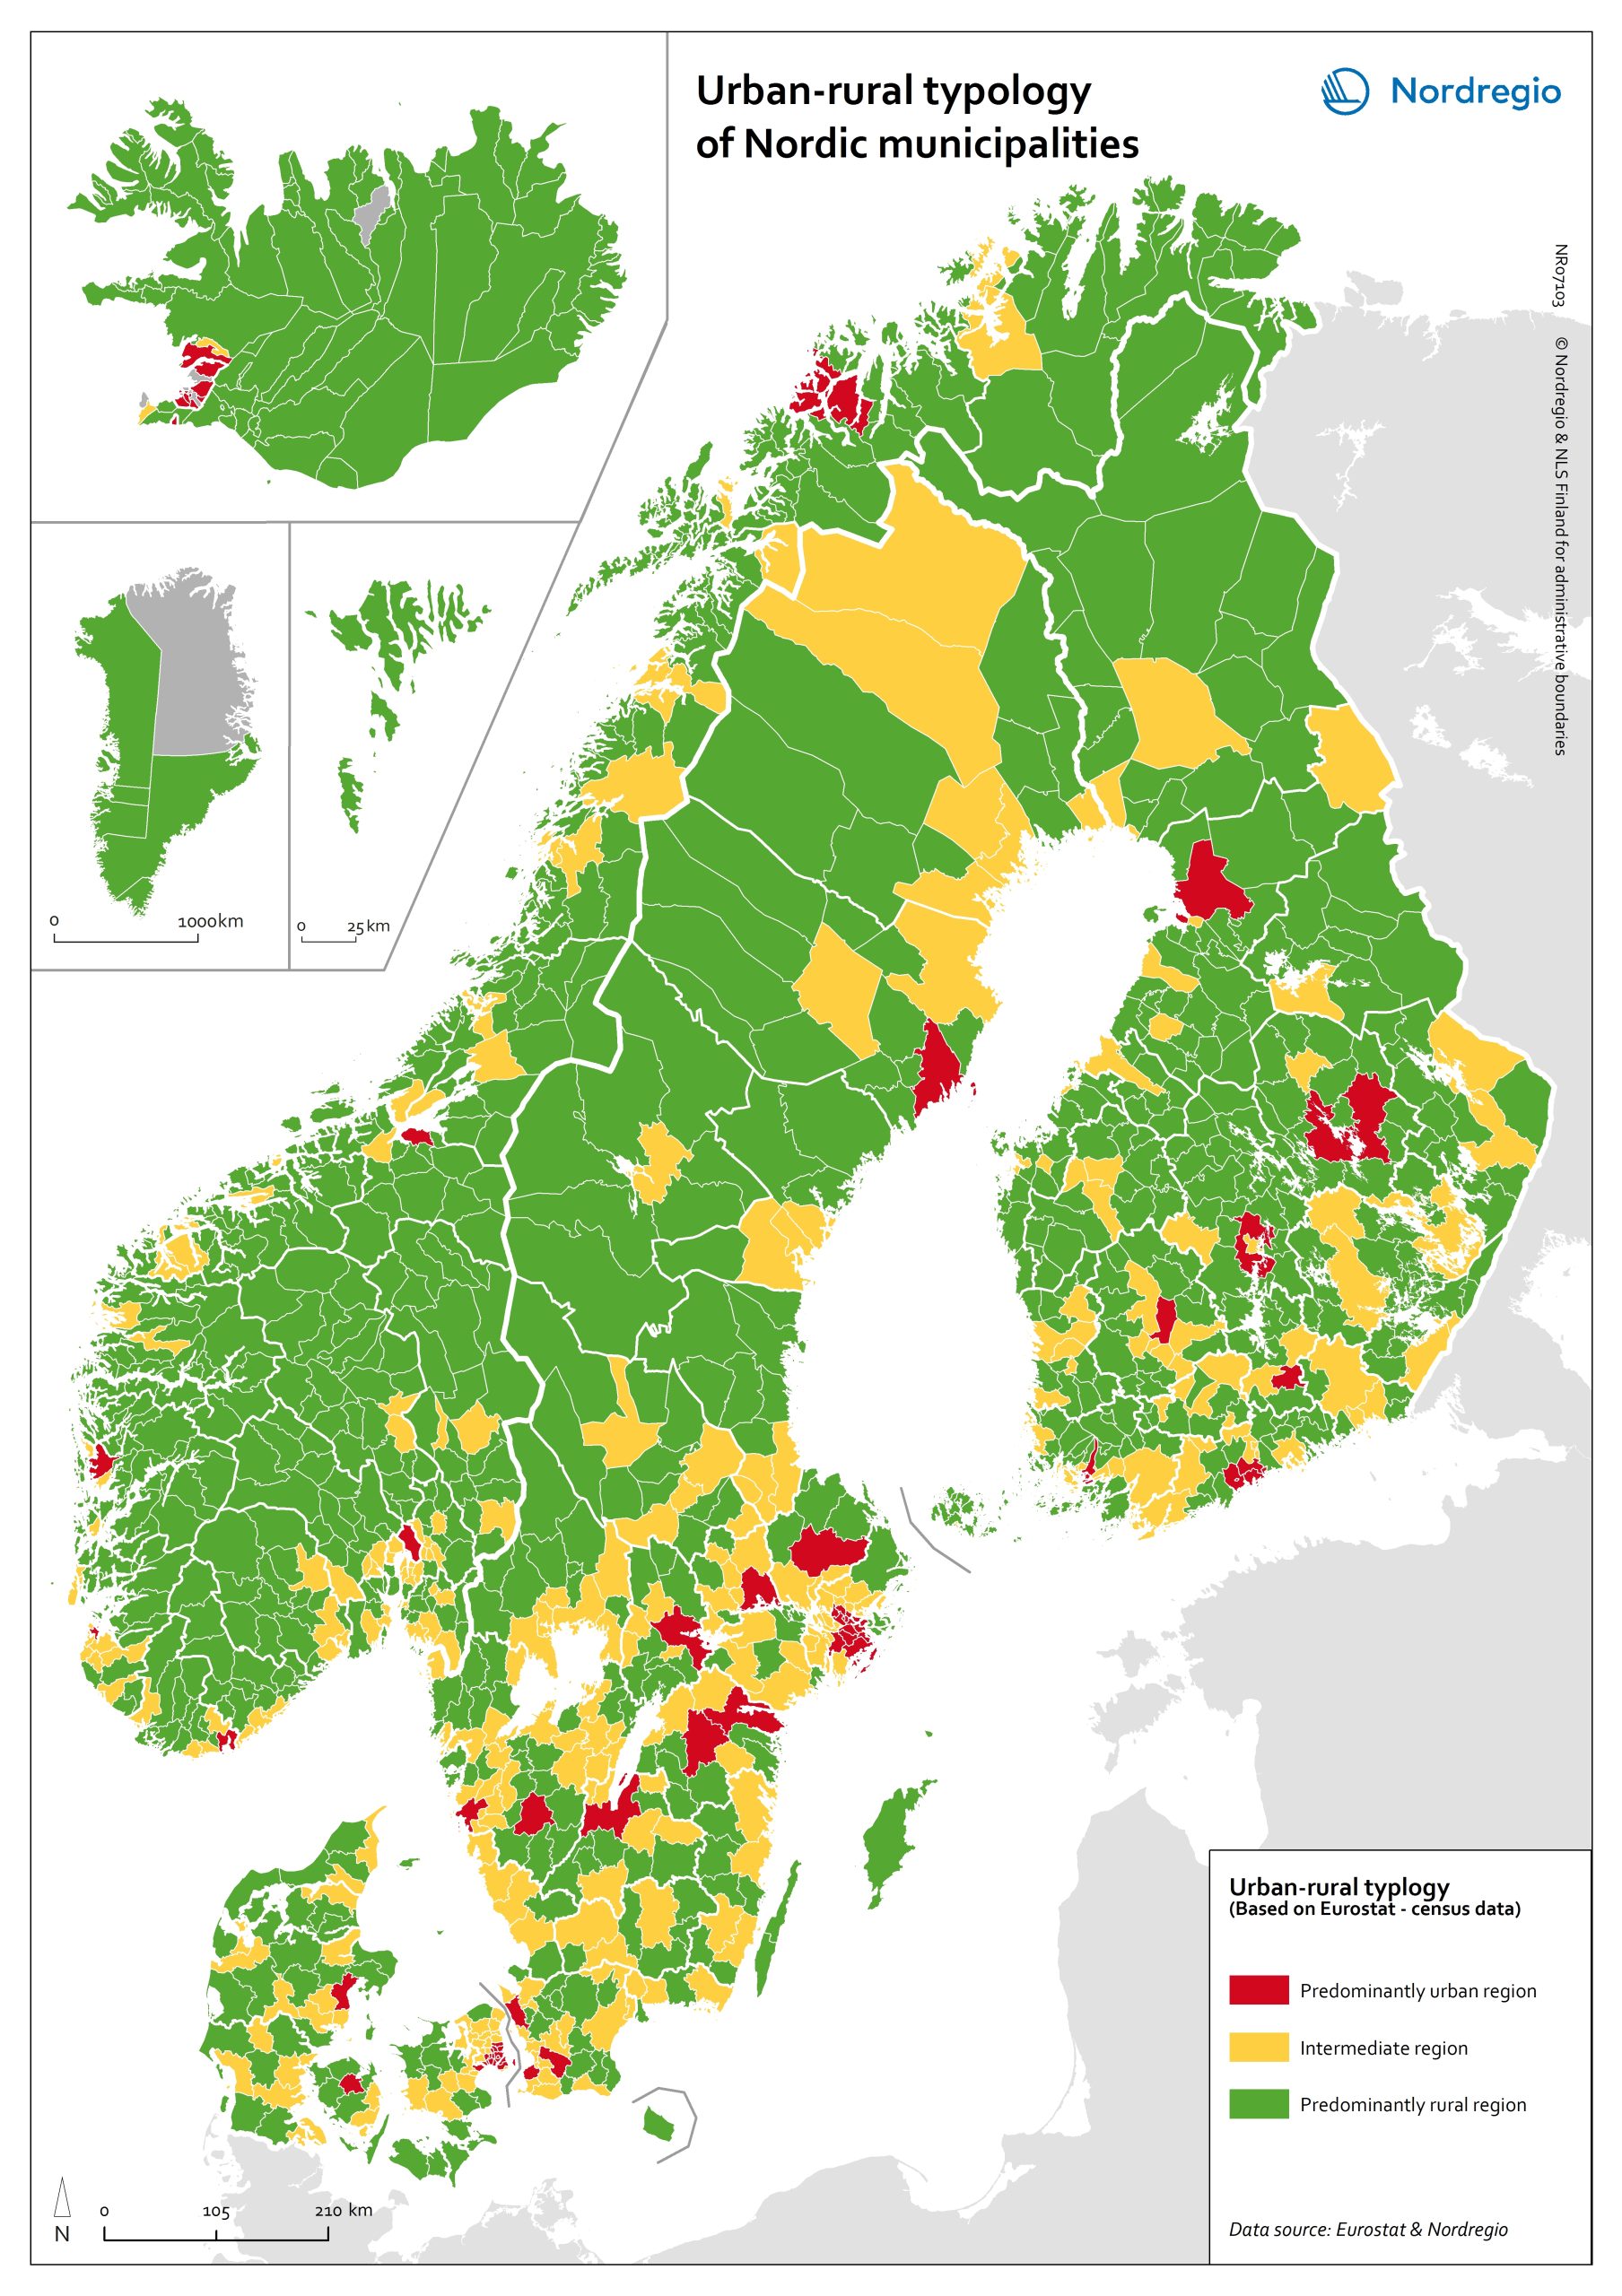
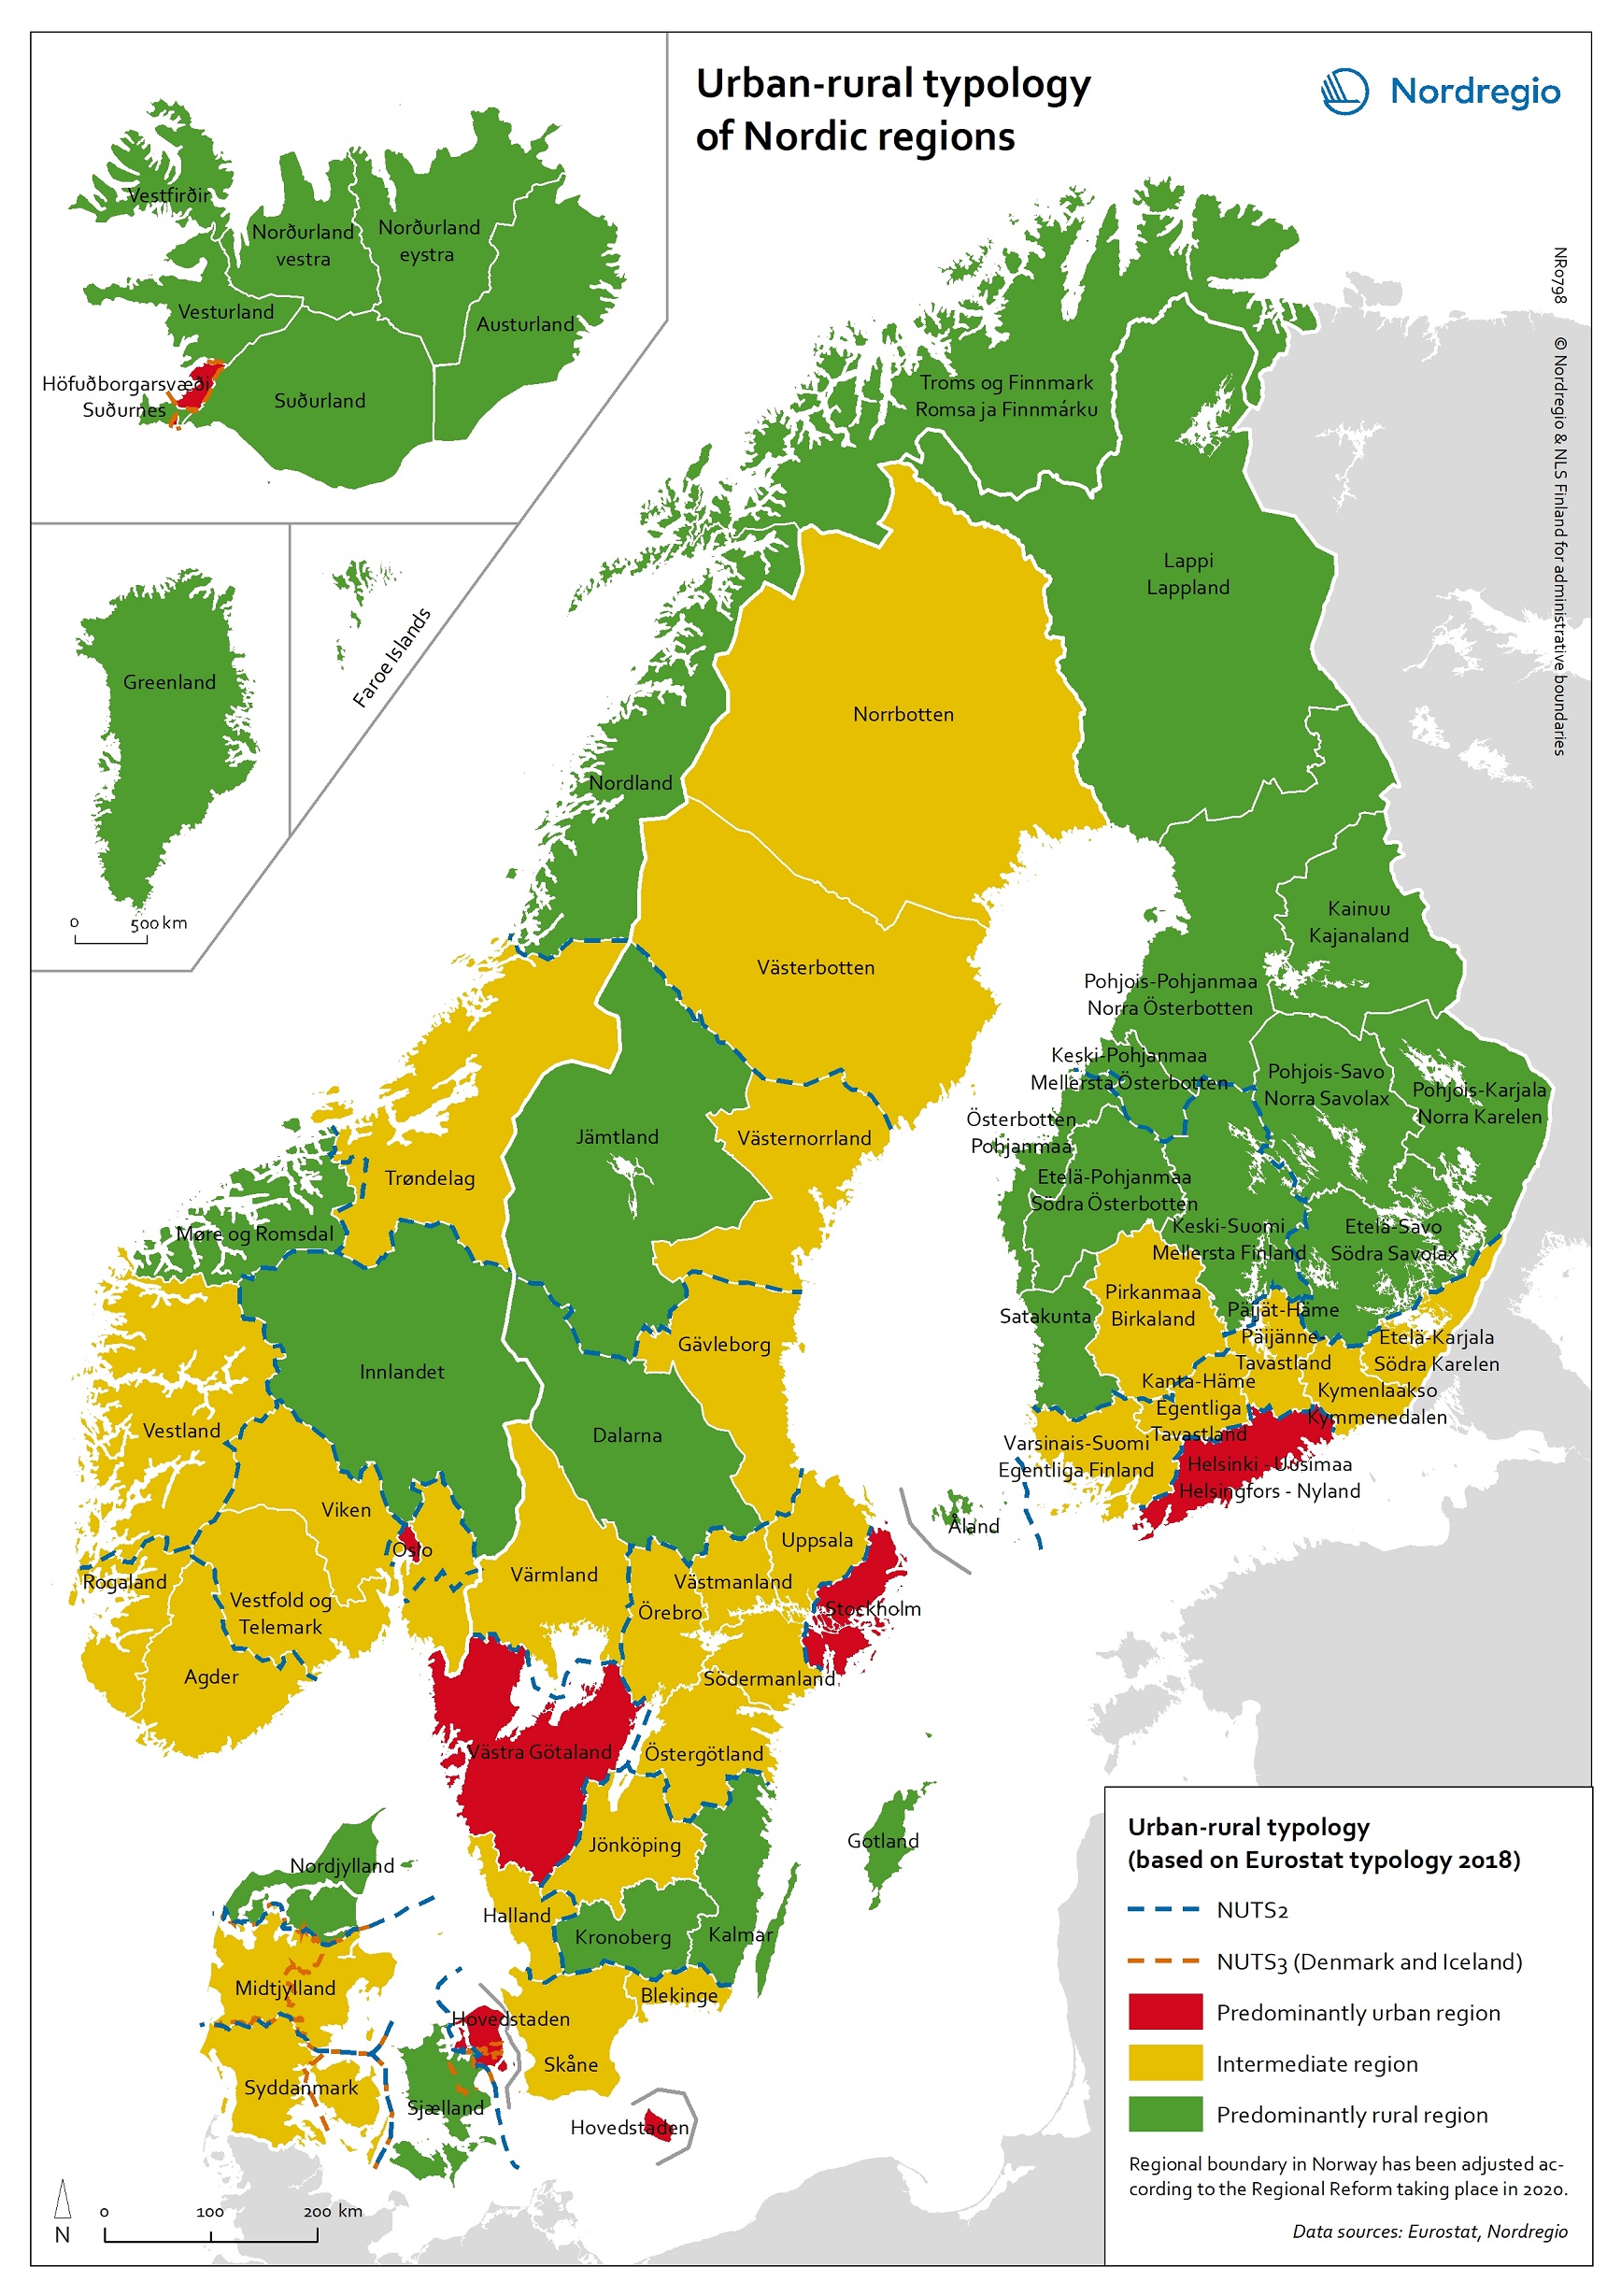
This map is included in the introduction of the State of the Nordic Region 2020 report. The map is based on the typology provided by Eurostat (2018), in which the 2016 NUTS 3 regions are classified in three categories according to their population density in 2011 and 2015, in 1 km² grids. In predominantly urban regions, at least 80% of the total population is urban, while in intermediate regions, 50–80% of the population lives in urban clusters. In regions that are predominantly rural, less than 50% of the population lives in urban areas. Read the digital publication here.
 2020 February
 - Administrative and functional divisions
- Demography
- Nordic Region
Municipalities by degree of urbanisation and functional urban areas
This map shows Nordic municipalities differentiated between their degree of urbanisation. The degree of urbanisation is the relationship between the population living in urban (and rural) areas and the total population of the municipality. The degree of urbanisation is a difficult concept to display but is useful as a way of adding nuance to the debate on urban-rural relations. The map also displays the functional urban areas in the Nordic Region. Cities with at least 50% of the population living in high-density clusters are highlighted in red. Towns and suburbs with less than 50% of the population living in high-density clusters and in rural areas are highlighted in dark blue. Rural areas with more than 50% of the population living in rural areas are highlighted in light blue. Functional urban areas are circled in black. The core cities of the 31 urban functional areas in the Nordic Region correspond to the cities as defined by degree of urbanisation. In the functional urban areas of Esbjerg and Aalborg in Denmark, for instance, there are however no densely populated urban centres. The hinterlands in most functional urban areas in the Nordic Region do include towns and suburbs as well as rural areas. Moreover, municipalities in sparsely populated areas can display a high degree of urbanisation, such as, for example, Kiruna and Gällivare in Sweden. The map is based on data from the Joint Research Center, the OECD Eurostat and EC-DG Region 2011 and 2014. In Iceland, the FUA Reykjavik is represented by NUTS-2 region IS001/Capital region.
- 2018 February
- Administrative and functional divisions
- Nordic Region
Saaʹmijânnam – Borders: 1949
The map shows the Skolt Sámi Land and the borders of national states in 1949. The Skolt Sámi Land is the home area for the indigenous Skolt Sámi people. During the Second World War, the Skolt Sámi land was the stage of violent acts of war. After the war, borders were again redrawn. The Soviet Union took the Petsamo area from Finland. The Skolt Sámi of Petsamo were given new settlement areas in north eastern Finland. In Norway and the Soviet Union, the Skolt Sámi remained an invisible minority. In all three countries, there was very little space for the Sámi. It took decades before the human rights of the Sámi received any attention. The map was produced for the exhibition Saaʹmijânnam – The Skolt Sámi Land in Äʹvv Skolt Sámi museum in Neiden, Norway. The map is the result of a collaboration between Äʹvv Skolt Sámi museum (responsible for the reconstruction of the Skolt Sámi areas and the exhibition), Yngvar Julin (concept of maps and exhibition architect), Nordregio (base maps) and Rethink. and illustrator Ruth Thomlevold (graphic design). Back to the main project page.
- 2018 January
- Administrative and functional divisions
- Arctic
Saaʹmijânnam – Borders: 1920
The map shows the Skolt Sámi Land and the borders of national states in 1920. The Skolt Sámi Land is the home area for the indigenous Skolt Sámi people. The borders through the Skolt Sámi Land were redrawn after the First World War. Newly independent Finland obtained the Petsamo area and thereby access to the Arctic Ocean. The Skolt Sámi living in that area became citizens of Finland instead of Russia. In Norway, the Skolt Sámi suffered from Norwegianization. On the Russian side, the Skolt Sámi were persecuted due to Stalin’s minority group policies. It became difficult to follow seasonal migration routes, a typical of the Skolt Sámi way of life. The Skolt Sámi of Suenjel area were the only ones able to carry out this traditional lifestyle. The map was produced for the exhibition Saaʹmijânnam – The Skolt Sámi Land in Äʹvv Skolt Sámi museum in Neiden, Norway. The map is the result of a collaboration between Äʹvv Skolt Sámi museum (responsible for the reconstruction of the Skolt Sámi areas and the exhibition), Yngvar Julin (concept of maps and exhibition architect), Nordregio (base maps) and Rethink. and illustrator Ruth Thomlevold (graphic design). Back to the main project page.
- 2018 January
- Administrative and functional divisions
- Arctic
- Migration
