23 Maps
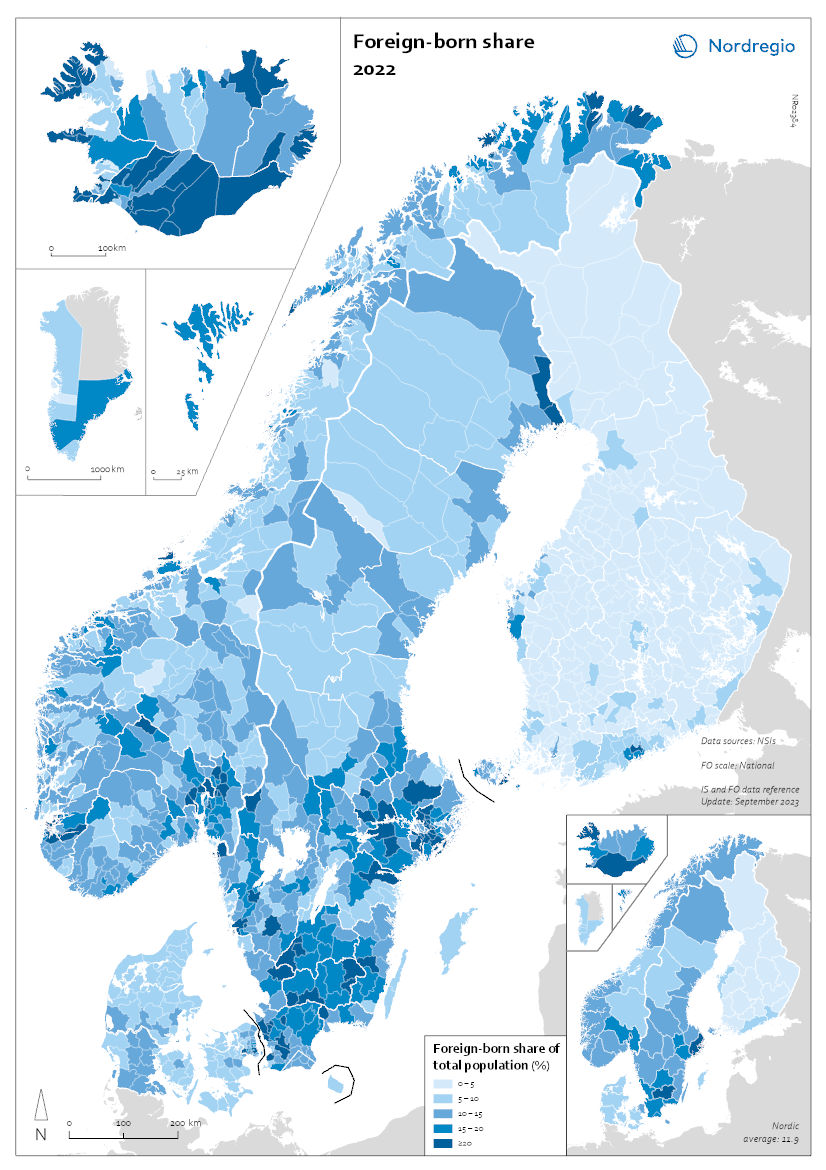
Foreign-born share 2022
This map shows the share of foreign-born of the total population in the Nordic countries. This map shows the share of foreign-born of the total population in Nordic municipalities (big map) and regions (small map), and municipalities (big map) in 2022. Iceland has the highest share of foreign-born residents in the Nordic Region, at 22%. Mýrdalshreppur, the municipality in the south containing the village of Vik, has the largest foreign-born population, at 58%. It is also the only municipality in the Nordic Region with a majority non-native population. Other municipalities in the south, some of which are quite small, also have significant foreign-born populations. Reykjanesbær, near Keflavik airport, is the largest municipality with a sizeable foreign-born population, at 29%. In Reykjavíkurborg, 20% of the population is foreign-born, about the same as the national average. Many municipalities with tiny populations in the Westfjords and the north also have small shares of foreign-born persons. In 2022, 17% of the population of Norway was foreign-born. Municipalities with high shares of foreign-born include Oslo (28%), several suburban municipalities near Oslo, and a few in the north – which have small overall populations but large numbers of foreign workers employed in the fishing industry. In Sweden, 20% of residents are foreign-born, with large differences in distribution by region and municipality. At the regional level, Stockholm has the highest share of foreign-born persons (27%), followed by Skåne, including the city of Malmö (24%). The percentage of foreign-born persons in Västra Götaland, which encompasses Gothenburg, is the same as that of Sweden as a whole. The regions with low shares of foreign-born persons are in the north of the country – Dalarna, Gävleborg, Västernorrland, Jämtland, Västerbotten, and Norrbotten – plus the island of Gotland, which has the lowest share (9%). There are no municipalities in which foreign-born…
 2025 April
 - Demography
- Migration
- Nordic Region
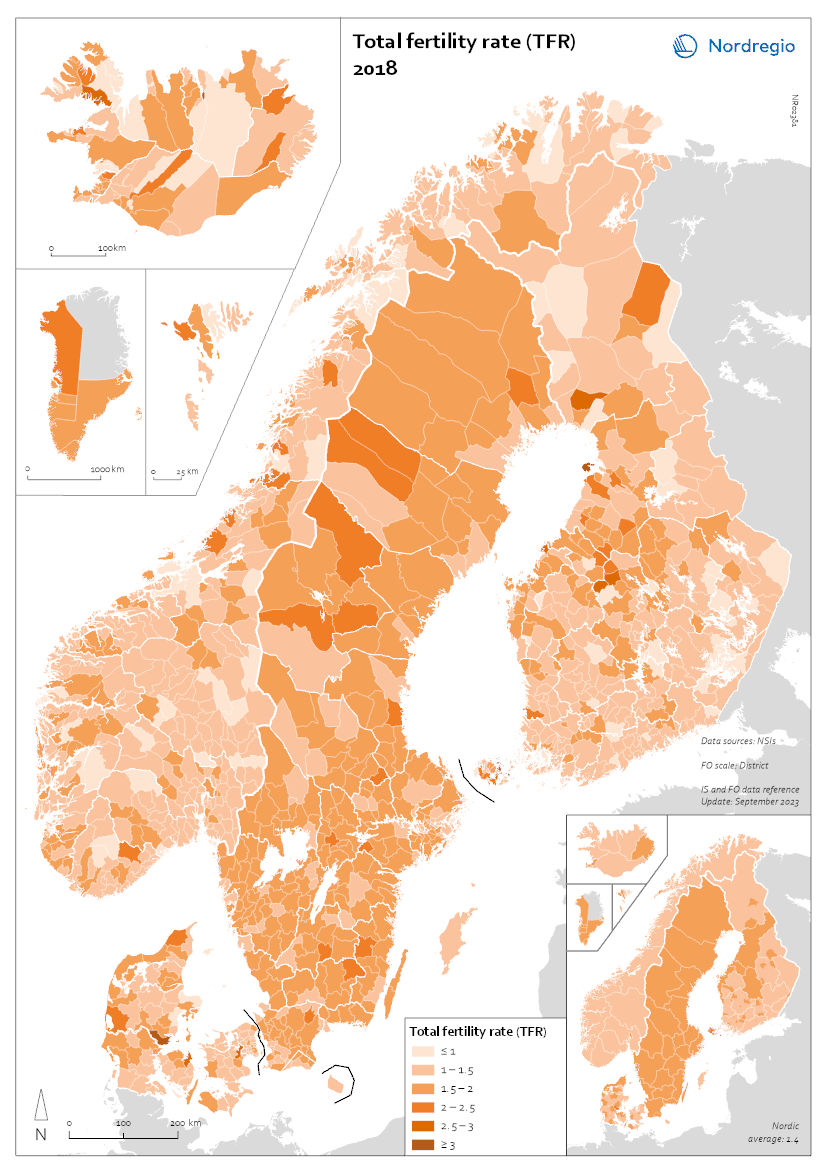
Total fertility rate (TFR) 2018
This map shows the total fertility rate (TFR) in 2018. The total fertility rate is the number of children a hypothetical cohort of women would have in one year. Data on total fertility rates is not available at the regional or municipal levels for all of the Nordic countries. The figures are estimated based on multiplying the general fertility rate by 30 (representing the typical number of reproductive years, between 15 and 45), assuming the general fertility rate is constant throughout this period. The general fertility rate is the number of births per woman during the childbearing years. At the regional level, age and gender composition are indicative of past trends but also harbingers of future population change. In 2018, prior to the pandemic, most Nordic municipalities had fertility levels in line with their respective national levels. Most municipalities within Greenland and the Faroes had fertility rates above 1.5 children per woman, consistent with national rates of about 1.9. Municipalities in Sweden and Denmark typically had fertility rates of 1.5 or higher, consistent with their national rates of 1.7. By contrast, many municipalities in Norway and Finland had fertility rates of 1.5 or lower. Iceland and Åland also showed varying rates across municipalities, ranging from 1 to over 1.5.
- 2025 April
- Demography
- Nordic Region
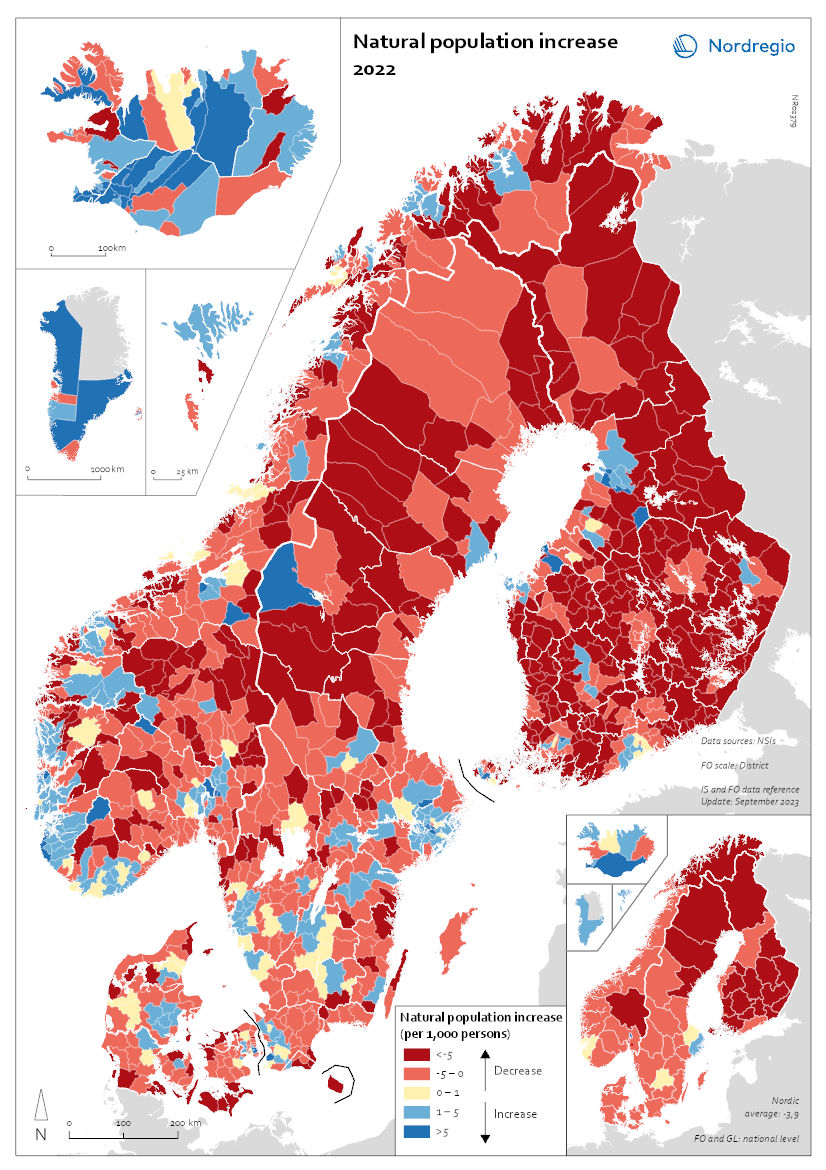
Natural population increase 2022
This map shows the natural population change per 1,000 persons in 2022. This map shows the natural population change per 1,000 persons in 2022 (i.e. between 1 Jan and 31 Dec 2022). Natural population change refers to births minus deaths (i.e. population change disregarding migration). The small map shows the result on a regional level, and the big map shows changes on the municipal level. Red shades refer to population decrease, blue shades to population increase, and yellow shades to balanced development. The map shows that levels of natural population change do not only vary across but also within the Nordic countries. Urban areas such as Stockholm and Gothenburg in Sweden; Oslo and Bergen in Norway; Copenhagen and Aarhus in Denmark; as well as Helsinki and Turku in Finland all experienced positive natural population change. This can be attributed to the comparatively young population age structure of these urban centres. Young people of child-bearing age often cluster in cities for study and work, and many start families there. By contrast, rural and remote areas often have a higher proportion of older people and, as such, tend to register more deaths than births, resulting in negative natural population change. These patterns are particularly pronounced in Finland but also in the northern parts of Sweden and Norway. Nonetheless, there are exceptions. In Iceland, Greenland, and the Faroe Islands, which had comparatively high levels of natural population growth at national level, a majority of municipalities, including many in rural areas, still registered more births than deaths in 2022 (77% of municipalities in Iceland, 60% in Greenland, 67% on the Faroe Islands). In the other Nordic countries, only a minority of municipalities, mostly in urban centres, recorded natural population increase in 2022 (30% in Norway and Sweden, 26% in Denmark, 12% in Finland).
- 2025 April
- Demography
- Nordic Region
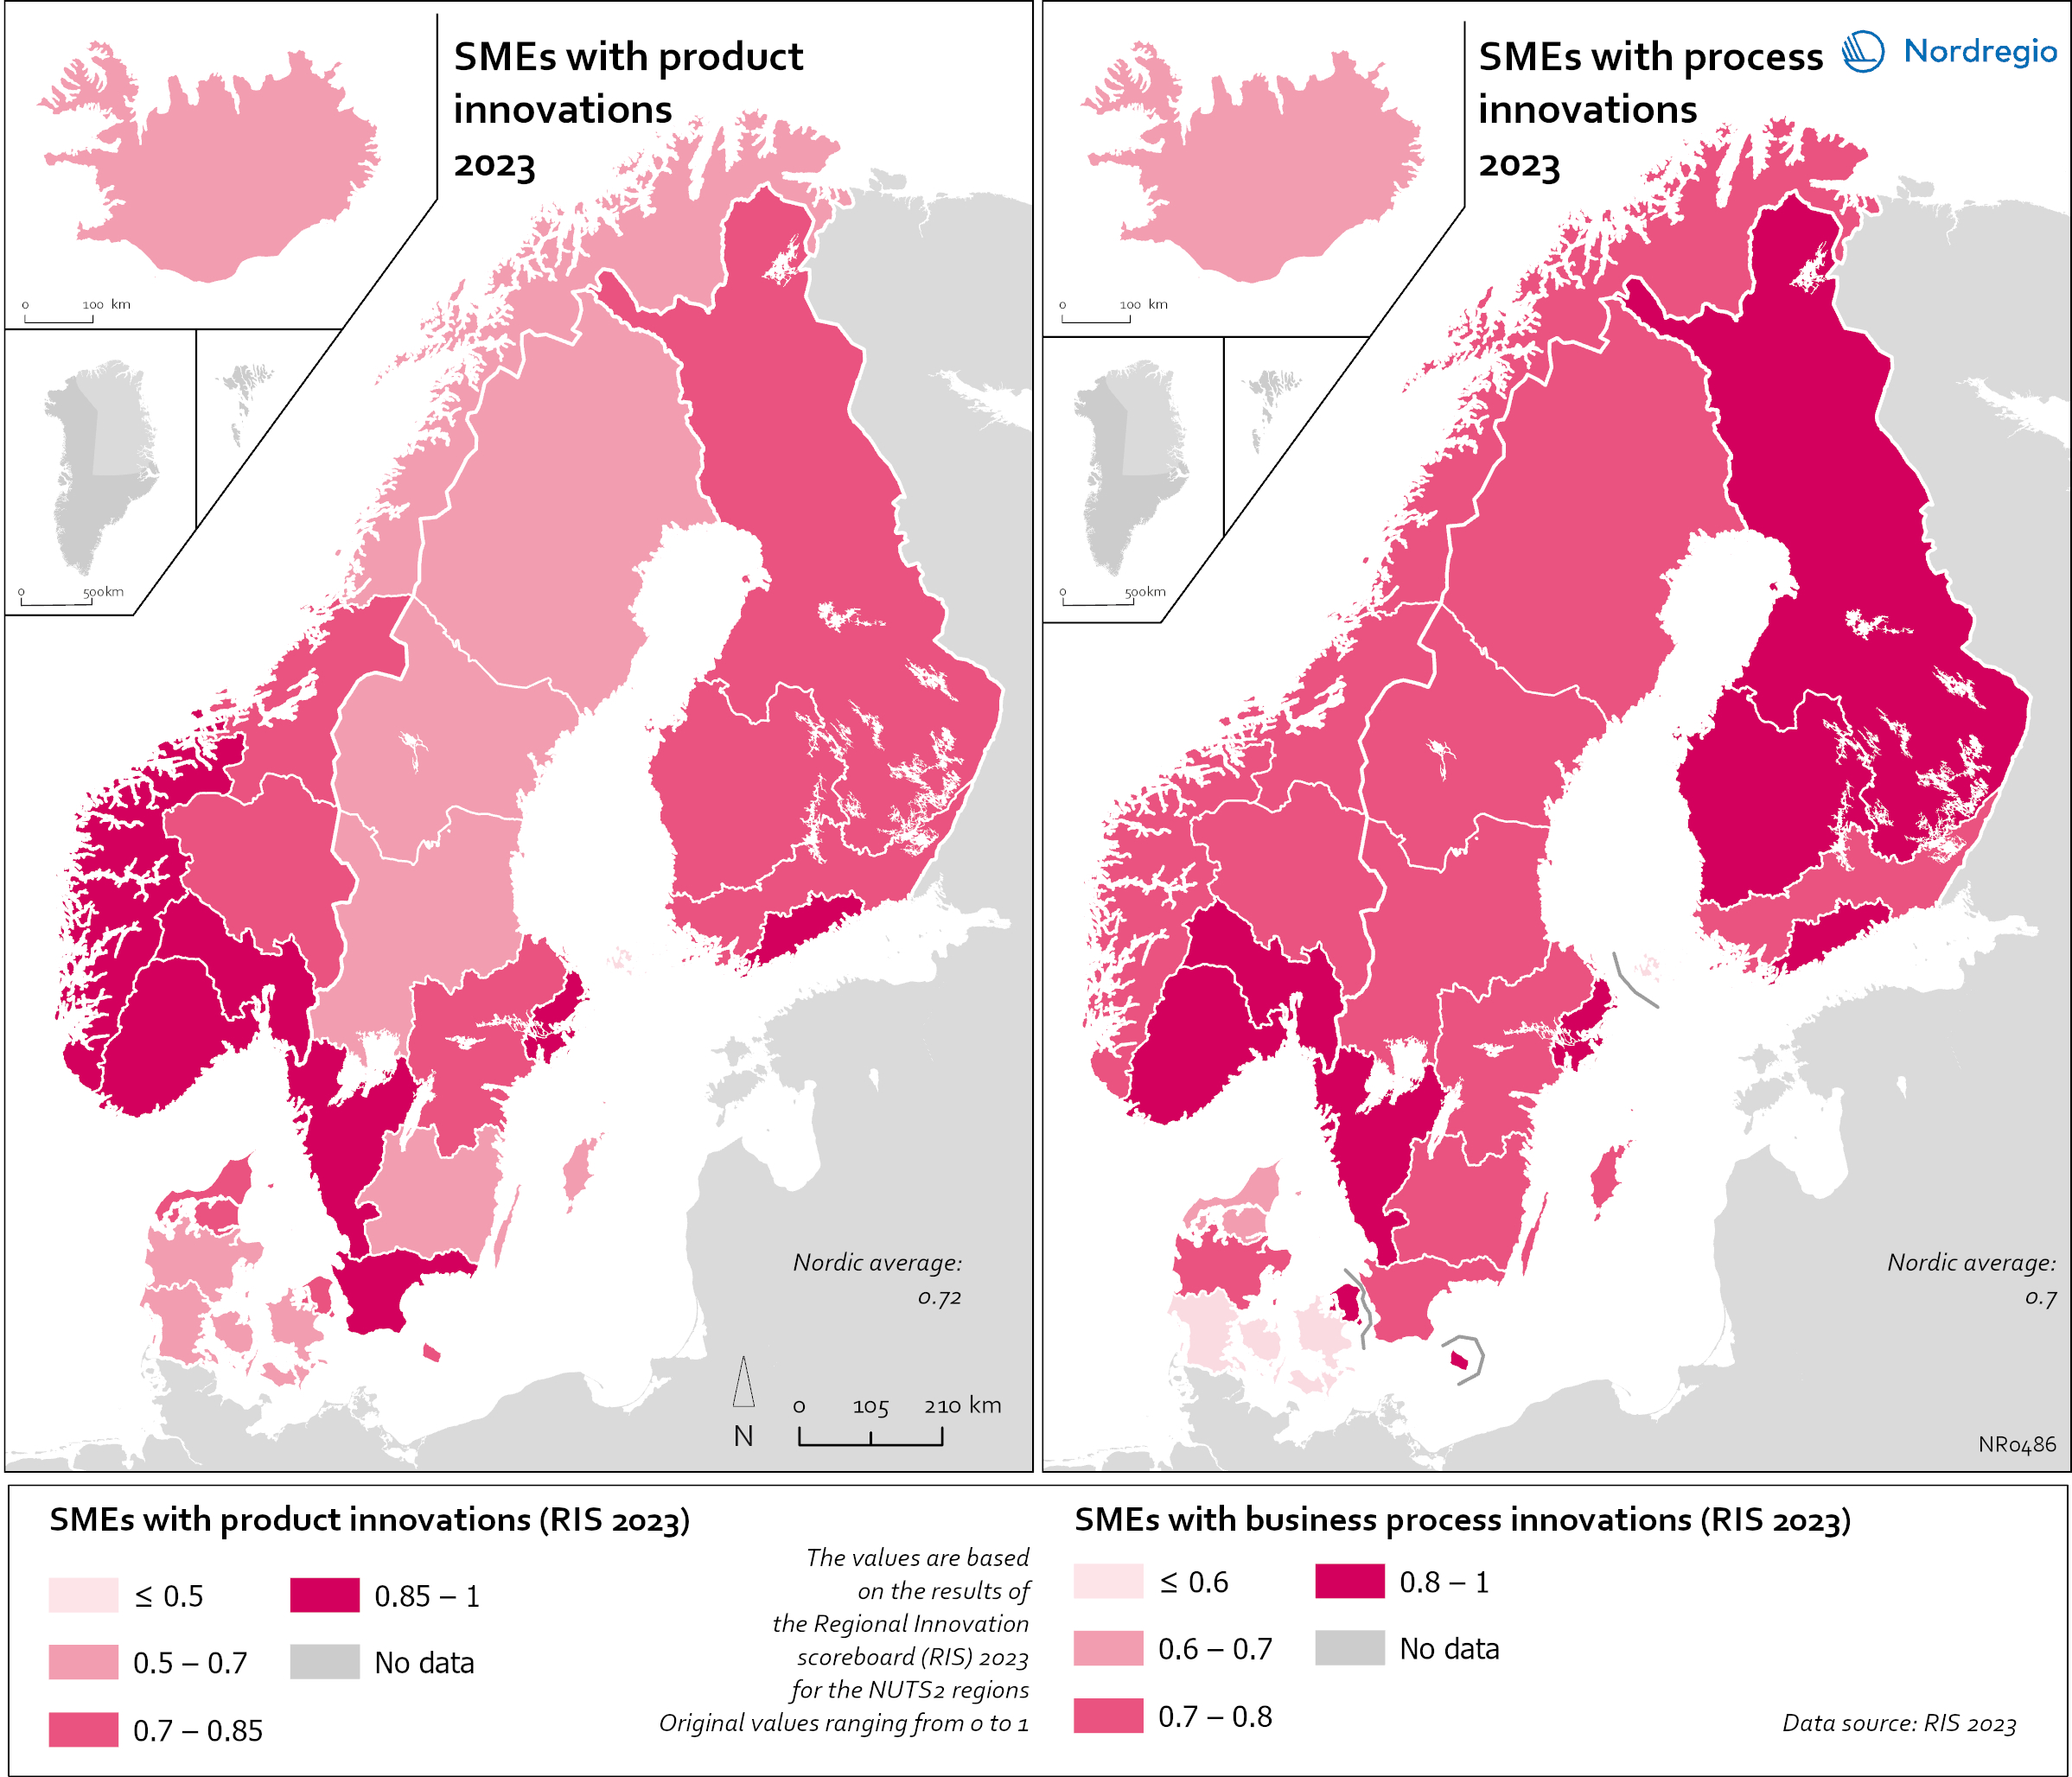
Small and Medium Sized Enterprises (SMEs) with product and business process innovation in 2023
These maps depicts Small and medium sized enterprises (SMEs) with product innovation (left map) and process innovation (right map) in 2023. The data is displayed at the NUTS2 level and the data comes from the Regional Innovation Scoreboard 2023. The left map depicts SMEs introducing product innovations as a percentage of SMEs in the Nordic regions, calculated as the share of SMEs who introduced at least one product innovation. The values for the map are normalised from 0–10. In this context, a product innovation is defined as the market introduction of a good or service that is new or significantly improved with respect to its capabilities, user-friendliness, components, or sub-systems. Rural regions tend to have lower levels of SMEs with product innovations, while urban regions have the highest levels. In 2023, Åland (0.235) had the lowest number of SMEs with product innovations in the Nordic Region, while Oslo had the highest (1.0). Etelä-Suomi and Stockholm regions were slightly behind, with 0.954 and 0.948, respectively. In Denmark, the leading regions were the Capital Region (Hovedstaden) and Northern Jutland (Nordjylland), with 0.719 and 0.715, respectively. Southern Denmark (Syddanmark) had the lowest level in Denmark, at 0.545. In Norway, the lowest value was in Northern Norway (Nord-Norge), 0.67, while in Sweden it was Middle Norrland (Mellersta Norrland), with 0.53. Taken as an average across the Nordic countries, Norway has a significantly higher number of SMEs with product innovations than the other countries. The right map shows the share of SMEs introducing at least one business-process innovation, which includes process, marketing, and organisational innovations. In general, Nordic SMEs are more likely to innovate in products rather than processes. The highest shares of process-innovating SMEs are found in most of the Finnish regions ranging from 0,79 in Länsi-Suomi to 0,91 in Etelä-Suomi, except of Åland…
- 2025 April
- Economy
- Nordic Region
- Research and innovation
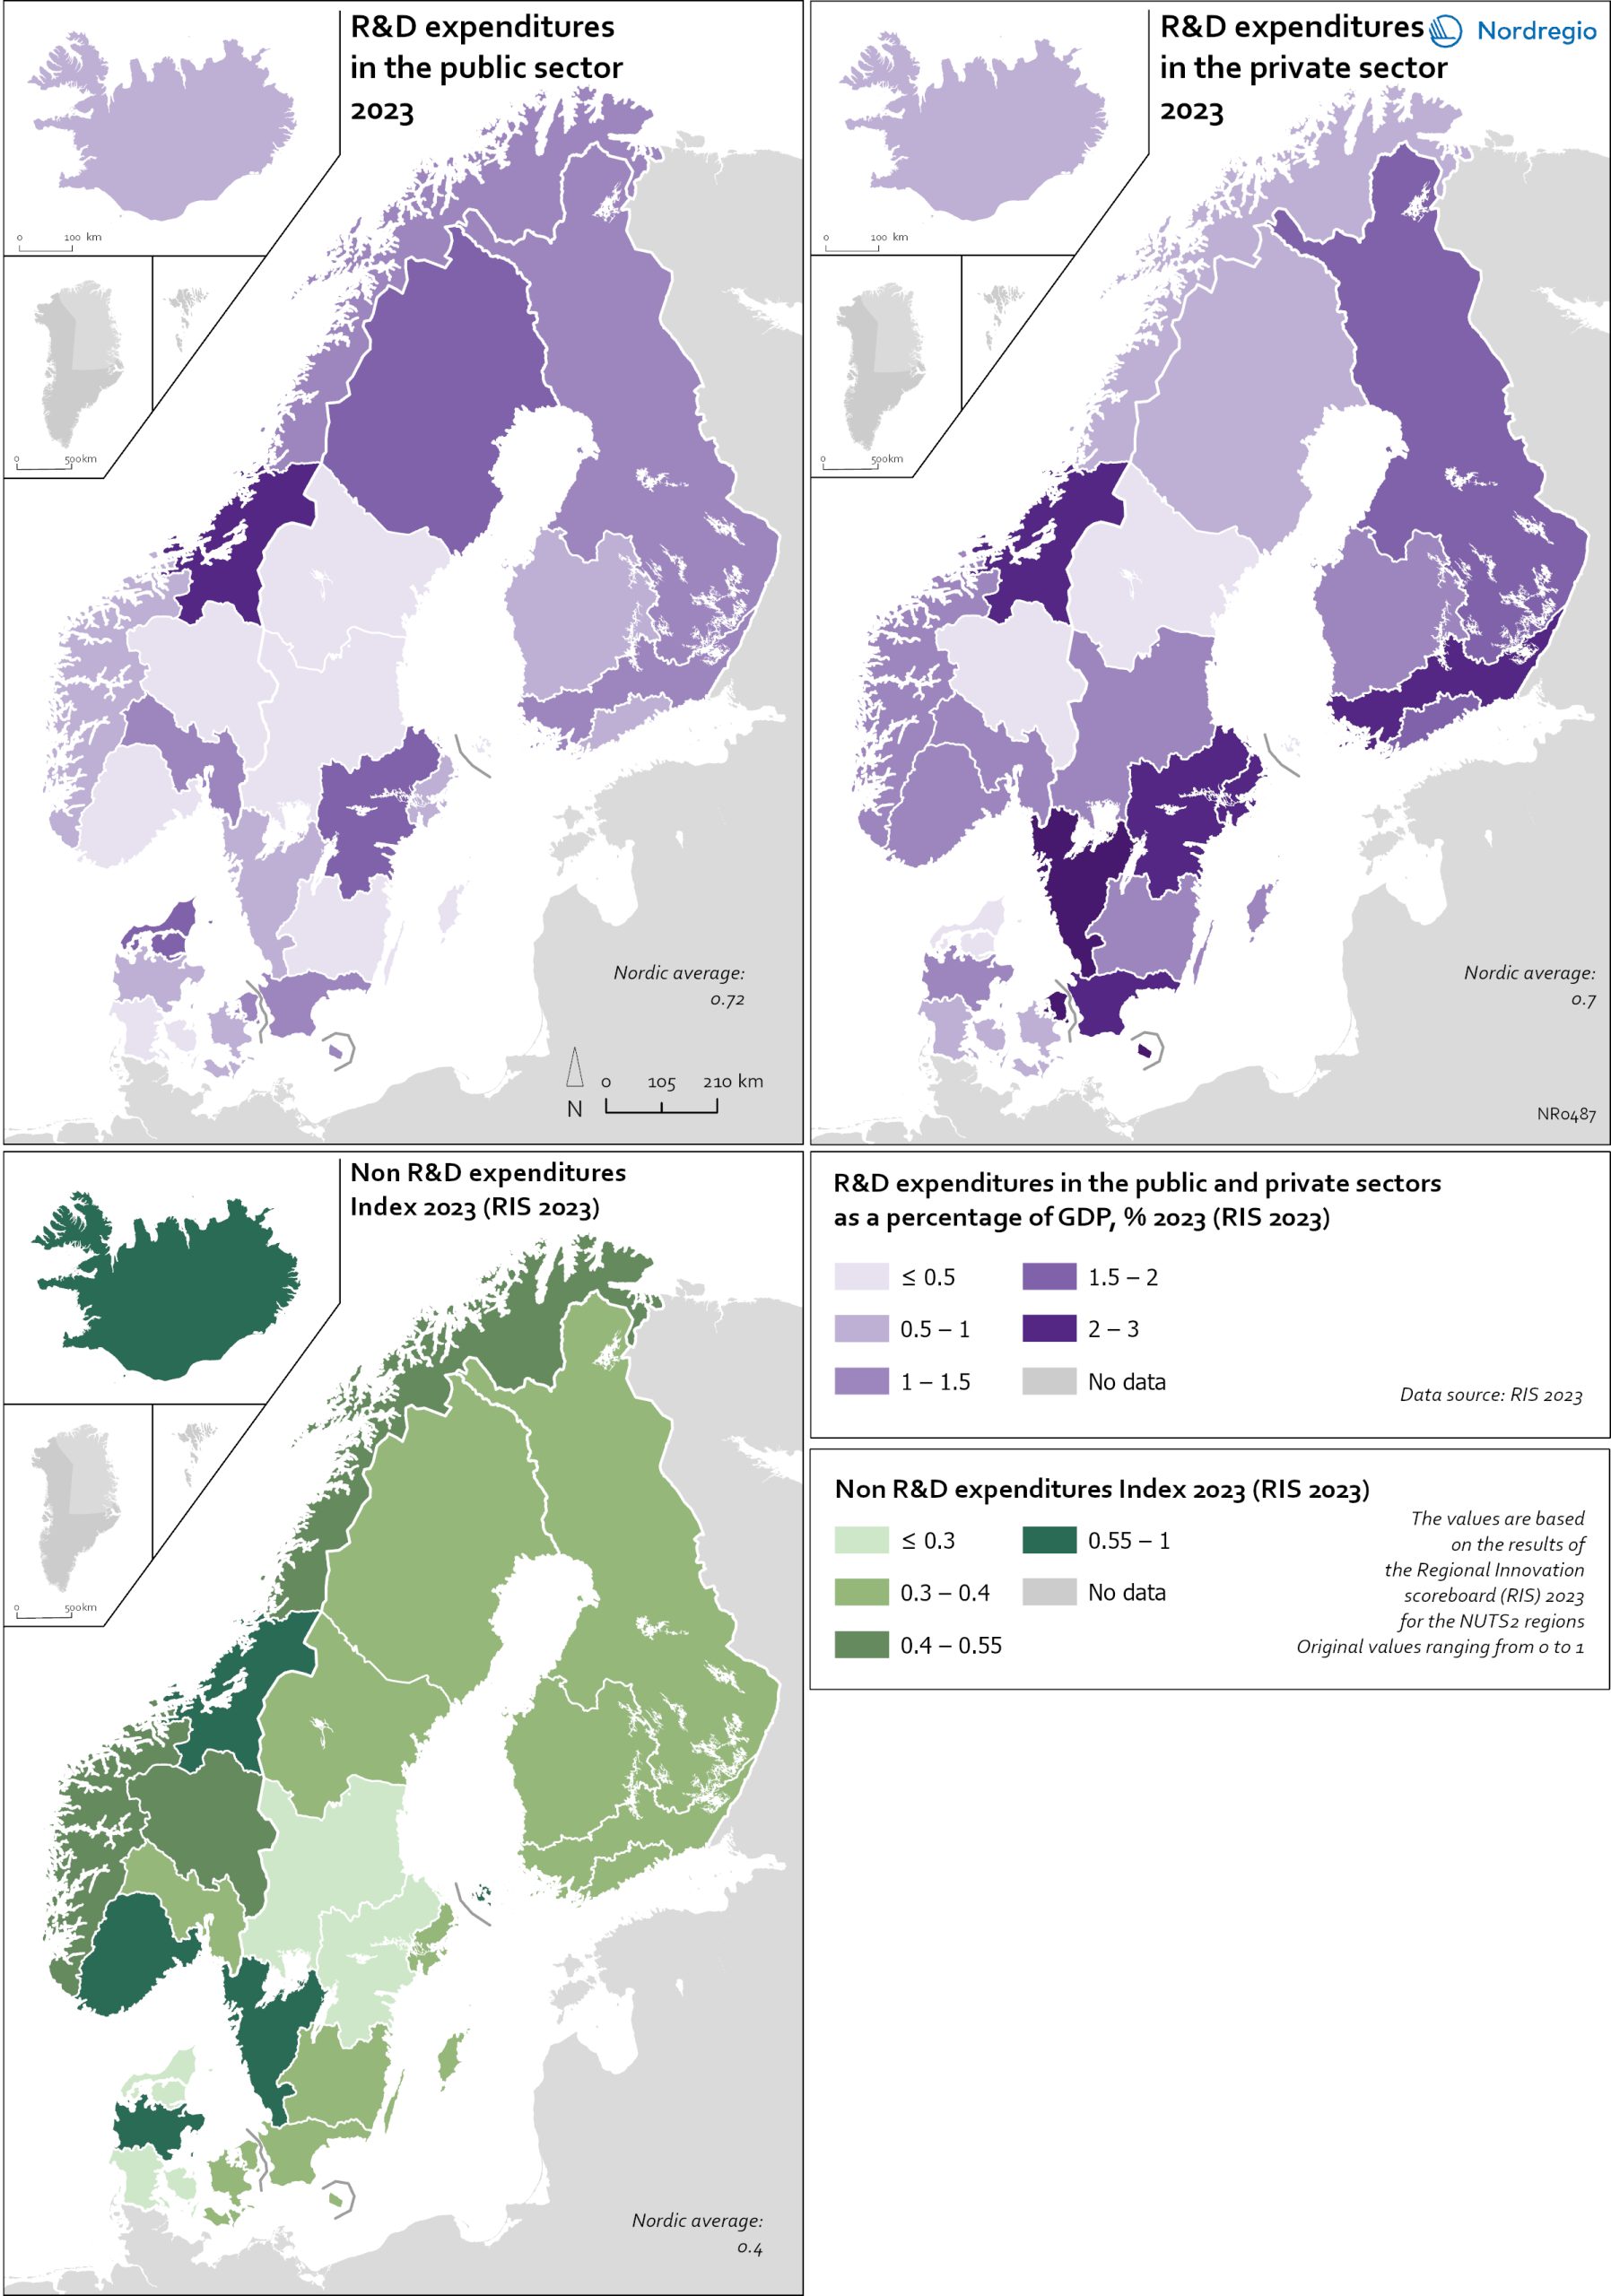
R&D and non-R&D expenditures in the public and private sector
These maps shows the expenditure on Research and Development (R&D) in the public and business sectors as a percentage of regional GDP, along with non-R&D innovation expenditure in Small and Medium Enterprises (SMEs) as a percentage of turnover. Together, these metrics offer a comprehensive understanding of the innovation landscape and provide insights into governments’ and higher education institutions’ commitment to foundational research, as well as the competitiveness and dynamism of the business environment and SMEs’ innovation capacity. By considering investment in both R&D and non-R&D activities, these indicators illustrate a broad spectrum of innovation drivers, from basic research to market-driven initiatives, and underscore the diverse pathways through which innovation fosters economic growth and social progress First, the top left map showcases R&D expenditure in the public sector as a percentage of GDP in the Nordic countries in 2023. In that year, the European level of R&D expenditure in the public sector, as a percentage of GDP, was 0.78%. By comparison, the Nordic average was 0.9%. While the more urban regions, in general, lead the Nordic regions, this is not always the case, as shown by the variation between the frontrunners. The leading region is Trøndelag (including Norway’s third-largest city, Trondheim), with 2.30% of regional GDP. It is in third place in the EU as a whole. The next regions are Övre Norrland with 1.77%, Northern Jutland with 1.54%, Östra Mellansverige with 1.52%, and Hovedstaden with 1.49%. A common feature of most of the top-ranking regions is that they host universities and other higher education institutions known for innovation practices. Most Nordic regions have not seen significant increases or decreases in public R&D spending between 2016 and 2023. The top right map focuses on the private sector’s investment in research and development activities and depicts R&D expenditure in the business sector…
- 2025 April
- Economy
- Nordic Region
- Research and innovation

Employment in high-skilled occupations 2022
This map displays the share of high-skilled workers as a share of the total number of workers in Nordic municipalities (big map) and regions (small map). “High-skilled workers” is here defined as group 1-3 (Managers, Professionals and Techinicians/associated professionals) of the International Standard Classification of Occupations (ISCO). For Iceland national data is used. The EU average of high-skilled workers is 43%, and the Nordic countries are at the top of the rankings – 49.5% in Finland, 51.1% in Denmark, 54.2% in Norway, 54.5% in Iceland and 58.9% in Sweden. On a regional level, the highest share is in the capitals and bigger cities, such as Stockholm (72%), Oslo (71%), Hovedstaden (Copenhagen) (60%), Uppsala (60%) and Uusima (Helsinki) (59%). The lowest shares are in the Finnish regions of EteläPohjanmaa, Keski-Pohjanmaa, Satakunta and Etelä-Savo (less than 40%). However, this does not necessarily mean that employers will have a greater chance of successfully recruiting high-skilled workers in the future, partly because those in this group already have jobs and partly due to generally lower investments in education.
- 2025 April
- Labour force
- Nordic Region
- Research and innovation
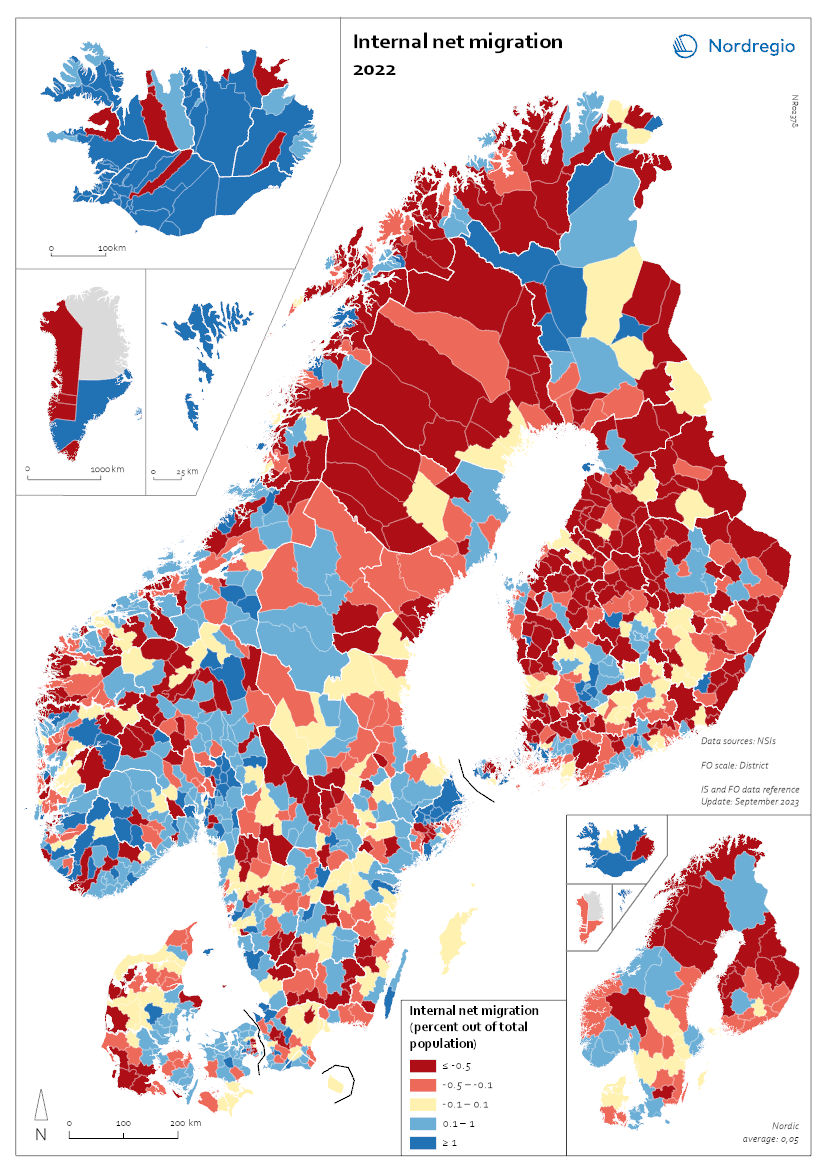
Internal Migration 2022
This map shows the internal net migration in 2022 as a percentage of the total population. This map shows the internal net migration in 2022 as a percentage of the total population. The small map shows the result on a regional level, and the big map on the municipal level. Internal (sometimes referred to as domestic) net migration refers to migration between municipalities and regions within the same country. International migration is excluded. In 2022, internal net migration was positive (indicated by shades of blue) or at least balanced (shown in yellow) in several municipalities in central and southern Sweden and Norway, as well as in central and northern Finland – areas that traditionally were more likely to lose population due to internal migration. Conversely, several municipalities in the capital regions – such as Stockholm, Oslo, and Copenhagen – exhibited negative internal net migration. Several municipalities across the Nordic Region, including in more remote and rural areas, continued to register positive internal net migration in this year. In Iceland, positive migration predominated in most of the municipalities, and the Faroe Islands also presented positive net migration. Greenland oscillated mainly between positive and negative migration flows, while Åland presented the whole spectrum of positive, balanced, and negative net migration for this year.
- 2025 April
- Demography
- Nordic Region
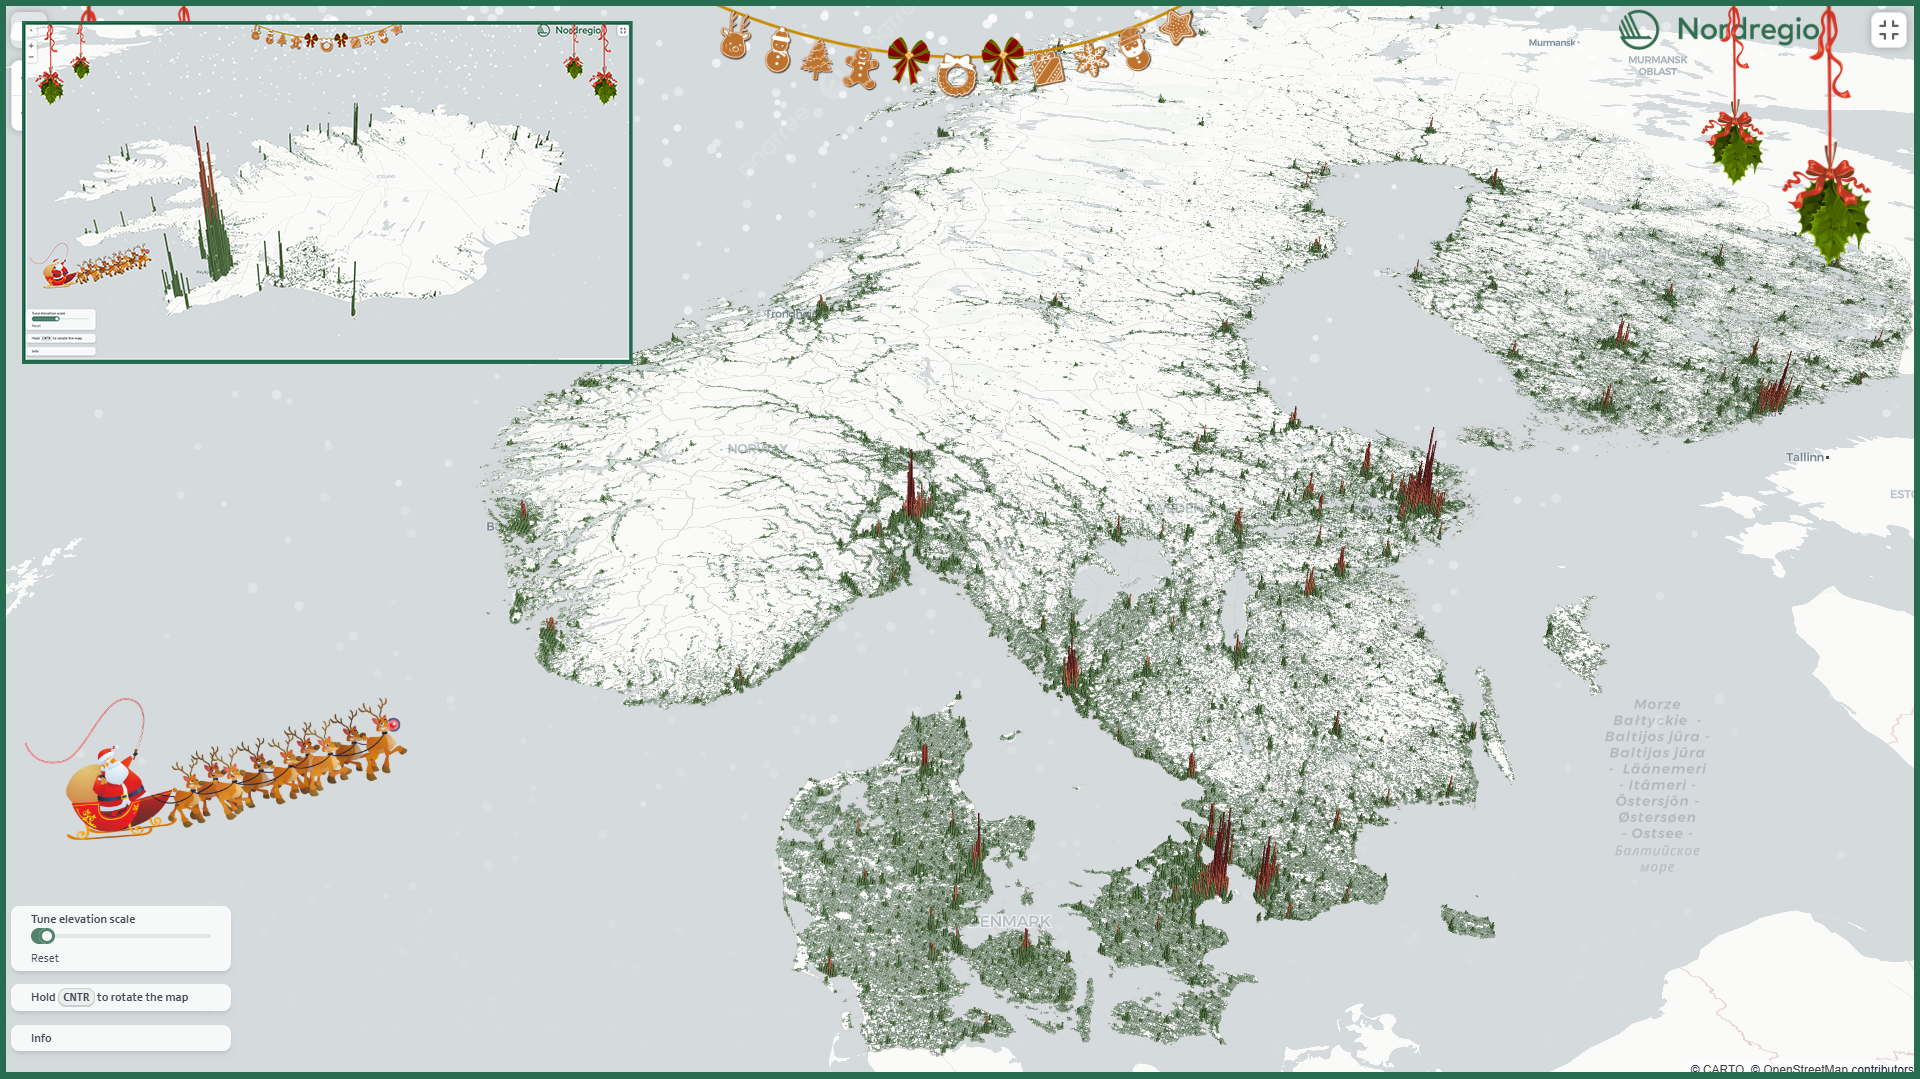
A 3D population map for the holiday season
This Christmas, we’re gifting all fellow data nerds our first-ever interactive 3D map! The map displays the number of residents in each 1km grid cell, with the height of the bars representing the number of residents in each area.
- 2024 December
- Demography
- Nordic Region
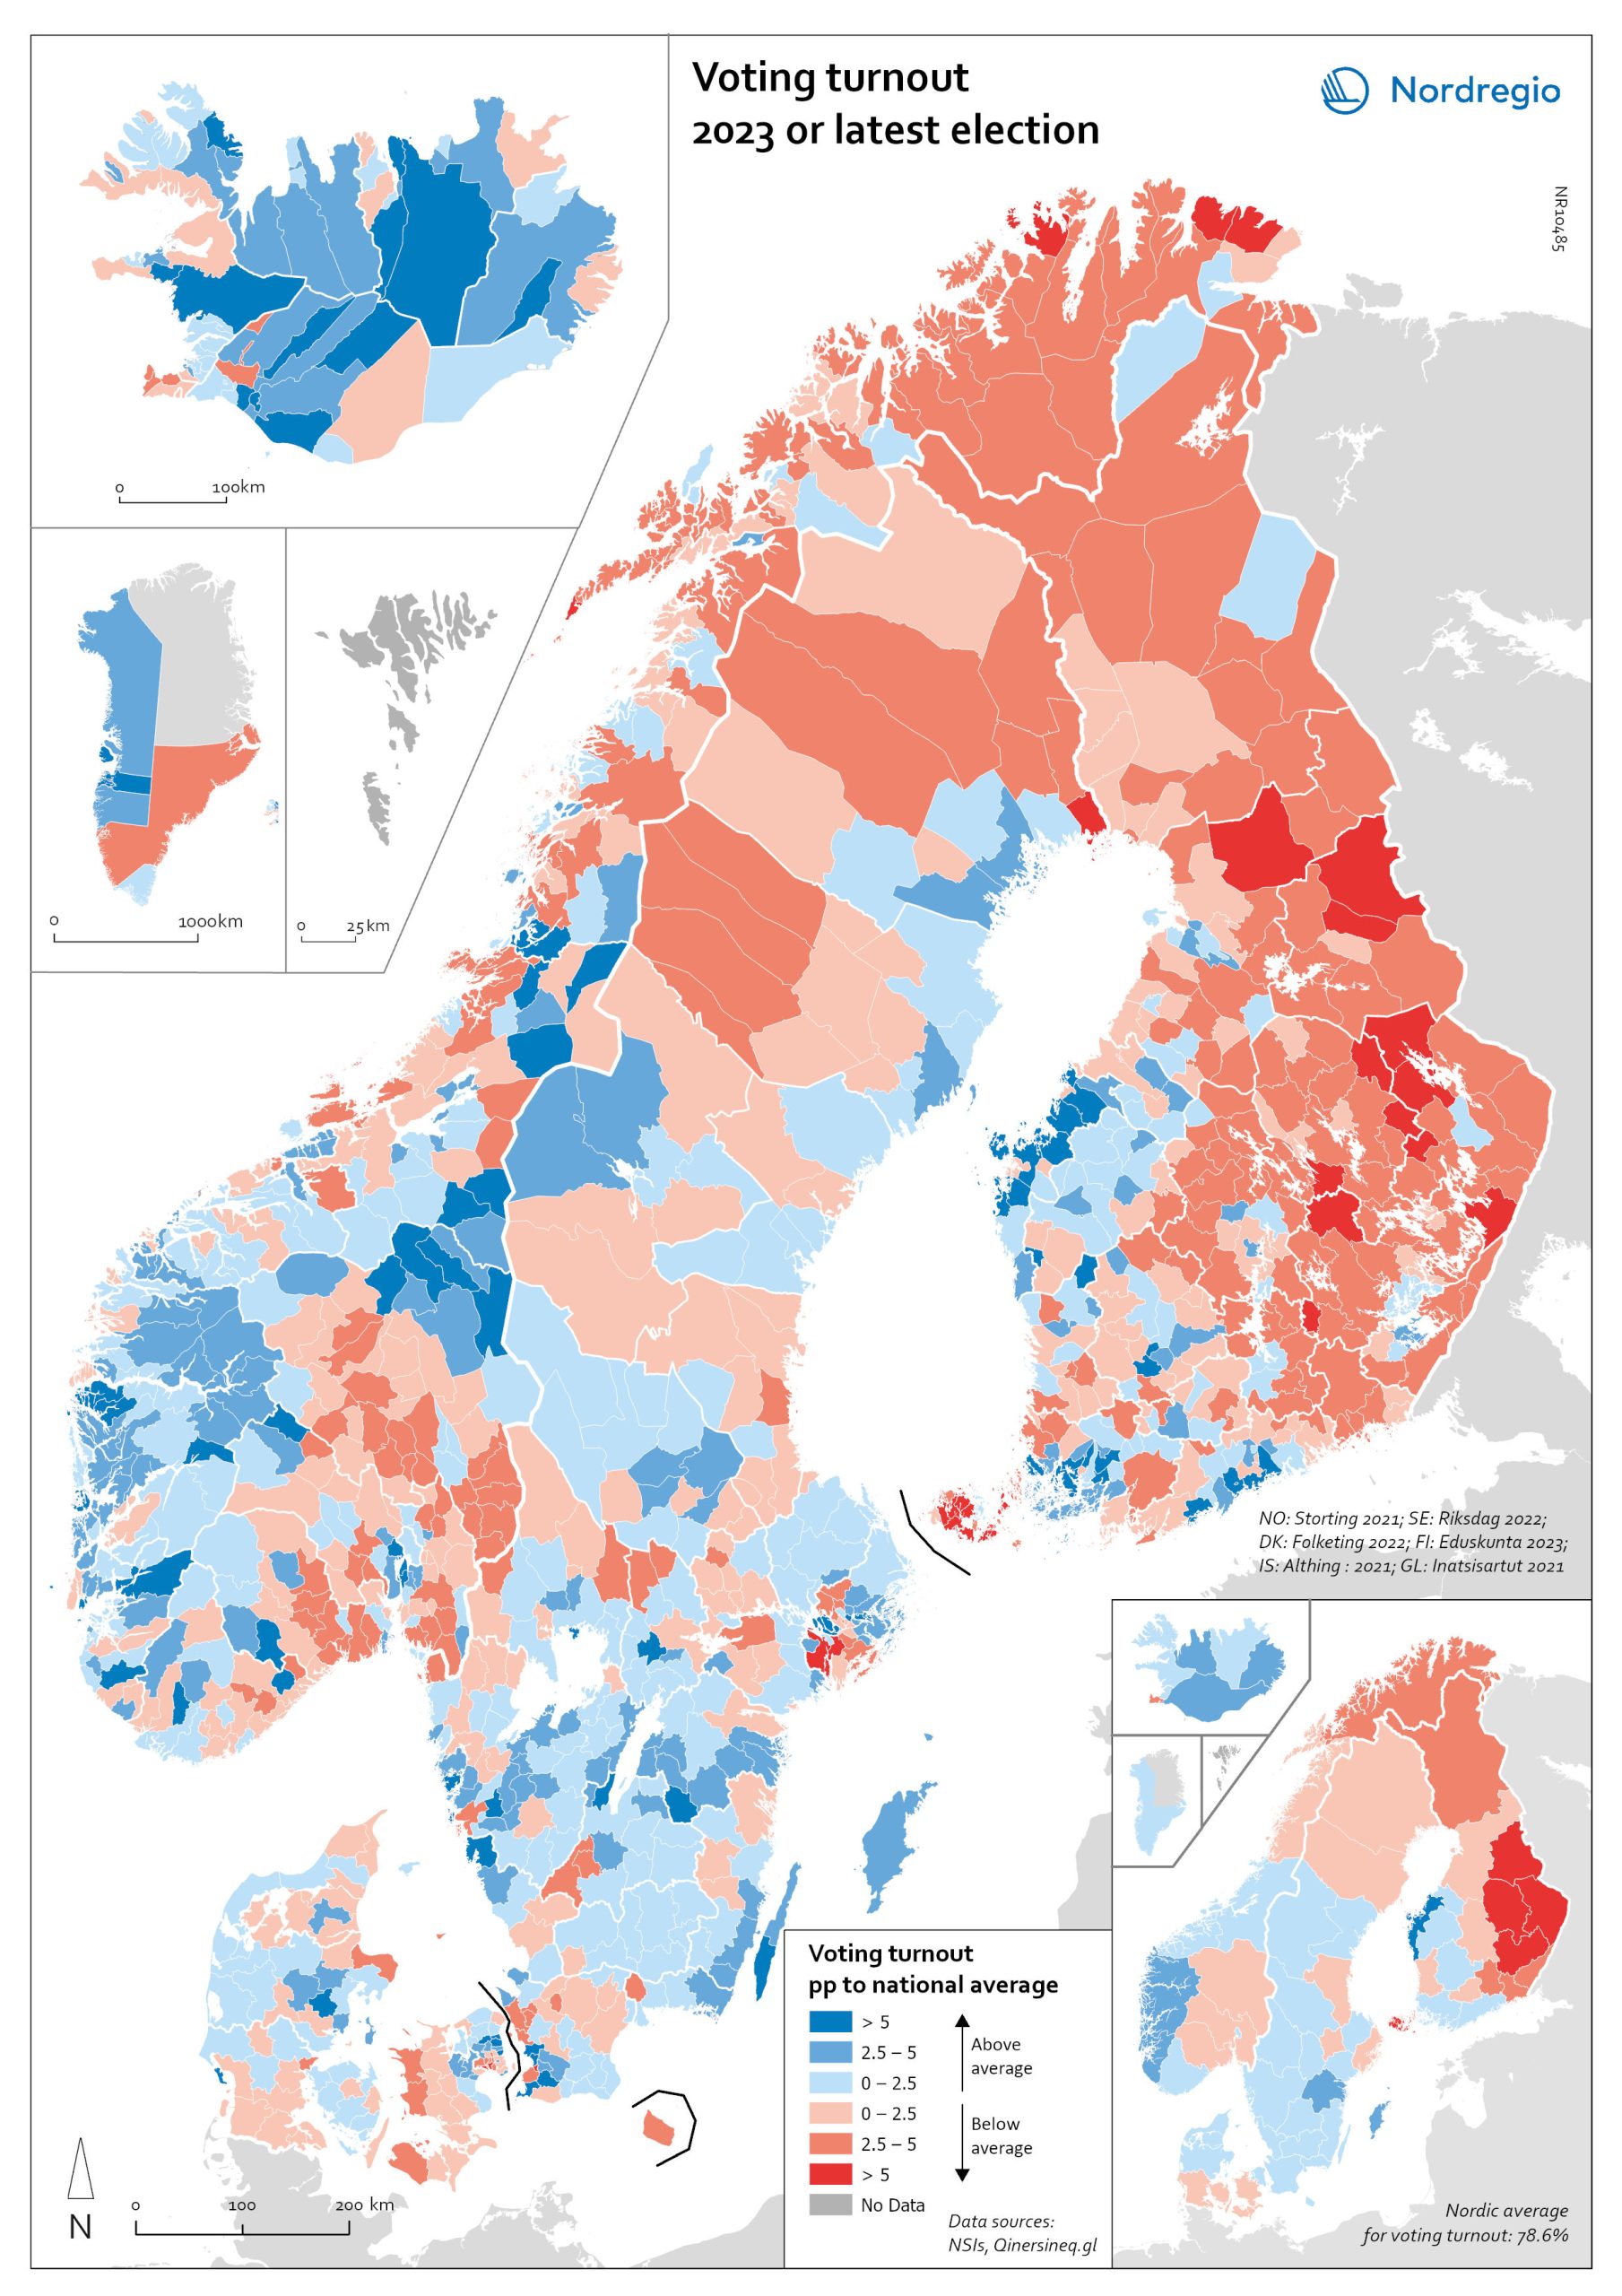
Voting turnout in national elections
Voting turnout in 2023 (or latest national election). The map illustrates voter turnout as a percentage point relative to national averages, highlighting differences in participation levels between countries. This method removes inter-country differences in participation levels, providing a clearer view of the urban-rural divide. Lower turnout is observed in eastern Finland, northern Sweden, and the more rural parts of Denmark. In Norway, the lowest turnout occurs in the north and in municipalities outside Oslo. Nationally, the highest voter turnouts are in the Faroe Islands (88%), Sweden (84.2%), and Denmark (84.16%). Lower participation rates are found in Iceland (80.1%), Norway (77.2%), Finland (68.5%), and Greenland (65.9%).
- 2024 May
- Nordic Region
- Others

Smart specialisation domains in Swedish regions
This map gives an overview of the S3 focus areas in the Swedish regions in 2019. The major S3 domains in Sweden shown in the map provide a good overview of the key specialisation areas in Sweden. It is possible, for example, to check which Swedish regions have “green”, “sustainable”, “environment” at their smart specialisation domains (marked in green in their respective infoboxes for the domains in the figure). The information illustrated in the map can assist Swedish regions when they are considering opportunities for S3 synergy and co-operation with each other. In Sweden, the Swedish Agency for Economic and Regional Growth (Tillväxtverket) is a central actor in assisting regions in their work with smart specialisation. Tillväxtverket promotes opportunities for cooperation between the Swedish regional S3 processes and provides relevant information and learning seminars related to S3. Read the digital publication here.
- 2020 February
- Economy
- Research and innovation
- Sweden
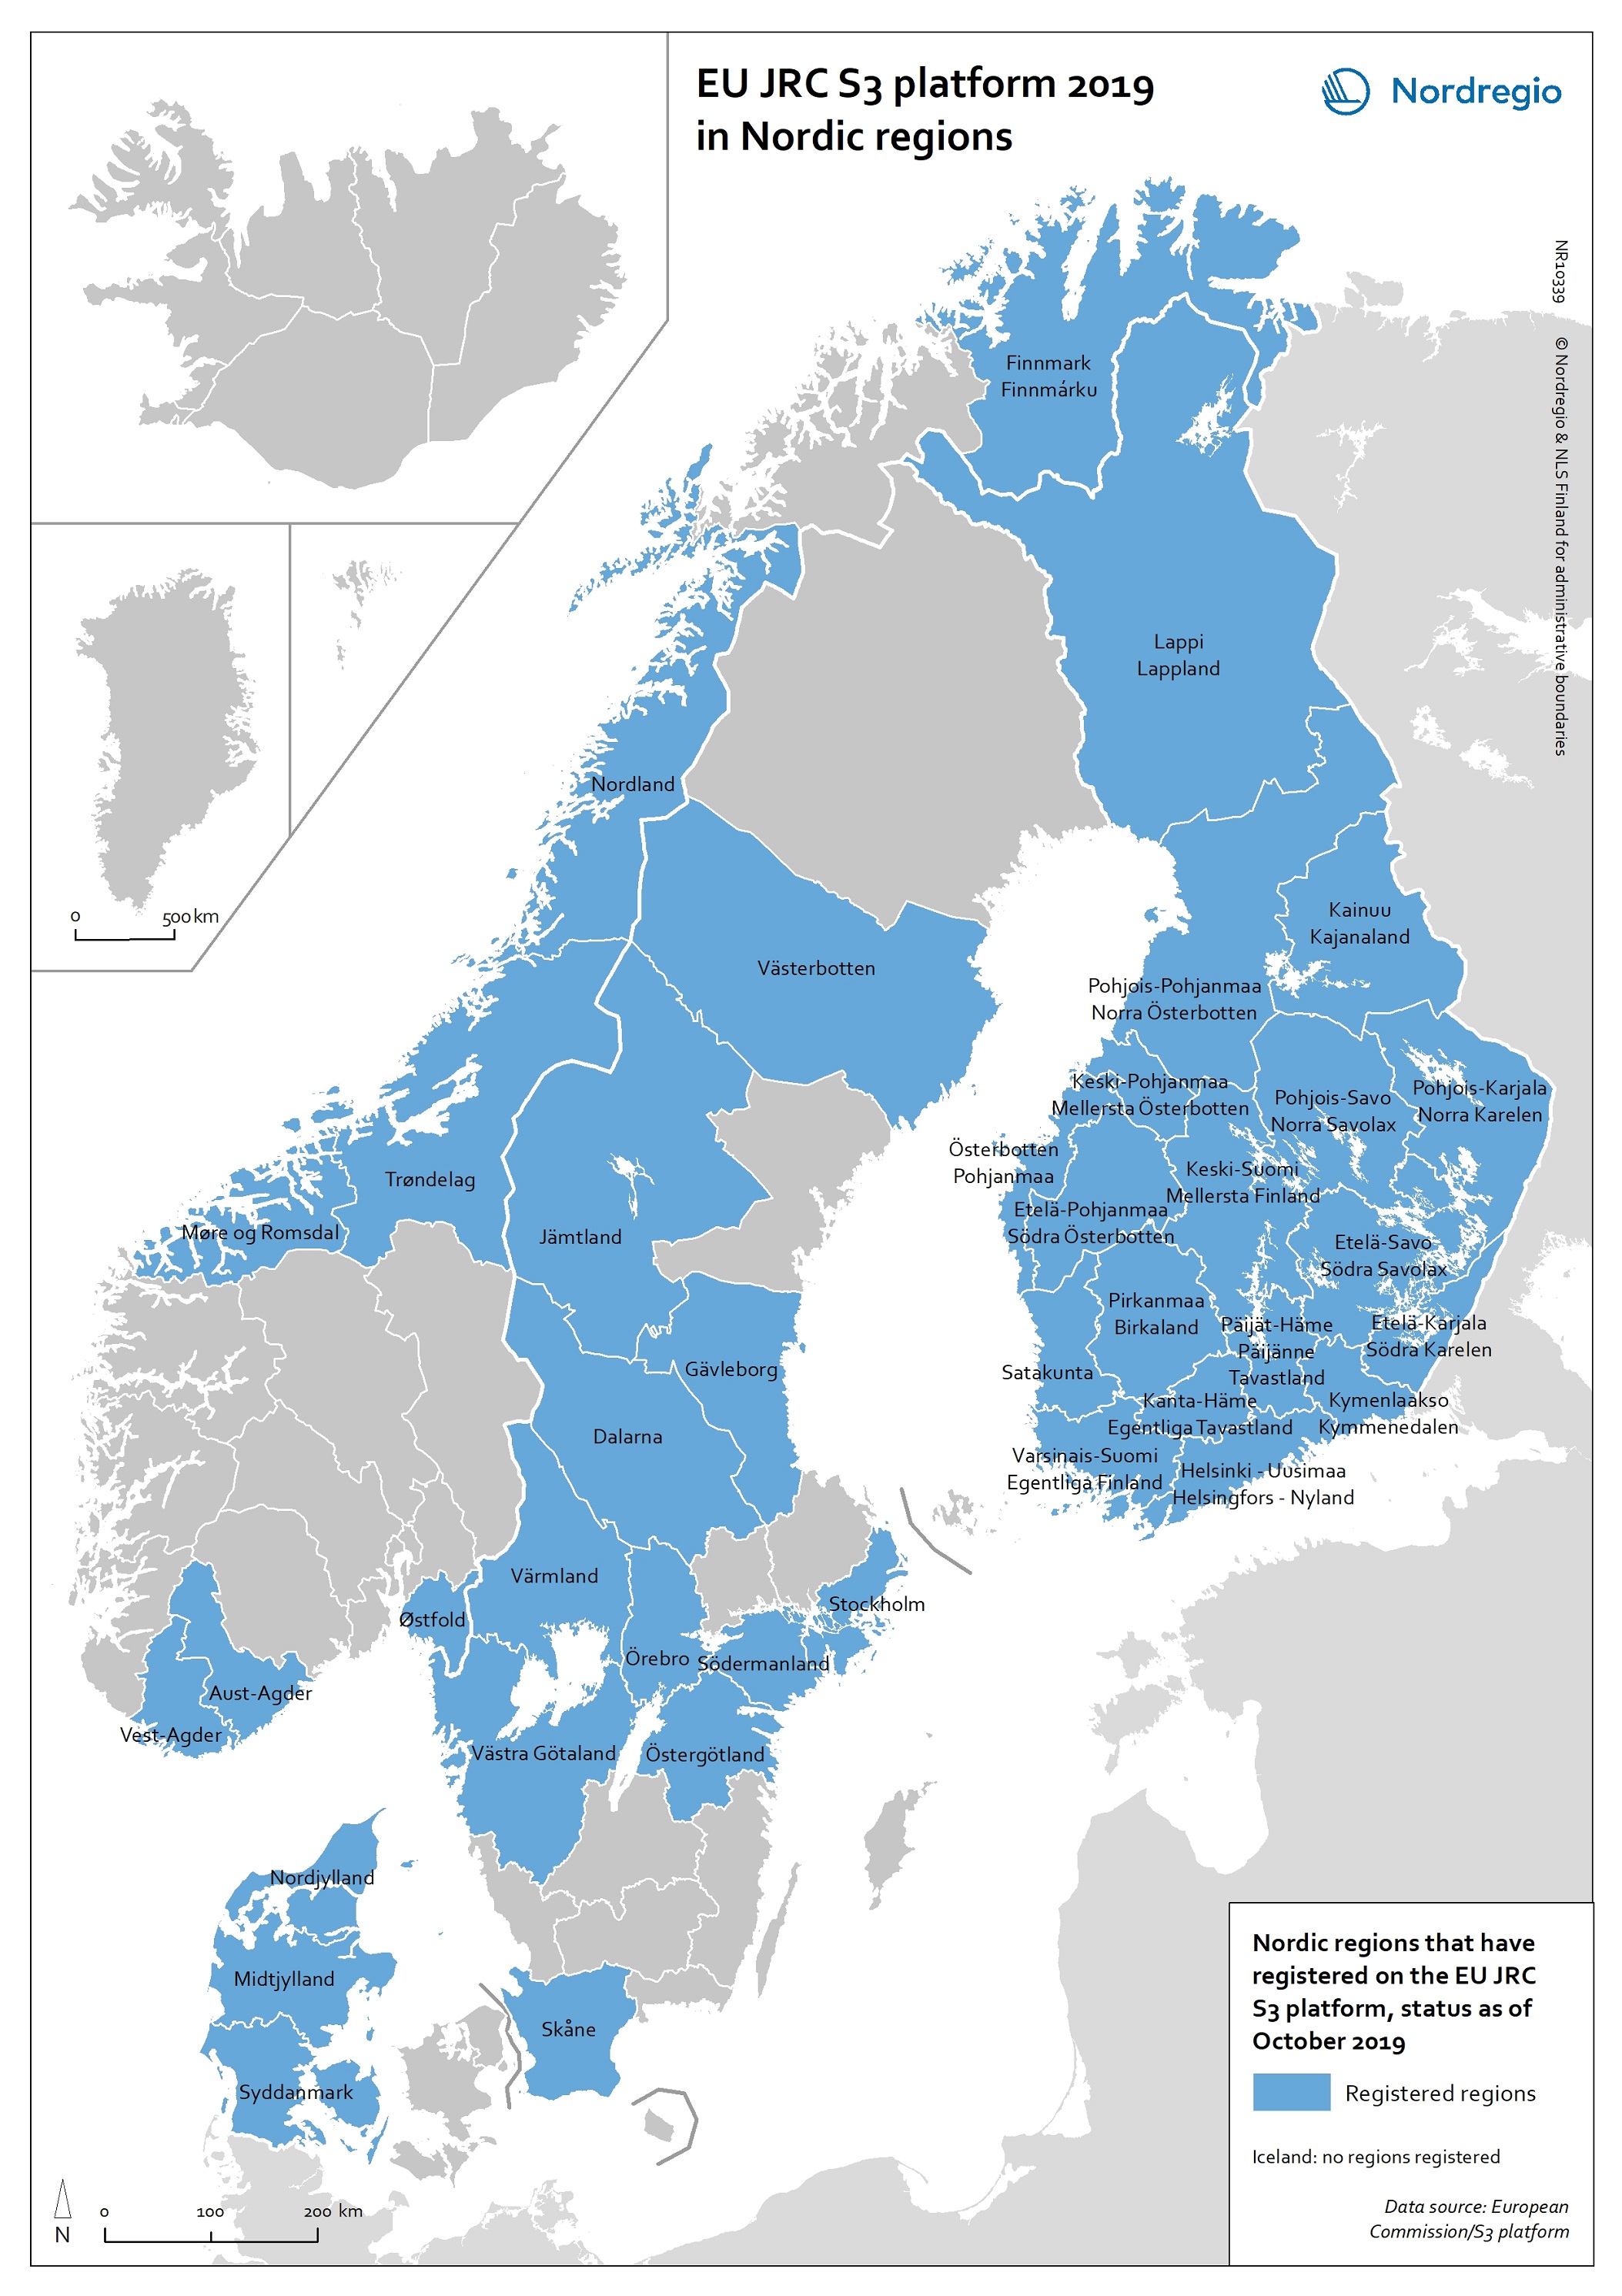
EU JRC S3 Platform 2019 in Nordic regions
This map shows the Nordic Regions that have registered on the EU JRC S3 platform, status as of October 2019. The regions that have registered on the S3 platform receive practical advice and broadened opportunities for international networking. In October 2019, there were 182 EU regions registered on the S3 platform, as well as 18 non-EU Member State regions. Of these regions, 38 are Nordic. It is worth noting that, as a non-EU member state, Norway has seven registered regions on the platform. Registration on the S3 platform is by no means a guarantee of success of a regional smart specialisation process, but it indicates the willingness of the region to learn more about S3 and to participate in international and interregional S3 cooperation through the possibilities provided by the S3 platform. The smart specialisation concept has been diffusing rapidly across Europe in the 2010s, as an increasing number of regions adopt it and design strategies departing from their own preconditions. The S3 platform in Seville, Spain, hosted by the Institute for Prospective Technological Studies (IPTS), was established in 2011 to assist EU countries and regions to develop, implement and review their smart specialisation strategies. The S3 platform provides information, methodologies, expertise and advice to national and regional policymakers, promotes mutual learning and transnational co-operation, and contributes to academic debates around the concept of smart specialisation. Read the digital publication here.
- 2020 February
- Economy
- Nordic Region
- Research and innovation
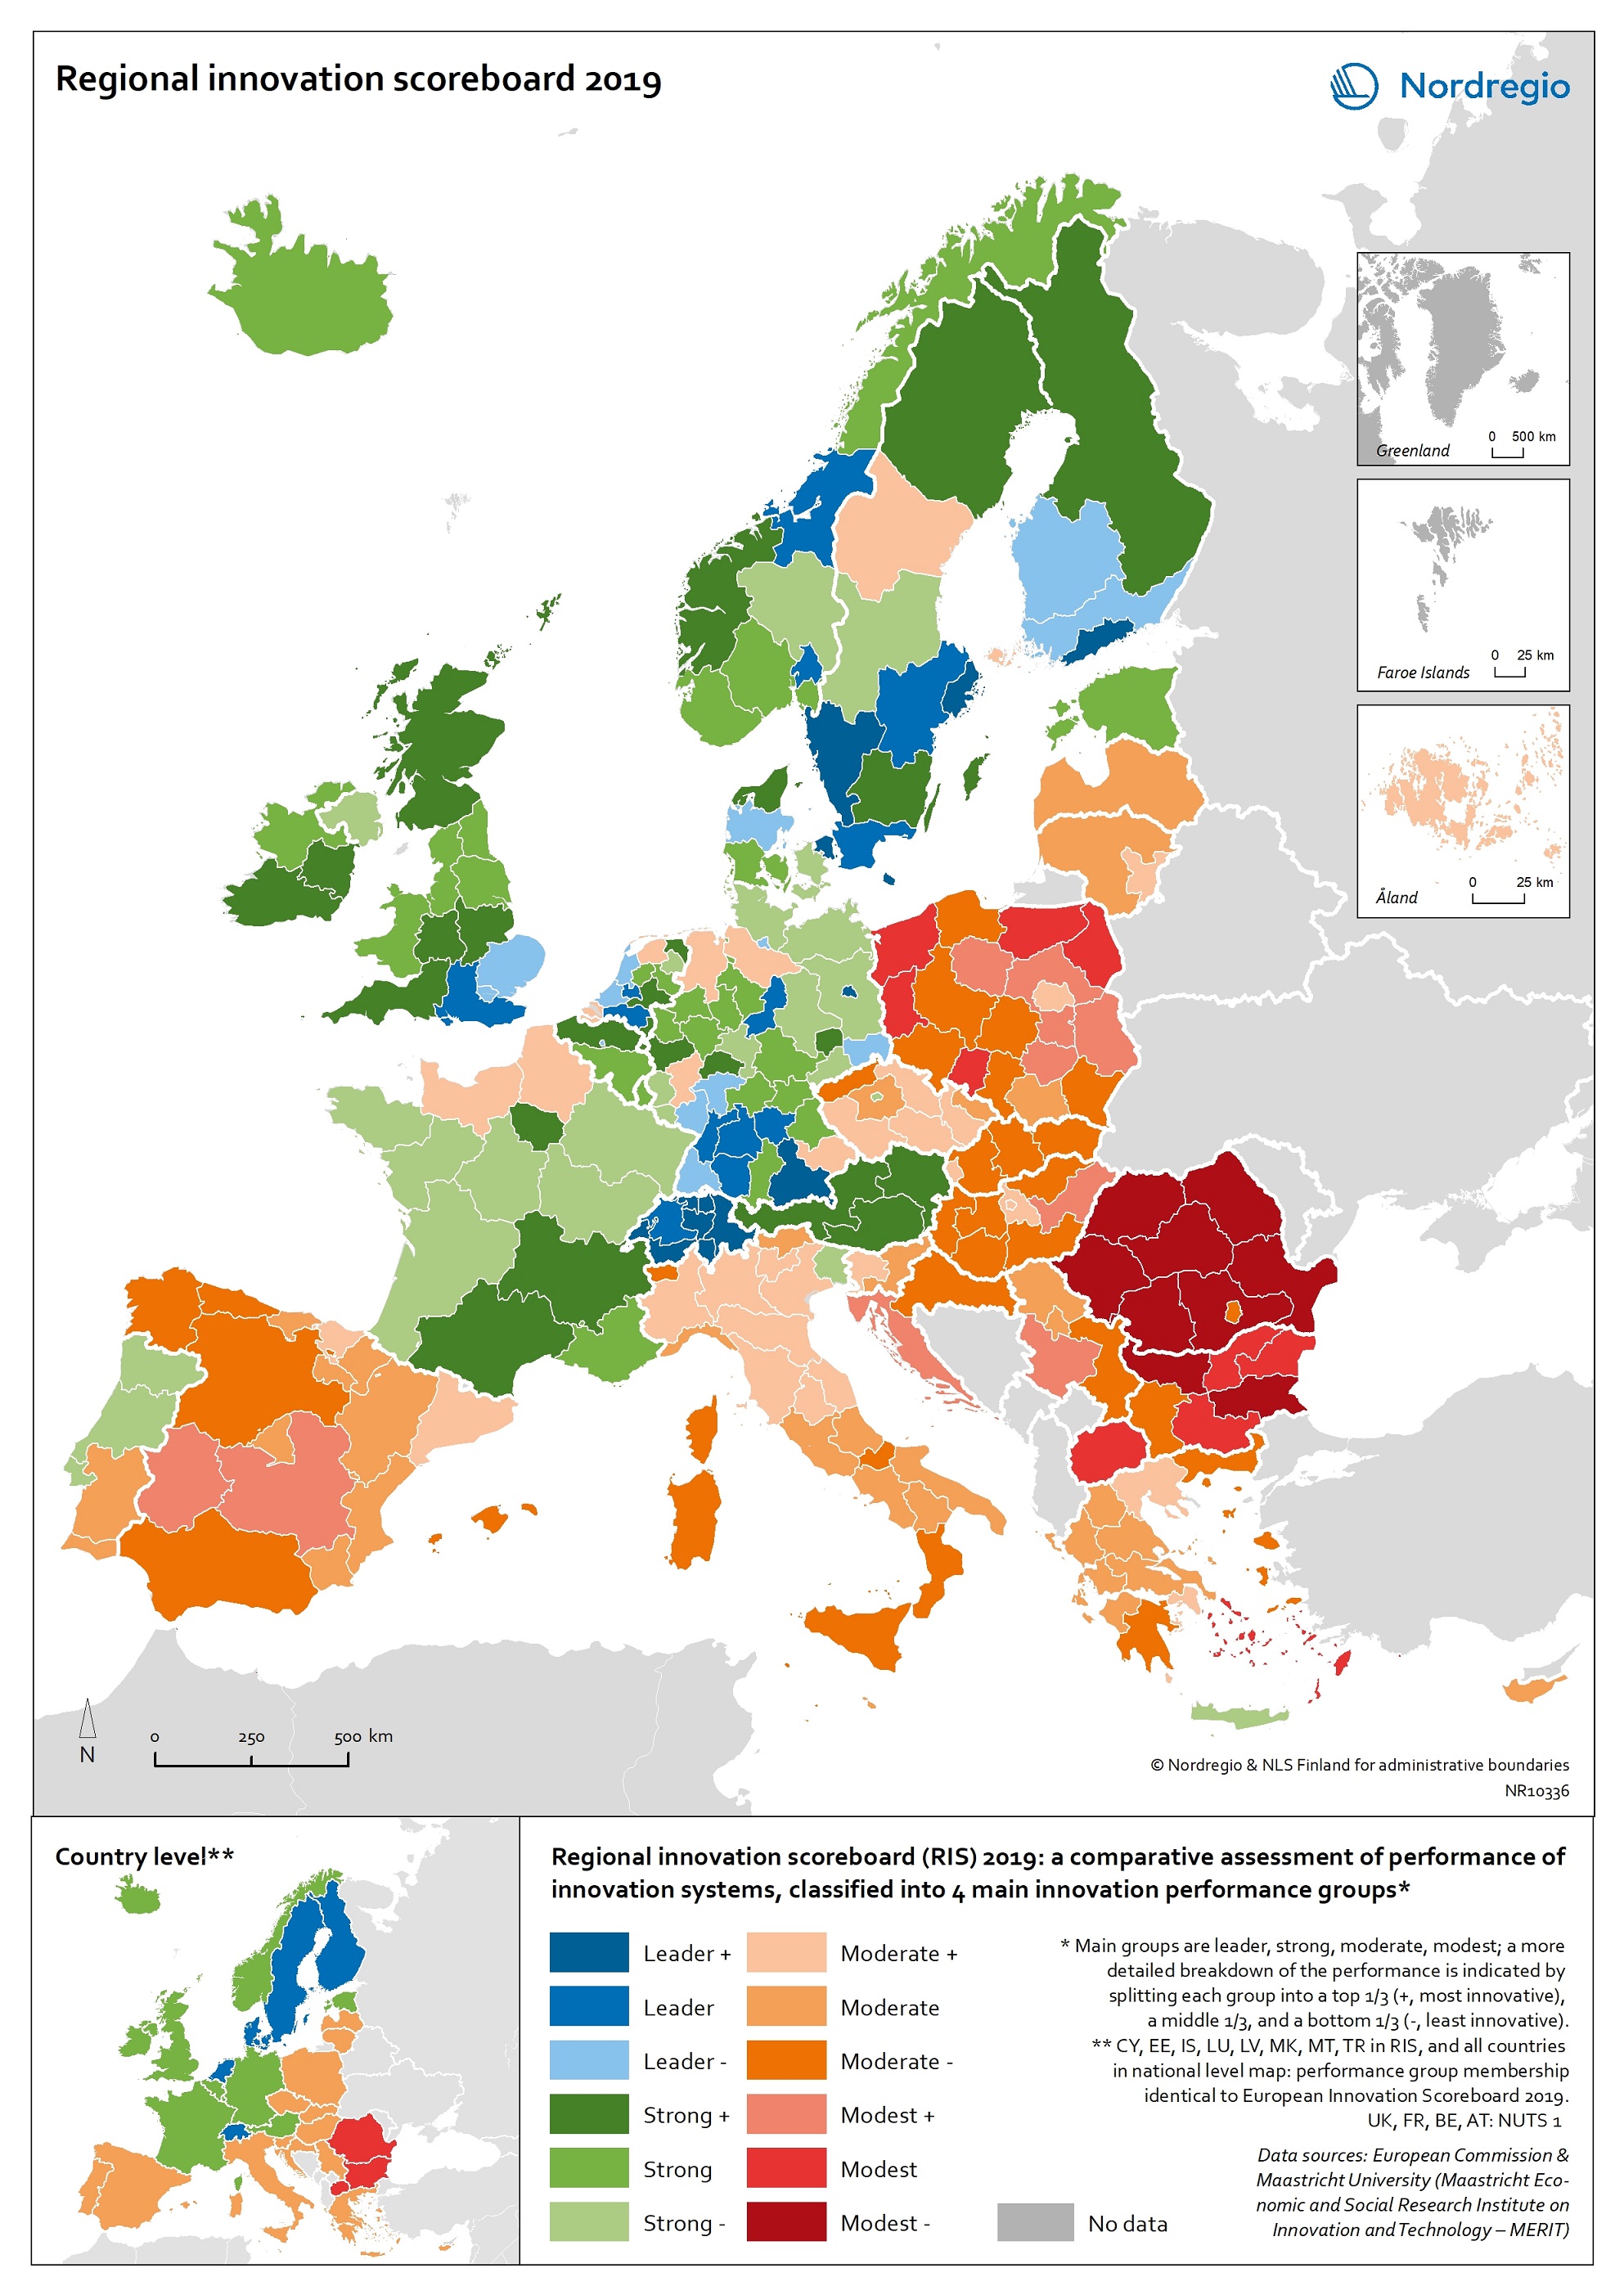
Regional innovation scoreboard 2019
This map shows the regional innovation scoreboard (RIS) in the European regions in 2019. The small map shows the innovation scoreboard at national level. The index shows the performance of innovation systems, classified into four main performance groups (leader, strong, moderate and modest). The European innovation scoreboard provides a comparative assessment of the research and innovation performance in European countries. It assesses the relative strengths and weaknesses of national innovation systems and helps countries identify areas they need to address. The Regional innovation scoreboard (RIS), a regional extension of the European innovation scoreboard, assesses the innovation performance of European regions on a limited number of indicators. The RIS 2019 covers 238 regions across 23 EU countries, as well as Norway, Serbia and Switzerland. Cyprus, Estonia, Latvia, Luxembourg and Malta are also included at country level. The RIS 2019 is a comparative assessment of regional innovation based on the European innovation scoreboard methodology, using 18 of the latter’s 27 indicators. It provides a more detailed breakdown of the performance groups with contextual data that can be used to analyse and compare structural economic, business and socio-demographic differences between regions. The Nordic regions are doing well in an overall RIS comparison regarding innovation performance. There are, however, considerable differences in innovation performance between the Nordic regions. For example, the capital regions have higher levels of innovation performance than more rural and peripheral regions, according to RIS 2019. This is often due to the critical mass of companies and the spatial significance of the proximity of firms and entrepreneurs, enabling knowledge-sharing and spill-over effects. Read the digital publication here.
- 2020 February
- Economy
- Europe
- Research and innovation
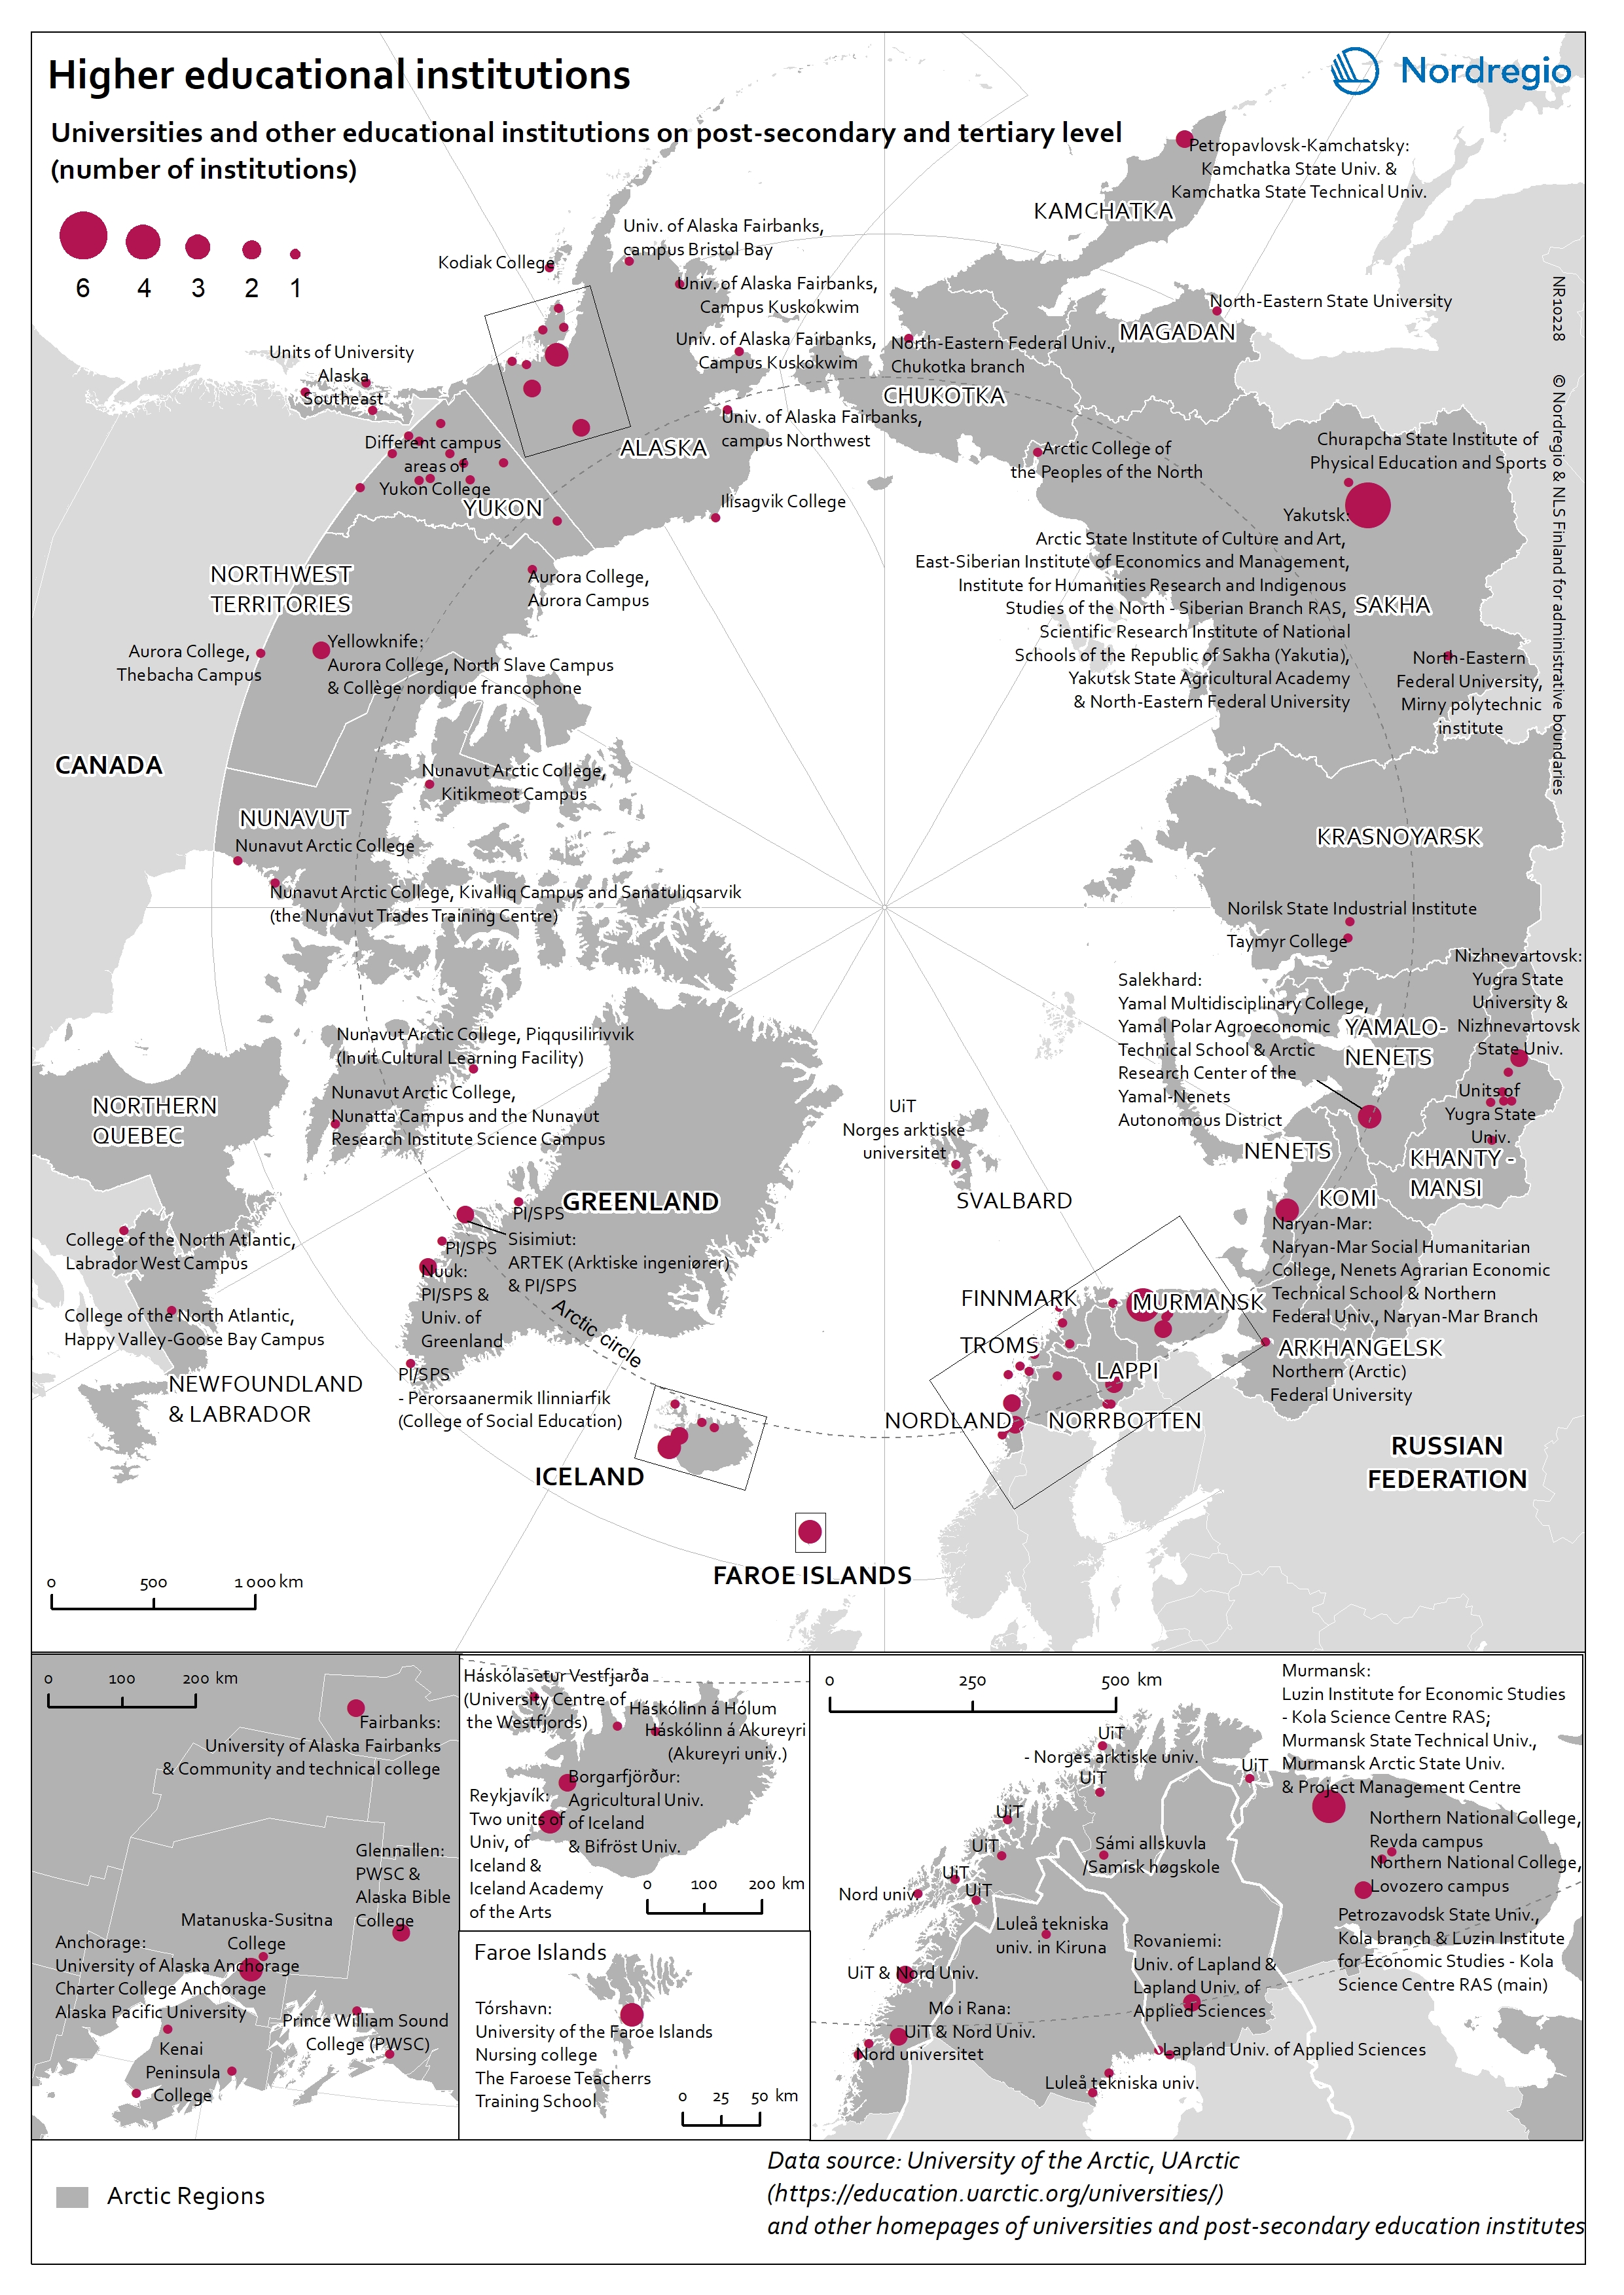
Higher educational institutions in the Arctic
The map shows universities and other educational institutions on post-secondary and tertiary level located in the Arctic. The red circles indicate a location of a university, college, or campus areas within the Arctic. The size of the circle corresponds to the number of educational institutions in a specific location. There is a high density of educational education institutions around Anchorage (Alaska), in Iceland, the Faroe Islands and the Arctic Fennoscandia (see zoom-in maps). In the Yukon (Canada), the Yukon College is the main educational institution, which has several campus areas across the region. In the Russian Arctic the largest centres with higher educational institutions are in Murmansk, Naryan-Mar (Nenets), Nizhnevartovsk (Khanty-Mansi), Salekhard (Yamalo-Nenets), and Yakutsk (Sakha).
- 2019 March
- Arctic
- Others
- Research and innovation
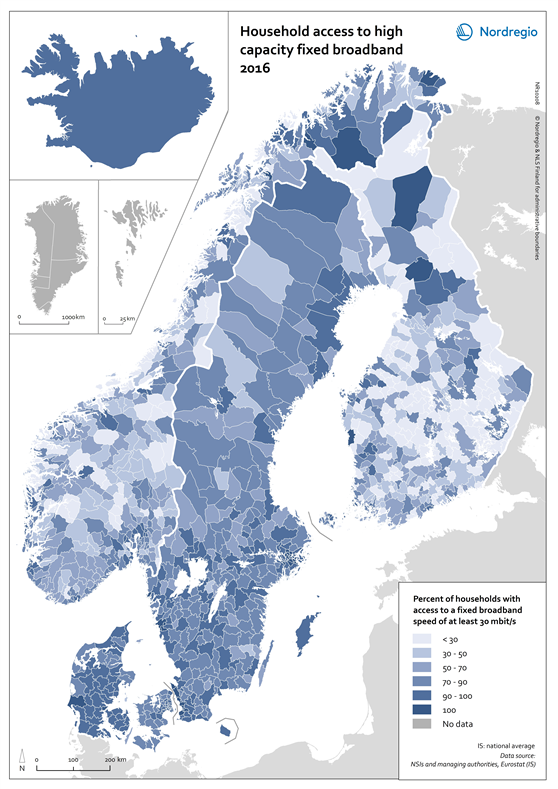
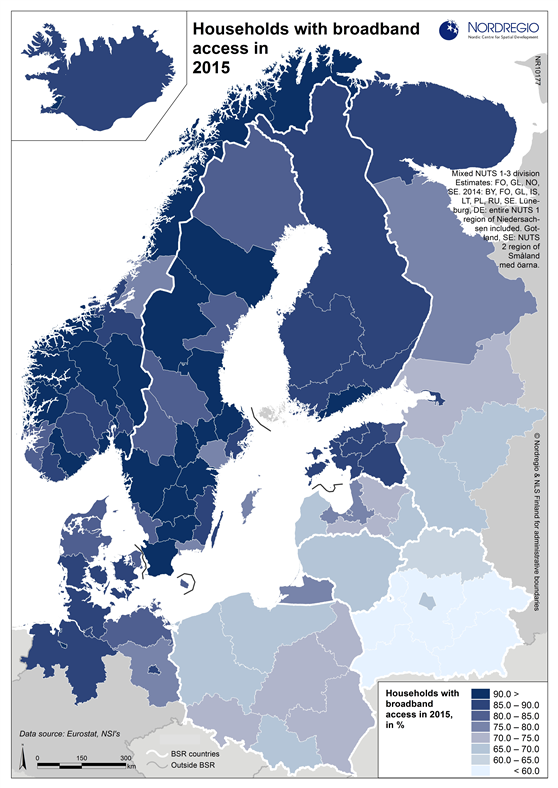
Household access to high capacity fixed broadband 2016
This map shows the household access to high capacity fixed broadband for all Nordic municipalities in 2016. The blue shading indicates the percentage of household with access to high capacity fixed broadband speed of at least 30 mbit/s in 2016. The darker the blue the larger the percentage of household with access to high capacity fixed broadband speed in the municipality, while the brightest colours represent municipalities with a low share. The grey colour indicate municipality with no data. High capacity fixed broadband coverage enhances access to digital solutions in both rural and urban contexts across the Nordic Region, thus making these areas good places to live, work and run a business domestically and across national borders. At a municipal level the household coverage by high capacity fixed broadband shows a more varied picture than that at the regional level. The average figure for Nordic municipalities was 63% in 2016, with more homogeneous figures in Denmark and Sweden than in Norway and Finland. The variation between neighbouring municipalities reflects the decision at the municipal level to prioritise investments in broadband infrastructure development as well as the nurturing of a favourable climate for the establishment of data centres requiring fast broadband networks, among other things. Fifteen Nordic municipalities, located in Sweden and Norway, had already reached the 100% mark for household coverage by high capacity fixed broadband in 2016. In Sweden, these municipalities are located in both the capital city region and in Skåne. In Norway, they are found in the more remote and rural parts of Møre og Romsdal (e.g. Giske), Troms (i.e. Lavangen) and Finnmark regions (Båtsfjord). Municipalities having values above 90% are mostly located in capital city regions as well as in more rural contexts in Jylland (Denmark), southern Sweden and northern Finland and Norway. One explanation for…
- 2018 February
- Nordic Region
- Others
- Research and innovation
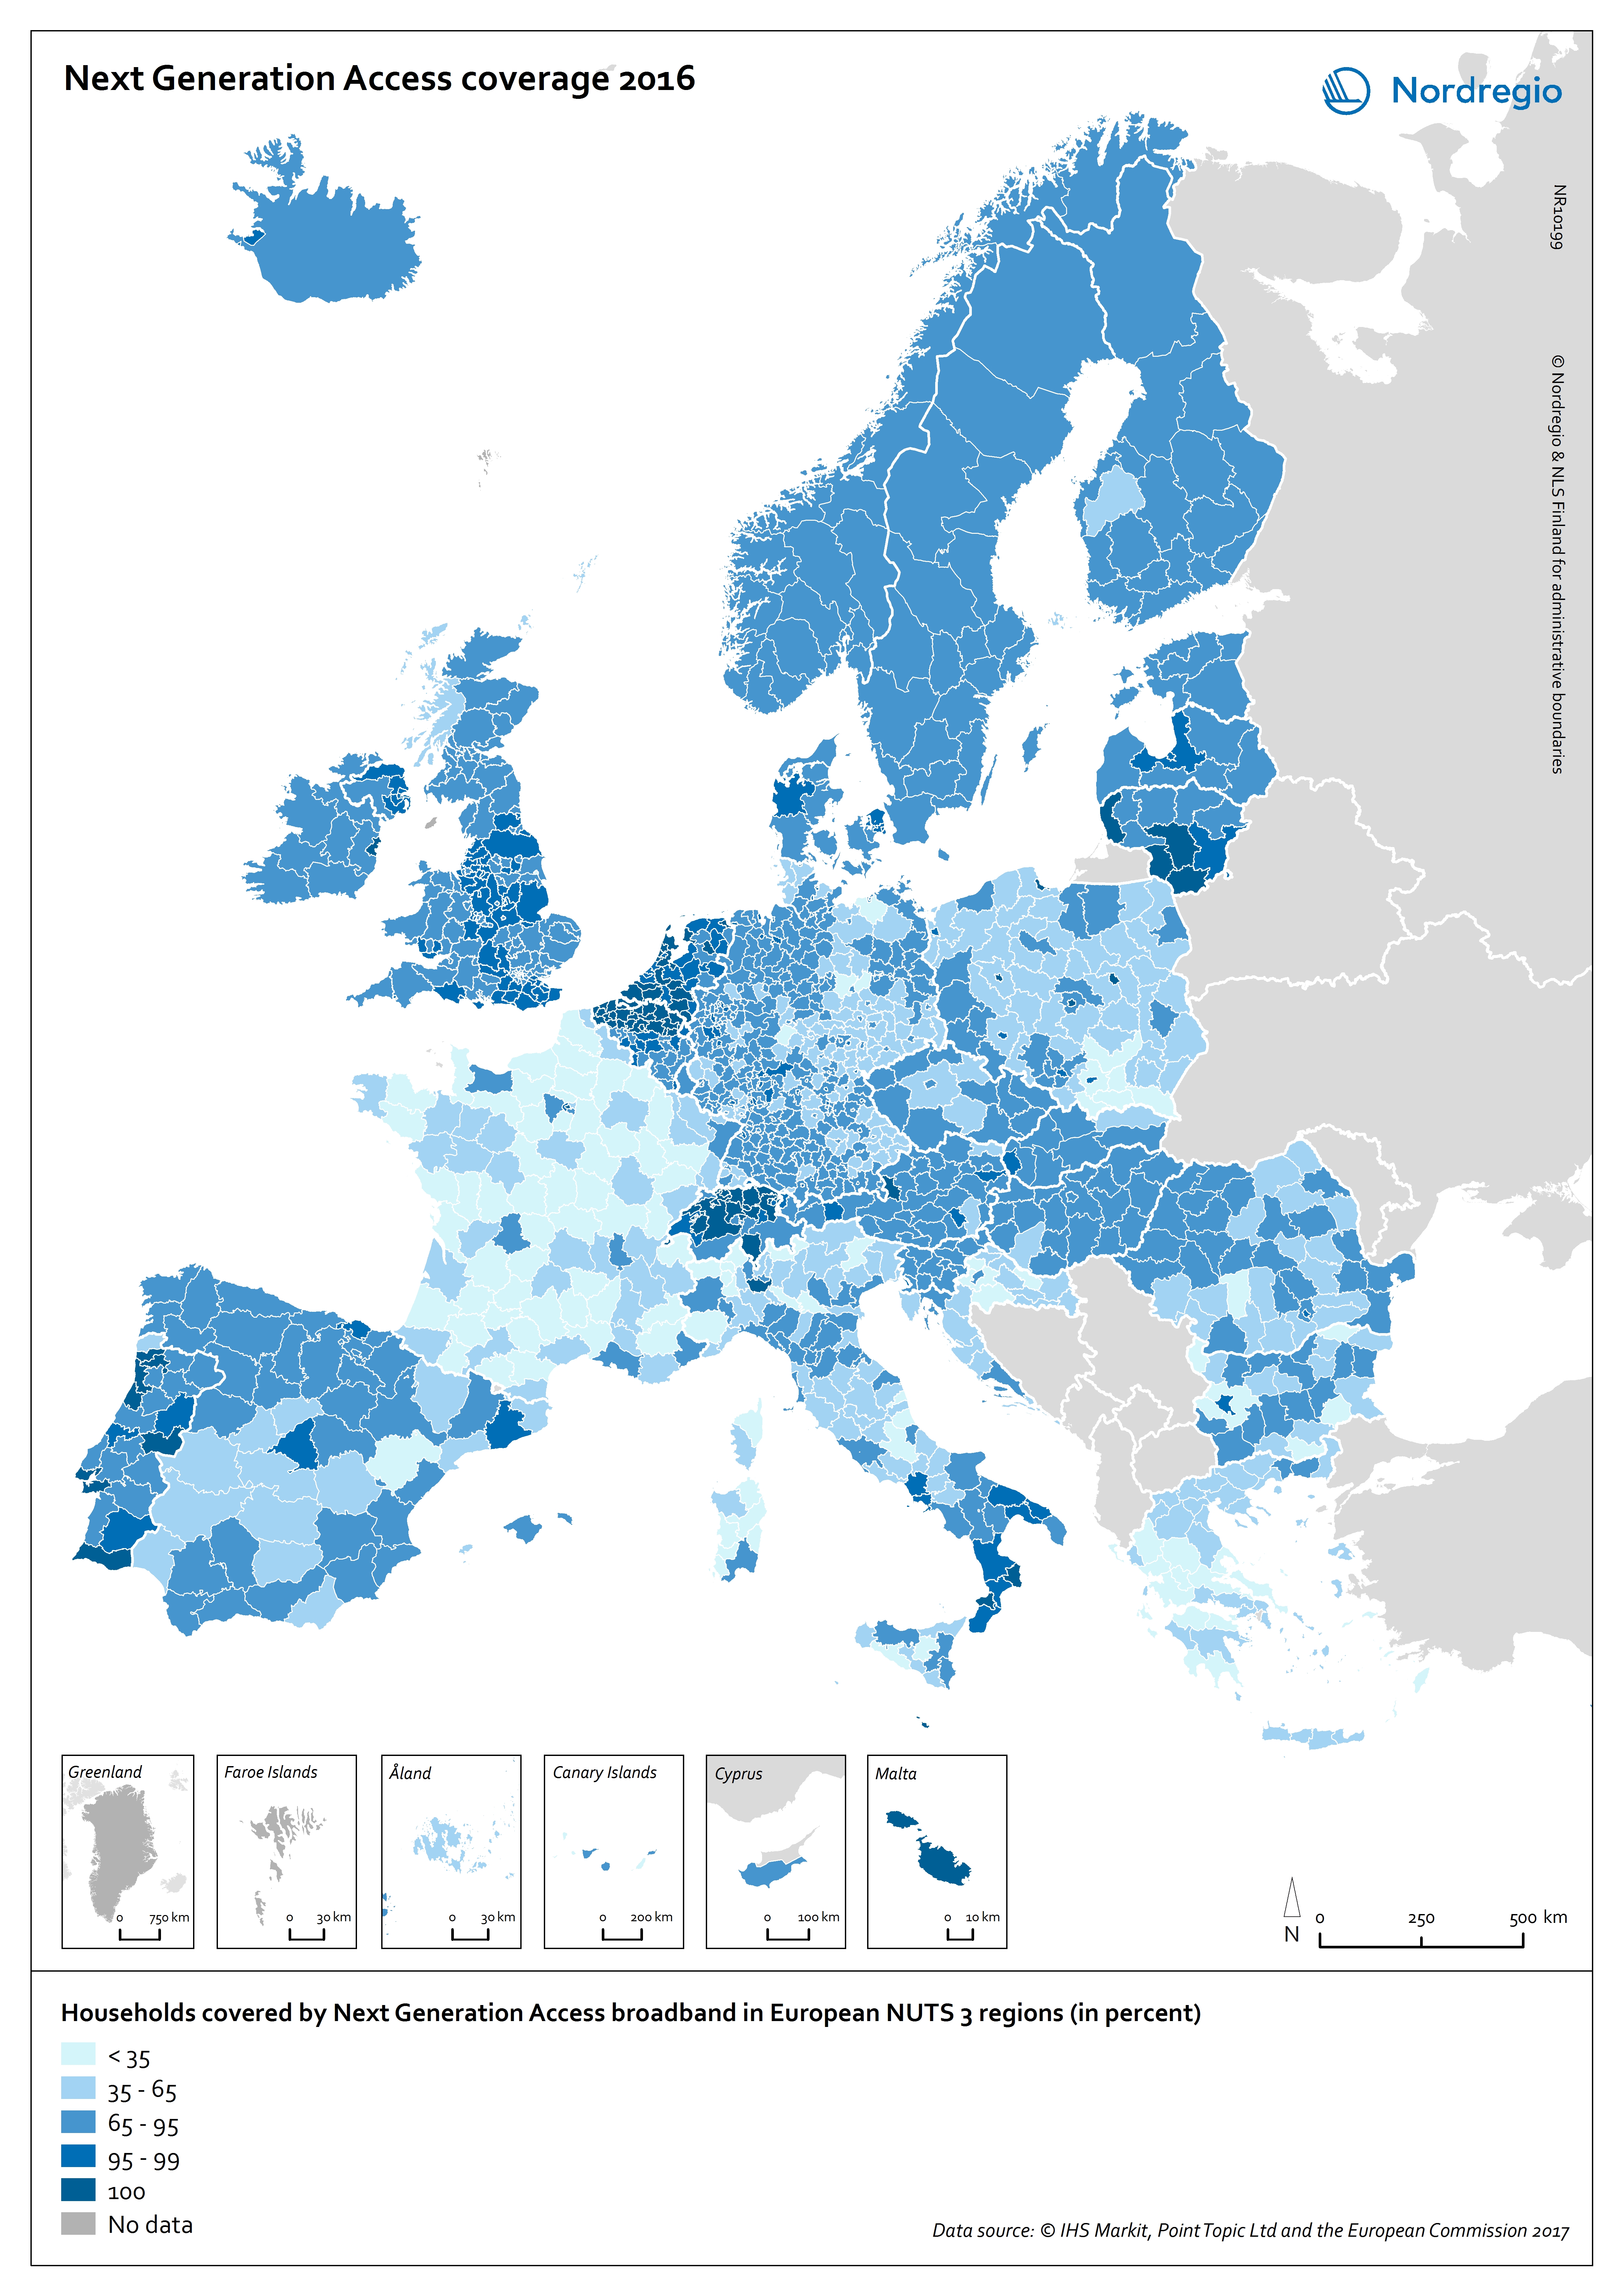
Next Generation Access coverage 2016
This map shows the Next Generation Access (NGA) network coverage in European regions in 2016. The blue shading indicates the percentage of household covered by NGA broadband in European NUTS 3 regions. The darker the blue the larger the percentage of household covered by NGA broadband in the region, while the brightest colours represent regions with a low share. Regions with relatively small territories and important population densities stand out in terms of high NGA network coverage, e.g. urban regions in the Netherlands and Switzerland. Capital city regions also have high NGA network coverage scores, while the more rural regions continue to lag, e.g. in parts of France and Poland. The Nordic countries are characterised by having almost no differences within their territories, i.e. no large variation in terms of NGA network coverage, unlike the clear regional differences in countries such as France or Italy. All regions in the Nordic countries score in the range of 65% to 95% of households having NGA network coverage, except for Etelä-Pohjanmaa in Finland which has a coverage range of 35% to 65% and the Danish statistical region of Østjylland and the capital regions of Denmark and Iceland with scores between 95% and 100% respectively. The relatively high figures for the Nordic Region can in part be explained by the existence of national and regional digitalisation strategies over the last decade or so. In Denmark, as well as in the other Nordic countries, digitalisation has long been on the national agenda. One of the main goals of these strategies has been to increase the growth and productivity of the business community – and to make it easier and cheaper to establish digital infrastructure. The regional level has an important role to play in the development of digital infrastructure, hence the relevance of the elaboration…
- 2018 February
- Europe
- Others
- Research and innovation
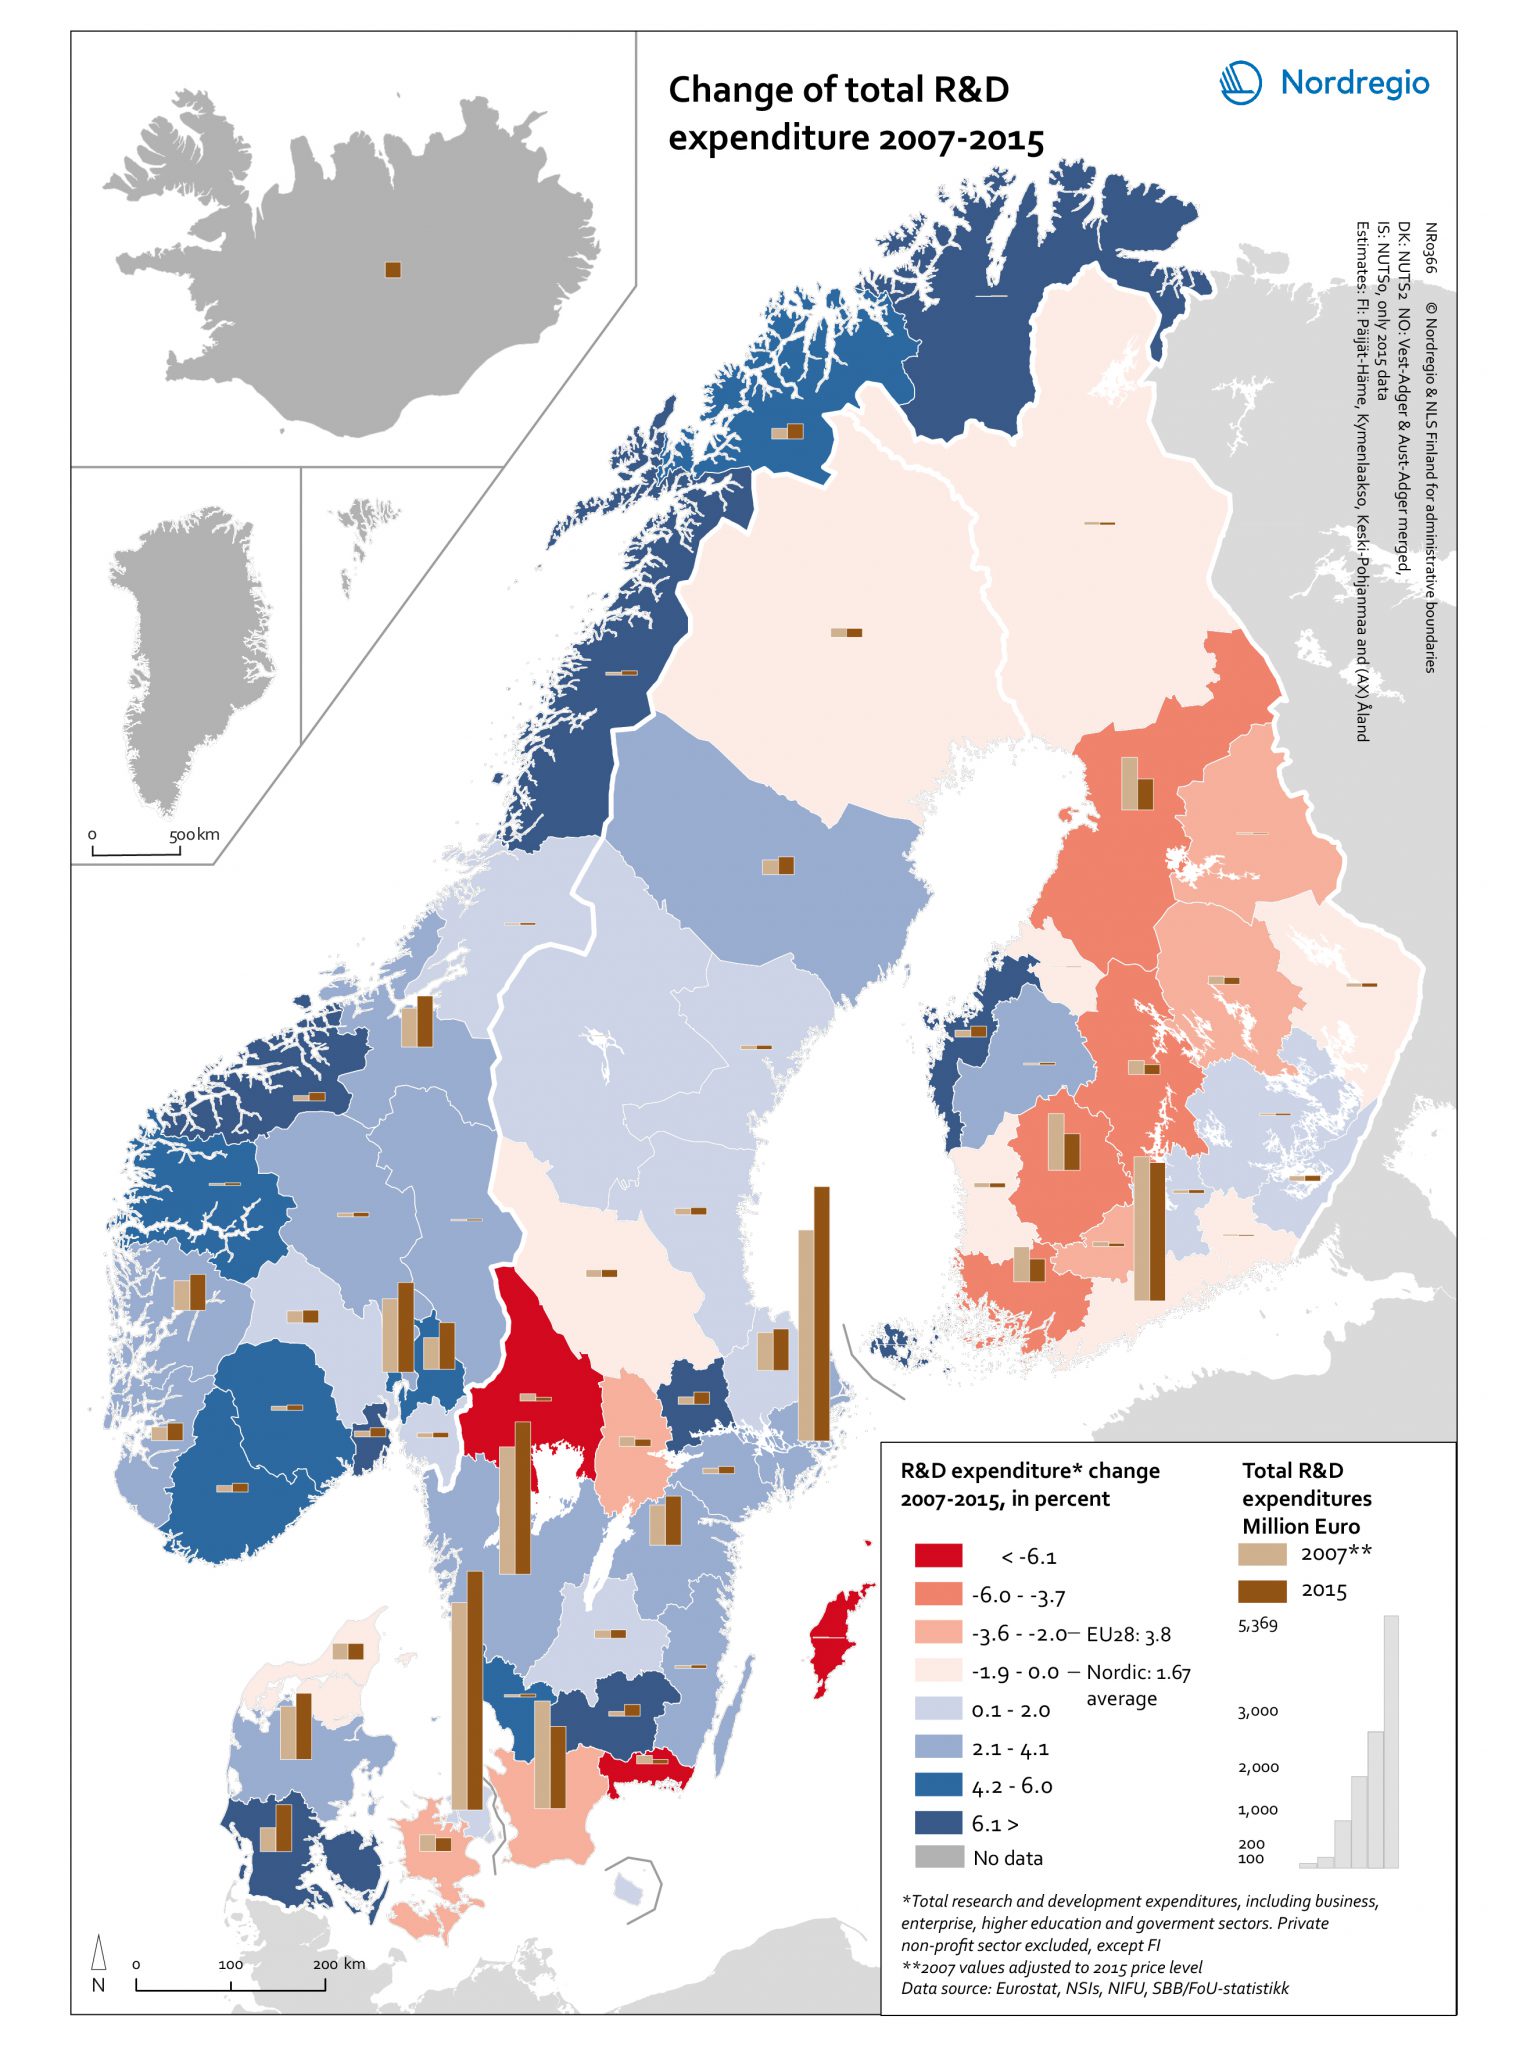
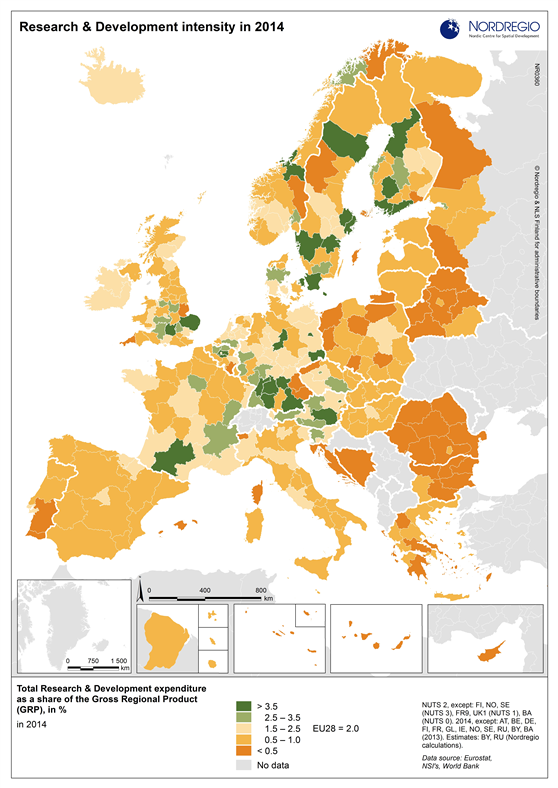
Change of total R&D expenditure 2007-2015
This map shows the change in the expenditure in research and development (R&D) between 2007 and 2015 in the Nordic Region. The blue tones indicate regions with a positive change in the R&D expenditure between 2007 and 2015. The red tones indicate regions with a negative change in the R&D expenditure between 2007 and 2015. The darker the colour, the stronger the change. The grey colour indicates no data. The bars indicate the value of expenditure in R&D in million euros, the light brown for 2007 and the dark brown for 2015. The values of 2007 expenditures were adjusted to 2015 price level. High levels of Research and Development (R&D) expenditure are viewed as a vital enabling factor for innovation which is one of the key policy components of the Europe 2020 Strategy. At the regional level in Finland, most regions have shown a downward trend in R&D expenditures both in percentage and in real terms. This reflects the challenging fiscal policy and economic conditions experienced in Finland after the global financial crisis in 2008 and the difficulties faced by the ICT sector, where R&D is highly concentrated, as well as the inability of other industries to compensate for the decline of the ICT sector. Åland on the other hand has shown a positive trend in R&D expenditures, although having very low values in absolute numbers for both years. Sweden has experienced a dramatic decrease (< -6.1%) in R&D expenditures in Värmland, Blekinge and Gotland which was in large part, if not entirely, caused by the relocation of important R&D facilities/resources. Similarly, some major closures and redundancy notifications led to substantial cuts in R&D spending in Skåne in 2015, despite the increasing number of start-ups. For Iceland, available data for the 2013–2016 period indicates a steady and stable increase in…
- 2018 February
- Economy
- Nordic Region
- Research and innovation
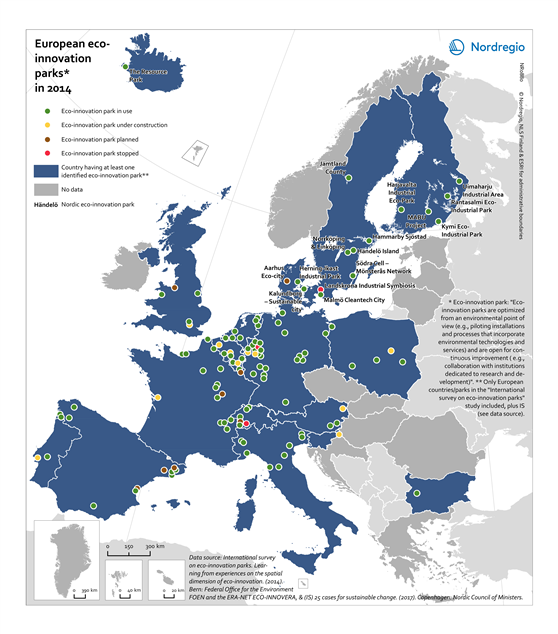
European eco-innovation parks in 2014
This map shows the location of the European eco-innovation parks in the states of the European Union (EU) and Iceland in 2014. The eco-innovation parks are eco-industrial parks and eco-innovative areas combining residential and industrial activities. The establishment of eco-industrial parks is one way to promote eco-innovation, resource efficiency and the circular economy. They create new and innovative business opportunities and improve ecosystems. The blue colour indicates the EU-member states having at least one identified eco-innovation park in 2014. The circles indicate the location and the type of the eco-innovation parks (green, in use; yellow, under construction; brown, planned; red, stopped). The grey colour indicates no data. A clear spatial concentration of eco-innovation parks can be observed in the Ruhr area and around Leipzig (Germany), in southern Belgium, south-western and northern Netherlands, western Switzerland, along the “arch” stretching from Turin via Pisa to Udine in North-East Italy, around Barcelona as well as around some national borders in the industrialised parts of north-West Europe namely Germany-Netherlands-Belgium-France and Switzerland. Eco-innovation parks differ in many respects, for instance regarding energy and material flows (e.g. waste heat, steam, power; wood chips, bark, ash, pulping chemicals), number and size of companies involved and jobs created, public sector involvement and finally, in terms of (the drivers behind) their evolution. The latter means that some parks evolved and expanded around a few economic activities and companies (e.g. saw mills) to include further activities (e.g. pulp mills, power plants etc.), while others were intentionally planned and put into operation.
- 2018 February
- Economy
- Europe
- Research and innovation