This map shows the change in the expenditure in research and development (R&D) between 2007 and 2015 in the Nordic Region.
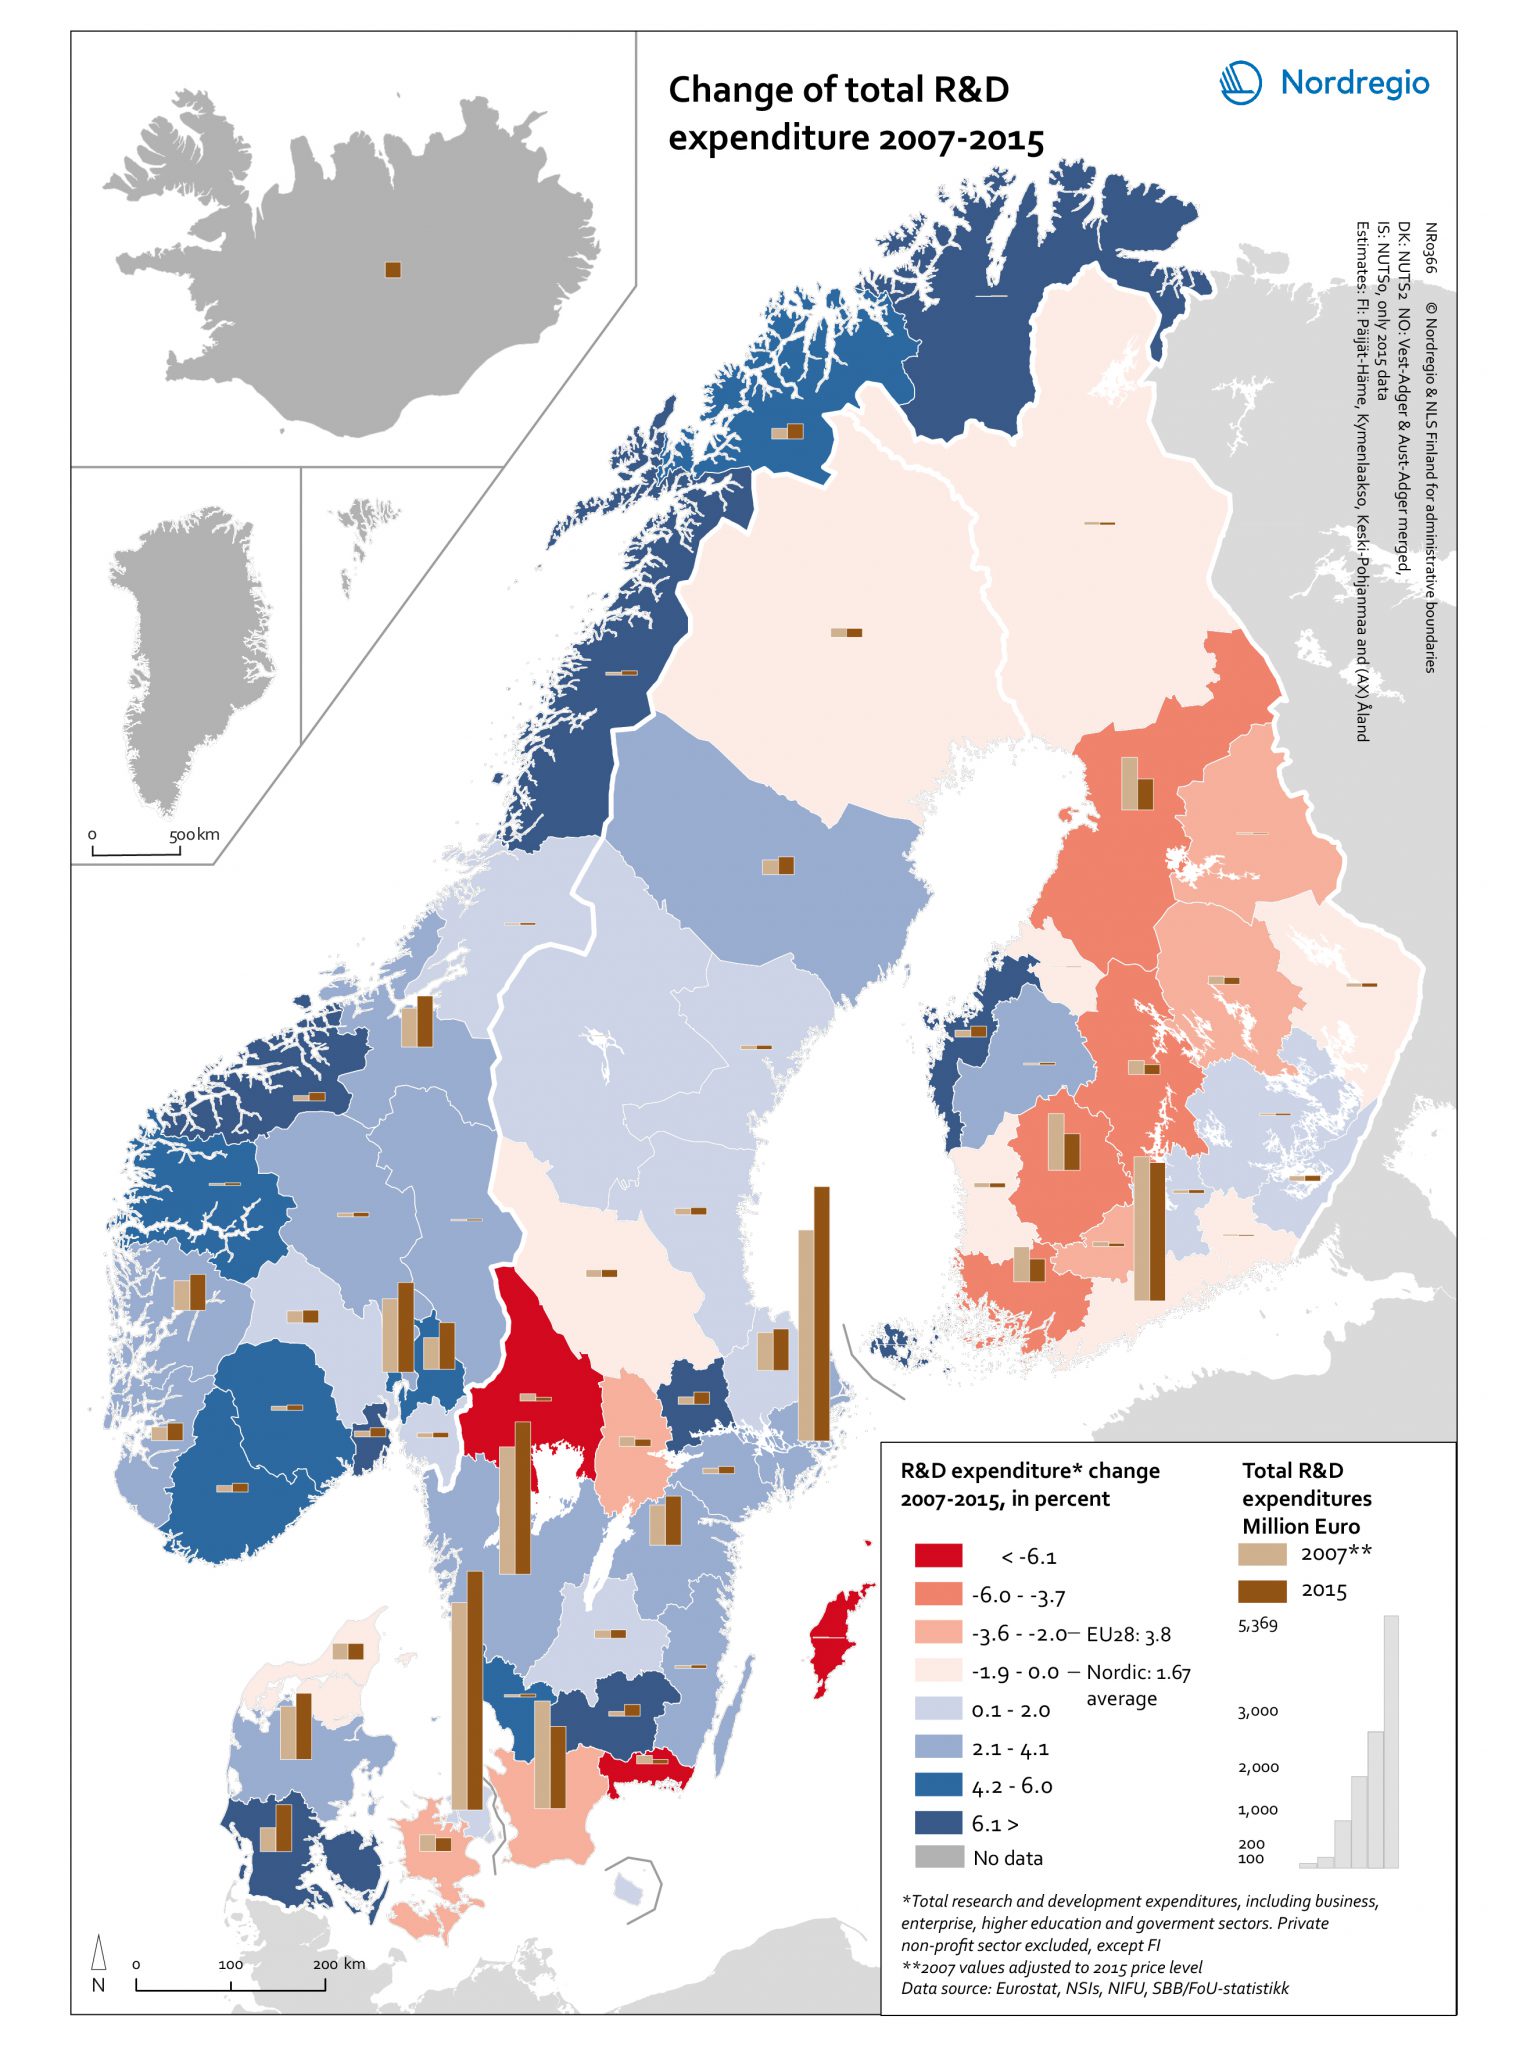
The blue tones indicate regions with a positive change in the R&D expenditure between 2007 and 2015. The red tones indicate regions with a negative change in the R&D expenditure between 2007 and 2015. The darker the colour, the stronger the change. The grey colour indicates no data. The bars indicate the value of expenditure in R&D in million euros, the light brown for 2007 and the dark brown for 2015. The values of 2007 expenditures were adjusted to 2015 price level.
High levels of Research and Development (R&D) expenditure are viewed as a vital enabling factor for innovation which is one of the key policy components of the Europe 2020 Strategy. At the regional level in Finland, most regions have shown a downward trend in R&D expenditures both in percentage and in real terms. This reflects the challenging fiscal policy and economic conditions experienced in Finland after the global financial crisis in 2008 and the difficulties faced by the ICT sector, where R&D is highly concentrated, as well as the inability of other industries to compensate for the decline of the ICT sector. Åland on the other hand has shown a positive trend in R&D expenditures, although having very low values in absolute numbers for both years. Sweden has experienced a dramatic decrease (< -6.1%) in R&D expenditures in Värmland, Blekinge and Gotland which was in large part, if not entirely, caused by the relocation of important R&D facilities/resources. Similarly, some major closures and redundancy notifications led to substantial cuts in R&D spending in Skåne in 2015, despite the increasing number of start-ups. For Iceland, available data for the 2013–2016 period indicates a steady and stable increase in R&D expenditure during these years, which for the business sector can largely be attributed to a gradual increase in the R&D activities of a few major enterprises. All Norwegian regions have seen an increase in R&D expenditures during the 2007–2015 period. Furthermore, Norway’s total R&D expenditure, in contrast to the other Nordic countries, has also been growing during the period 2007–2015 in all regions but one (Buskerud) when measured as a percentage of GDP. According to Statistics Finland (2017), R&D expenditure as a part of GDP share has decreased continuously since 2009 from 3.8% to an estimated 2.7% in 2017. Undoubtedly, significant cuts in public sector research funding led to this decline from the top rank in of international comparisons. In 2015, the Finnish share of public sector spending in respect of the GDP was 0.96% and only topped by Denmark (1.02%) and Iceland (1%). 2016 saw a drop in the R&D share to 0.87%.