44 Maps
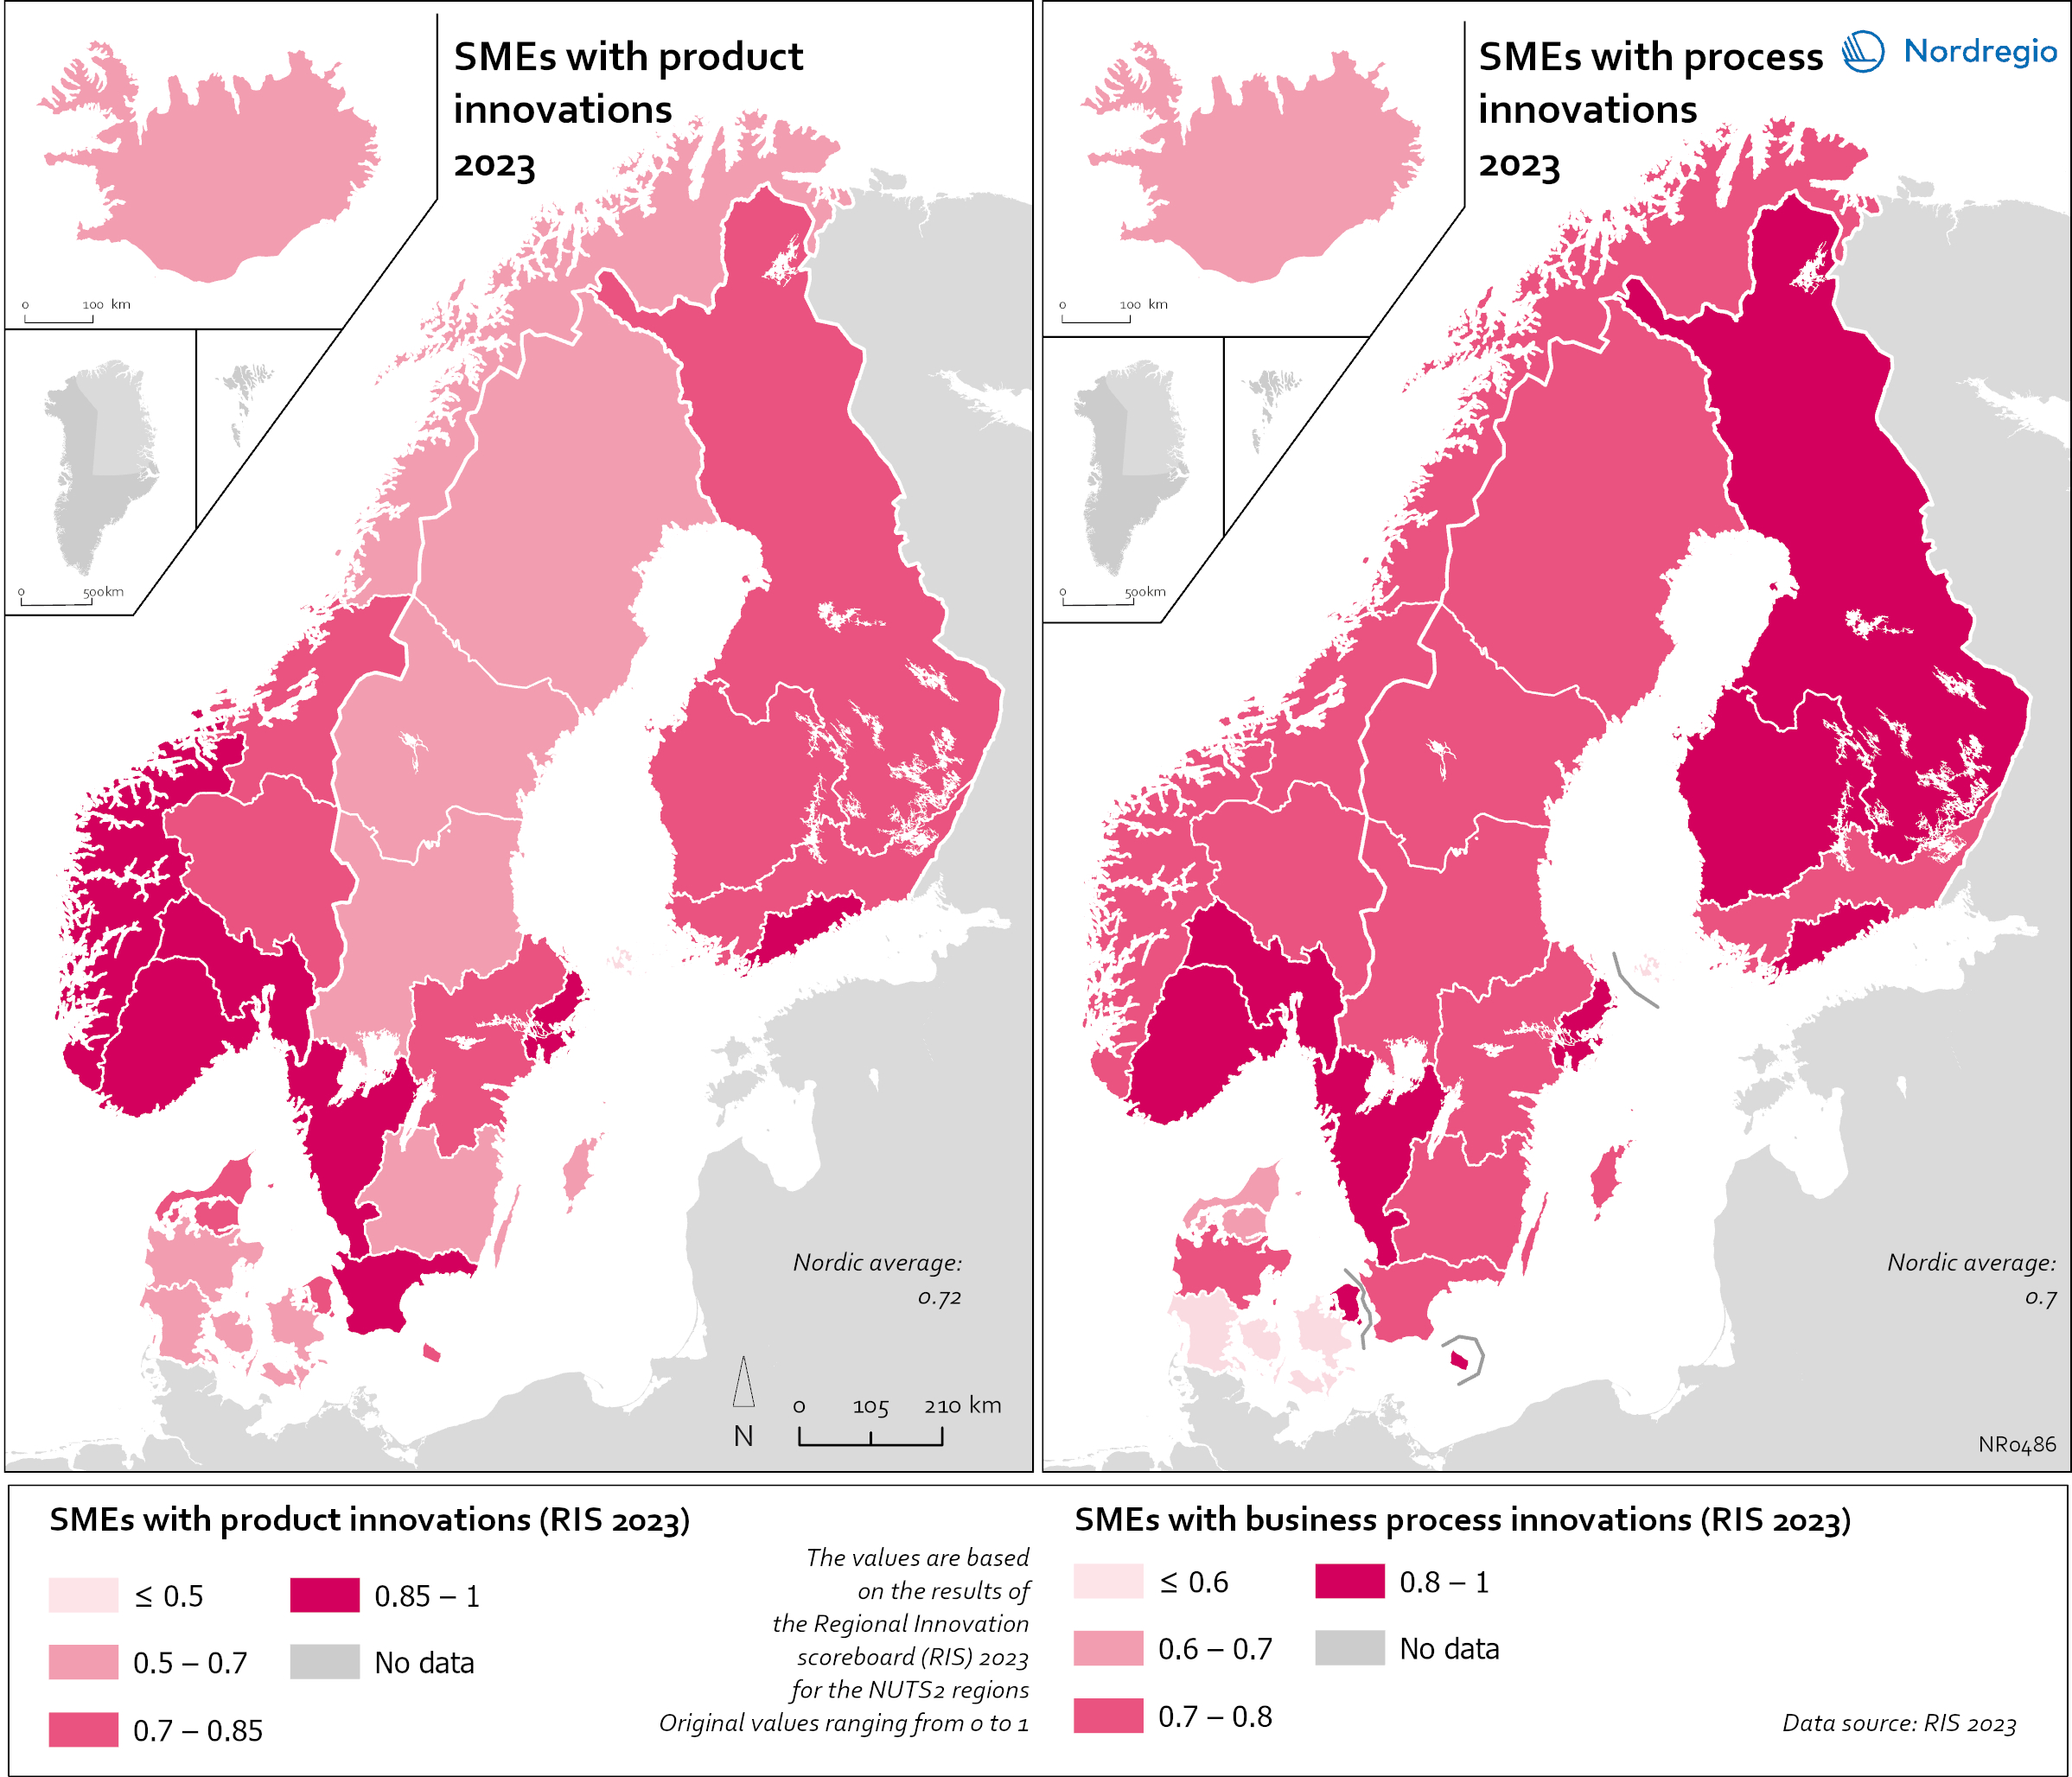
Small and Medium Sized Enterprises (SMEs) with product and business process innovation in 2023
These maps depicts Small and medium sized enterprises (SMEs) with product innovation (left map) and process innovation (right map) in 2023. The data is displayed at the NUTS2 level and the data comes from the Regional Innovation Scoreboard 2023. The left map depicts SMEs introducing product innovations as a percentage of SMEs in the Nordic regions, calculated as the share of SMEs who introduced at least one product innovation. The values for the map are normalised from 0–10. In this context, a product innovation is defined as the market introduction of a good or service that is new or significantly improved with respect to its capabilities, user-friendliness, components, or sub-systems. Rural regions tend to have lower levels of SMEs with product innovations, while urban regions have the highest levels. In 2023, Åland (0.235) had the lowest number of SMEs with product innovations in the Nordic Region, while Oslo had the highest (1.0). Etelä-Suomi and Stockholm regions were slightly behind, with 0.954 and 0.948, respectively. In Denmark, the leading regions were the Capital Region (Hovedstaden) and Northern Jutland (Nordjylland), with 0.719 and 0.715, respectively. Southern Denmark (Syddanmark) had the lowest level in Denmark, at 0.545. In Norway, the lowest value was in Northern Norway (Nord-Norge), 0.67, while in Sweden it was Middle Norrland (Mellersta Norrland), with 0.53. Taken as an average across the Nordic countries, Norway has a significantly higher number of SMEs with product innovations than the other countries. The right map shows the share of SMEs introducing at least one business-process innovation, which includes process, marketing, and organisational innovations. In general, Nordic SMEs are more likely to innovate in products rather than processes. The highest shares of process-innovating SMEs are found in most of the Finnish regions ranging from 0,79 in Länsi-Suomi to 0,91 in Etelä-Suomi, except of Åland…
 2025 April
 - Economy
- Nordic Region
- Research and innovation
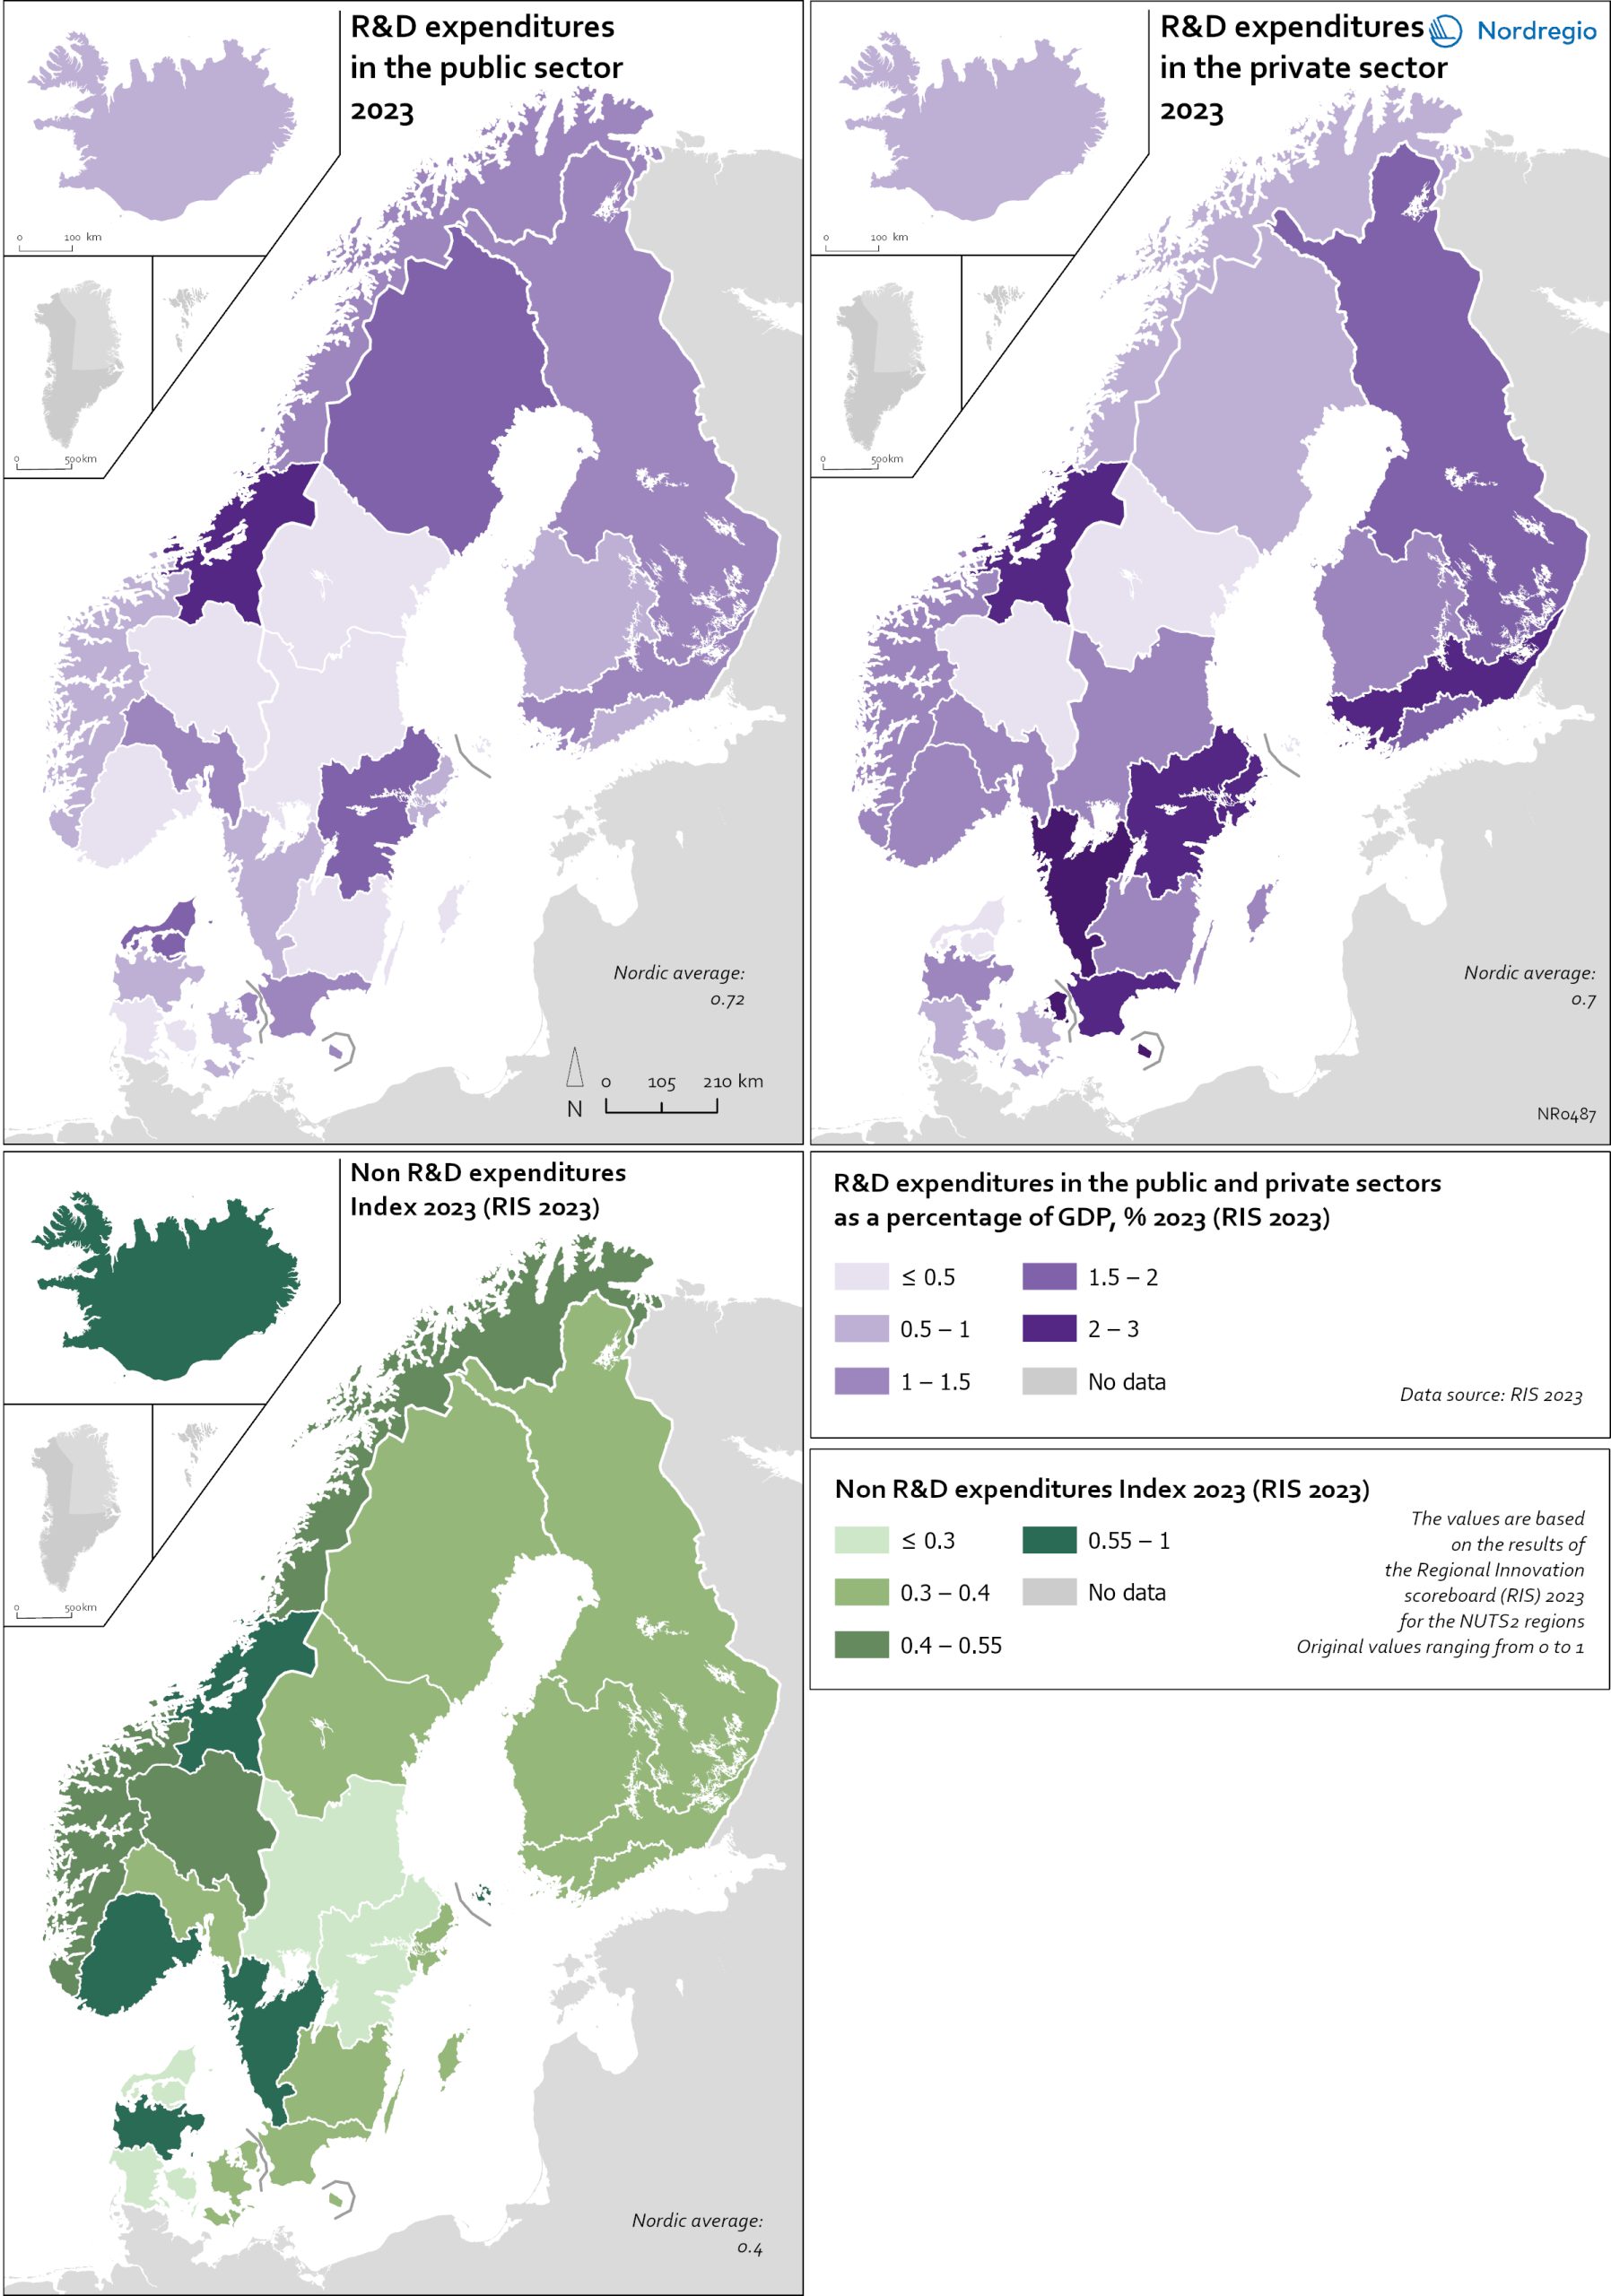
R&D and non-R&D expenditures in the public and private sector
These maps shows the expenditure on Research and Development (R&D) in the public and business sectors as a percentage of regional GDP, along with non-R&D innovation expenditure in Small and Medium Enterprises (SMEs) as a percentage of turnover. Together, these metrics offer a comprehensive understanding of the innovation landscape and provide insights into governments’ and higher education institutions’ commitment to foundational research, as well as the competitiveness and dynamism of the business environment and SMEs’ innovation capacity. By considering investment in both R&D and non-R&D activities, these indicators illustrate a broad spectrum of innovation drivers, from basic research to market-driven initiatives, and underscore the diverse pathways through which innovation fosters economic growth and social progress First, the top left map showcases R&D expenditure in the public sector as a percentage of GDP in the Nordic countries in 2023. In that year, the European level of R&D expenditure in the public sector, as a percentage of GDP, was 0.78%. By comparison, the Nordic average was 0.9%. While the more urban regions, in general, lead the Nordic regions, this is not always the case, as shown by the variation between the frontrunners. The leading region is Trøndelag (including Norway’s third-largest city, Trondheim), with 2.30% of regional GDP. It is in third place in the EU as a whole. The next regions are Övre Norrland with 1.77%, Northern Jutland with 1.54%, Östra Mellansverige with 1.52%, and Hovedstaden with 1.49%. A common feature of most of the top-ranking regions is that they host universities and other higher education institutions known for innovation practices. Most Nordic regions have not seen significant increases or decreases in public R&D spending between 2016 and 2023. The top right map focuses on the private sector’s investment in research and development activities and depicts R&D expenditure in the business sector…
- 2025 April
- Economy
- Nordic Region
- Research and innovation

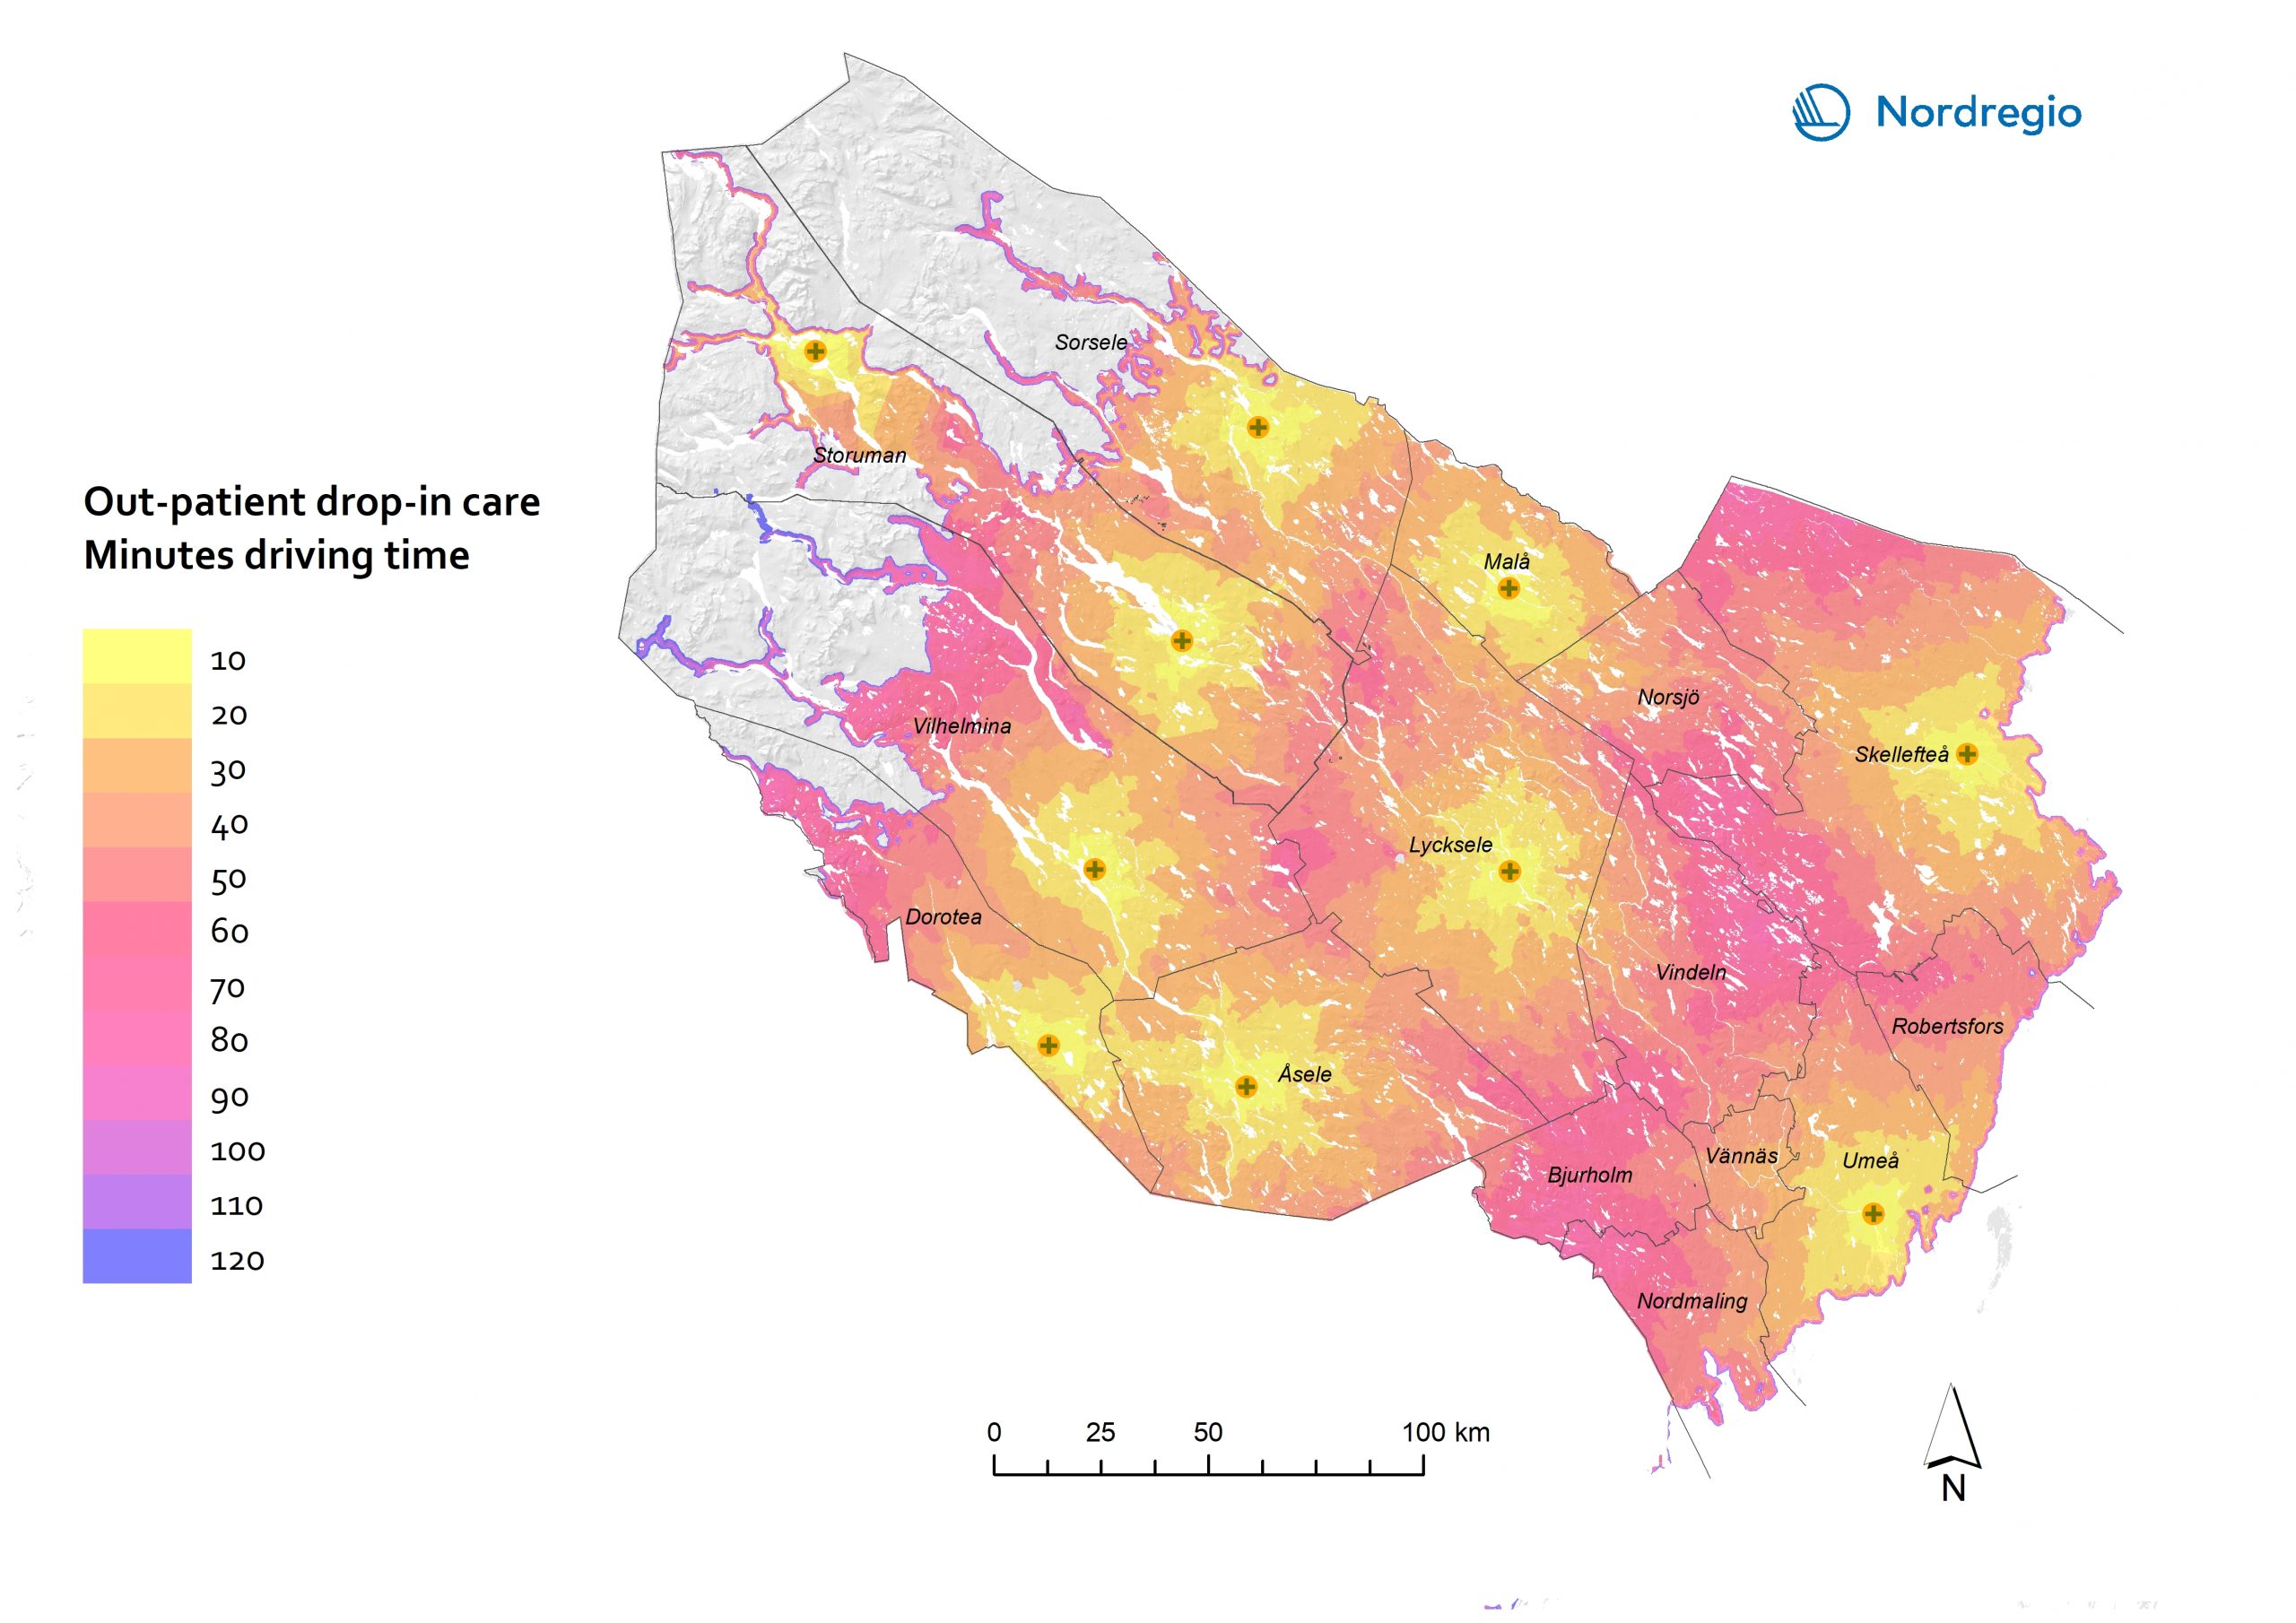
Employment in high-skilled occupations 2022
This map displays the share of high-skilled workers as a share of the total number of workers in Nordic municipalities (big map) and regions (small map). “High-skilled workers” is here defined as group 1-3 (Managers, Professionals and Techinicians/associated professionals) of the International Standard Classification of Occupations (ISCO). For Iceland national data is used. The EU average of high-skilled workers is 43%, and the Nordic countries are at the top of the rankings – 49.5% in Finland, 51.1% in Denmark, 54.2% in Norway, 54.5% in Iceland and 58.9% in Sweden. On a regional level, the highest share is in the capitals and bigger cities, such as Stockholm (72%), Oslo (71%), Hovedstaden (Copenhagen) (60%), Uppsala (60%) and Uusima (Helsinki) (59%). The lowest shares are in the Finnish regions of EteläPohjanmaa, Keski-Pohjanmaa, Satakunta and Etelä-Savo (less than 40%). However, this does not necessarily mean that employers will have a greater chance of successfully recruiting high-skilled workers in the future, partly because those in this group already have jobs and partly due to generally lower investments in education.
- 2025 April
- Labour force
- Nordic Region
- Research and innovation