59 Maps
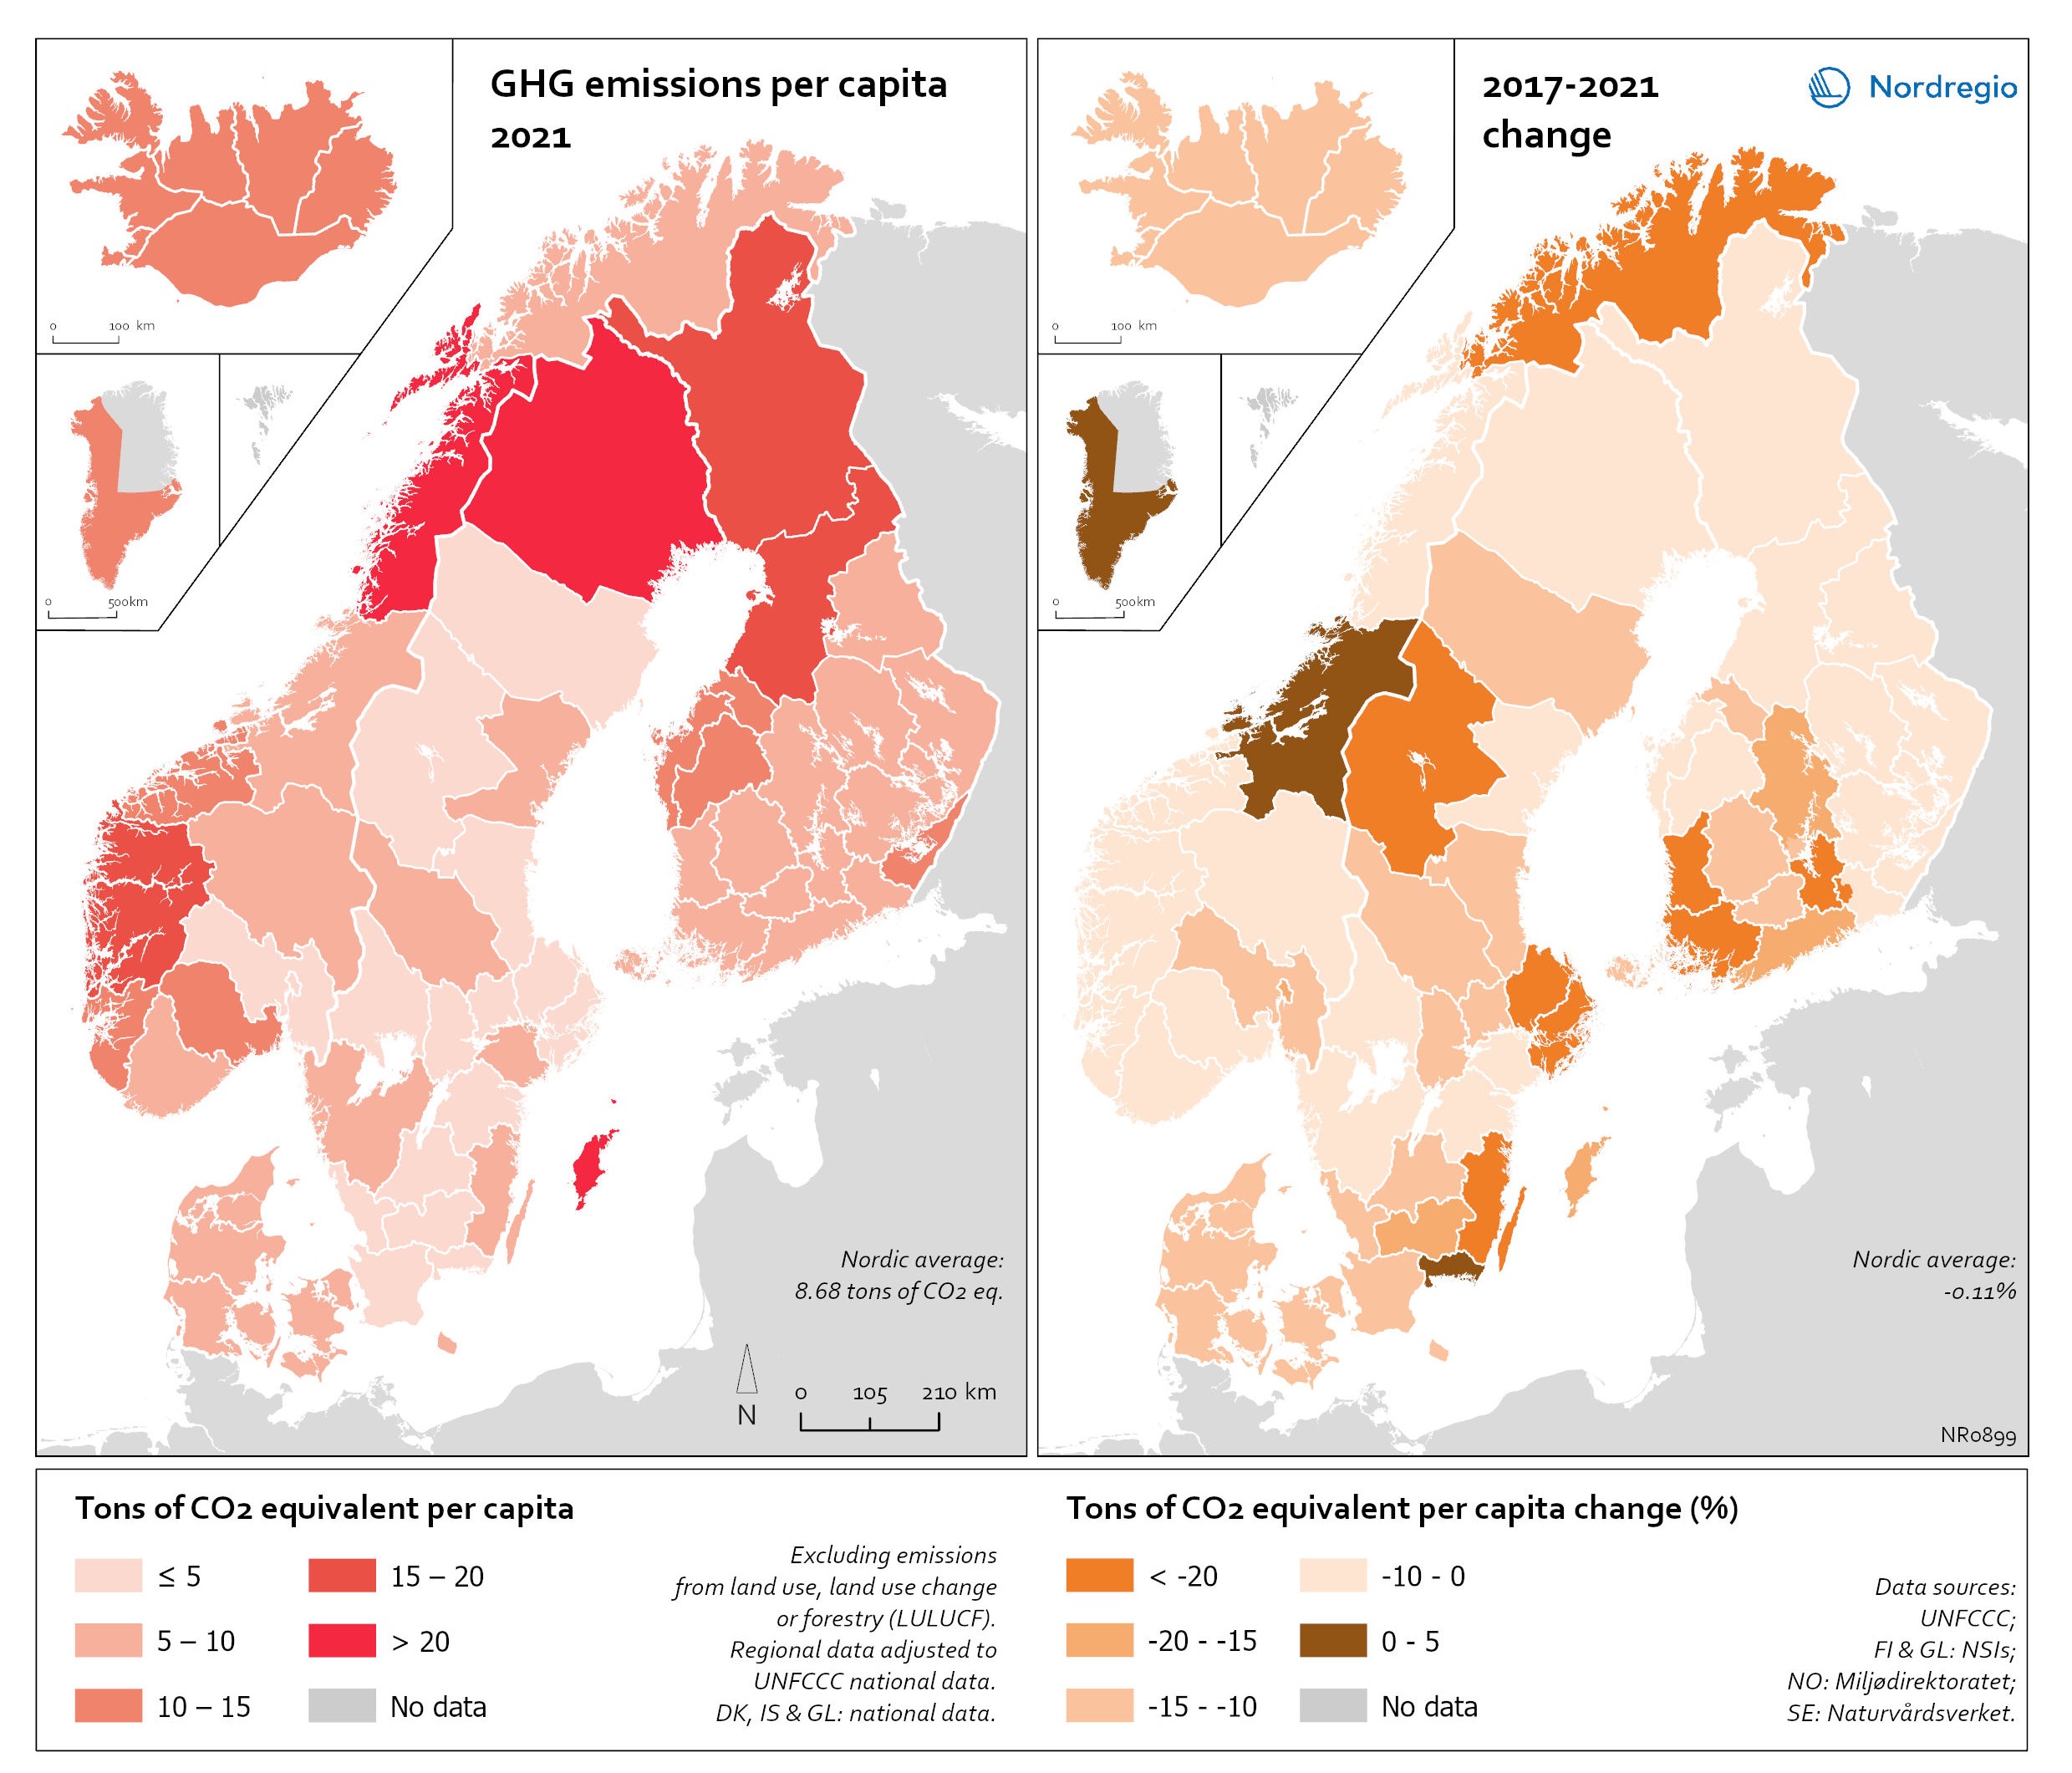
Regional GHG emissions per capita in 2021 and change 2017-2021 on a territorial basis
The data excludes emissions from land use, land use change or forestry (LULUCF). The regional data has been adjusted to UNFCCC national data. The data for Denmark, Iceland and Greenland is on national level. It should be noted that displaying emissions on a territorial basis may be skewed due to the inter-regional dynamics of energy processes, natural resource distributions and concentrations of industrial activities. From 2017 to 2021, the Nordic regions cut their per-capita GHG emissions by on average 11.3%, with an overall Nordic average fall of 8.7% over the same period. In regions historically reliant on fossil fuels for heat and power generation, emissions have continued to decline. This trend is evident in Denmark, as well as in Southern Sweden and Southern Finland – densely populated areas that have taken steps toward expanding district heating coverage and reducing carbon intensity. The largest decrease in GHG emissions per capita was found in Troms and Finnmark, with a 42.3% decrease, Satakunta with a 30.2% decrease and Päijät-Häme – Päijänne-Tavastland with a 29.2% decrease. Only three regions (Greenland, Trøndelag and Blekinge) saw an increase in GHG emissions per capita. At an aggregated level, industrial-related emissions decreased throughout the Nordic Region, but this trend does not hold true for regions in Norway with intensive offshore oil and gas operations. For instance, Nordland, Vestland, Møre og Romsdal, Vestfold and Telemark exhibited the highest per capita emissions in 2021. Between 2017 and 2021, emissions were increasing in many Norwegian regions with intensive offshore oil and gas activity, but also in Norrbotten in Sweden (21.2 tonnes of CO2 equivalent per capita) and Gotland (33.6 tonnes of CO2 equivalent per capita) due to intensive activity in the metal and cement industries, respectively, as well as in several Finnish regions. At the other end of the scale, the…
 2025 April
 - Environment
- Nordic Region
Electricity production 2021
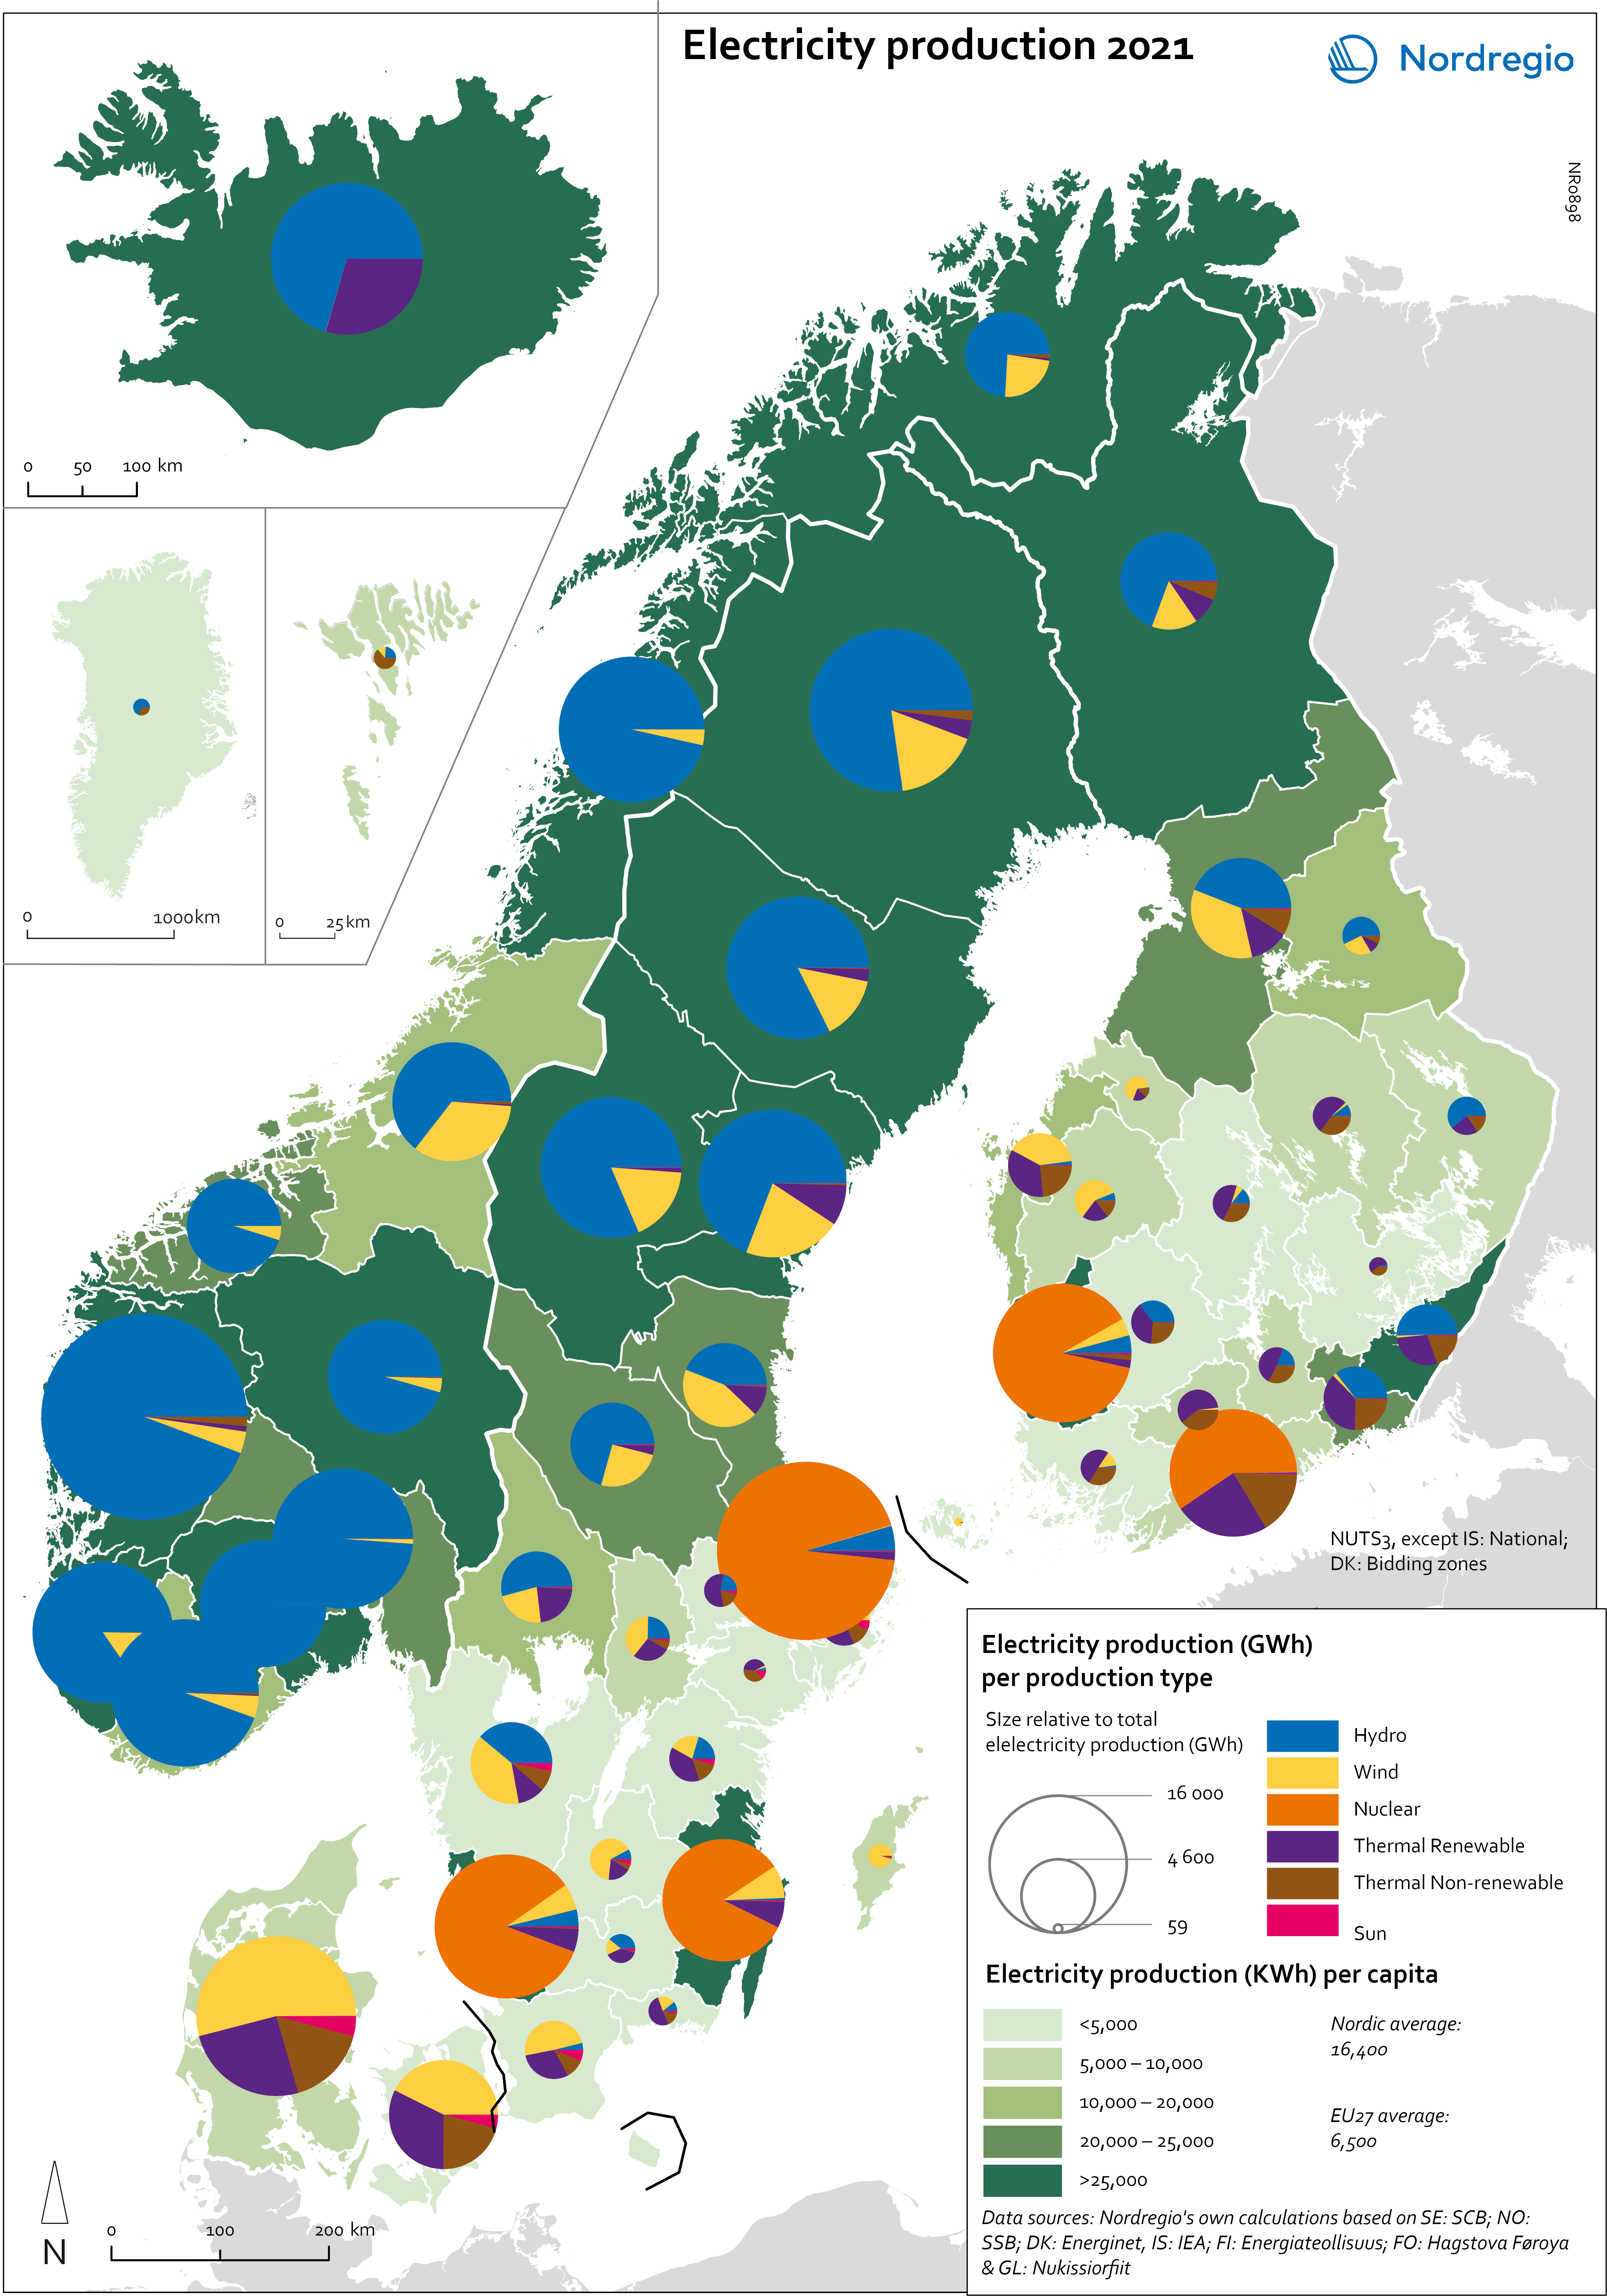
This map shows the spatial distribution of Nordic electricity production per capita, by volume and source type in the Nordic Region in 2021. The data is presented at a regional level, except for Iceland (national level) and Denmark (bidding zones). The circles represent electricity production in GWh, while the green shades indicate electricity production per capita (kWh). Finally, the colour of the circles denotes the source of electricity. The Nordic Region overall has a high electricity production per capita; in fact, Iceland and Norway have the world’s highest electricity production per capita. The electricity mix in 2021 was 96% fossil-free – 73% from renewables (mainly hydropower) and 17% from nuclear power. In 2000 85% of the electricity production was fossile-free. Still there are clear spatial differences in the electricity production. Firstly, we see the high amount of electricity being produced for the five nuclear facilities in Sweden and Finland. Secondly, a substantial volume of hydro-electricity is produced in southern Norway, throughout Iceland, Northern Sweden and Northern Finland. As a result, over half of Nordic electricity is produced from hydropower. Wind power is the source of electricity that has been growing the most during the last two decades, from 1.2% in 2000 to 14% in 2021. The regions with the highest electricity production per capita are in Iceland, Northern Sweden, and Northern and Western Norway. Both Finland and Denmark are net importers of electricity, but both countries have rapidly transitioned away from fossil fuels. Cheap and fossil-free electricity is a prerequisite for the green transition and with growing industries within e.g. battery production, green steel and mining, the need for fossil-free electricity is expected to increase in the coming decades.
- 2025 April
- Environment
- Labour force
- Nordic Region
Greenhouse gas emissions intensity of employment in 2022
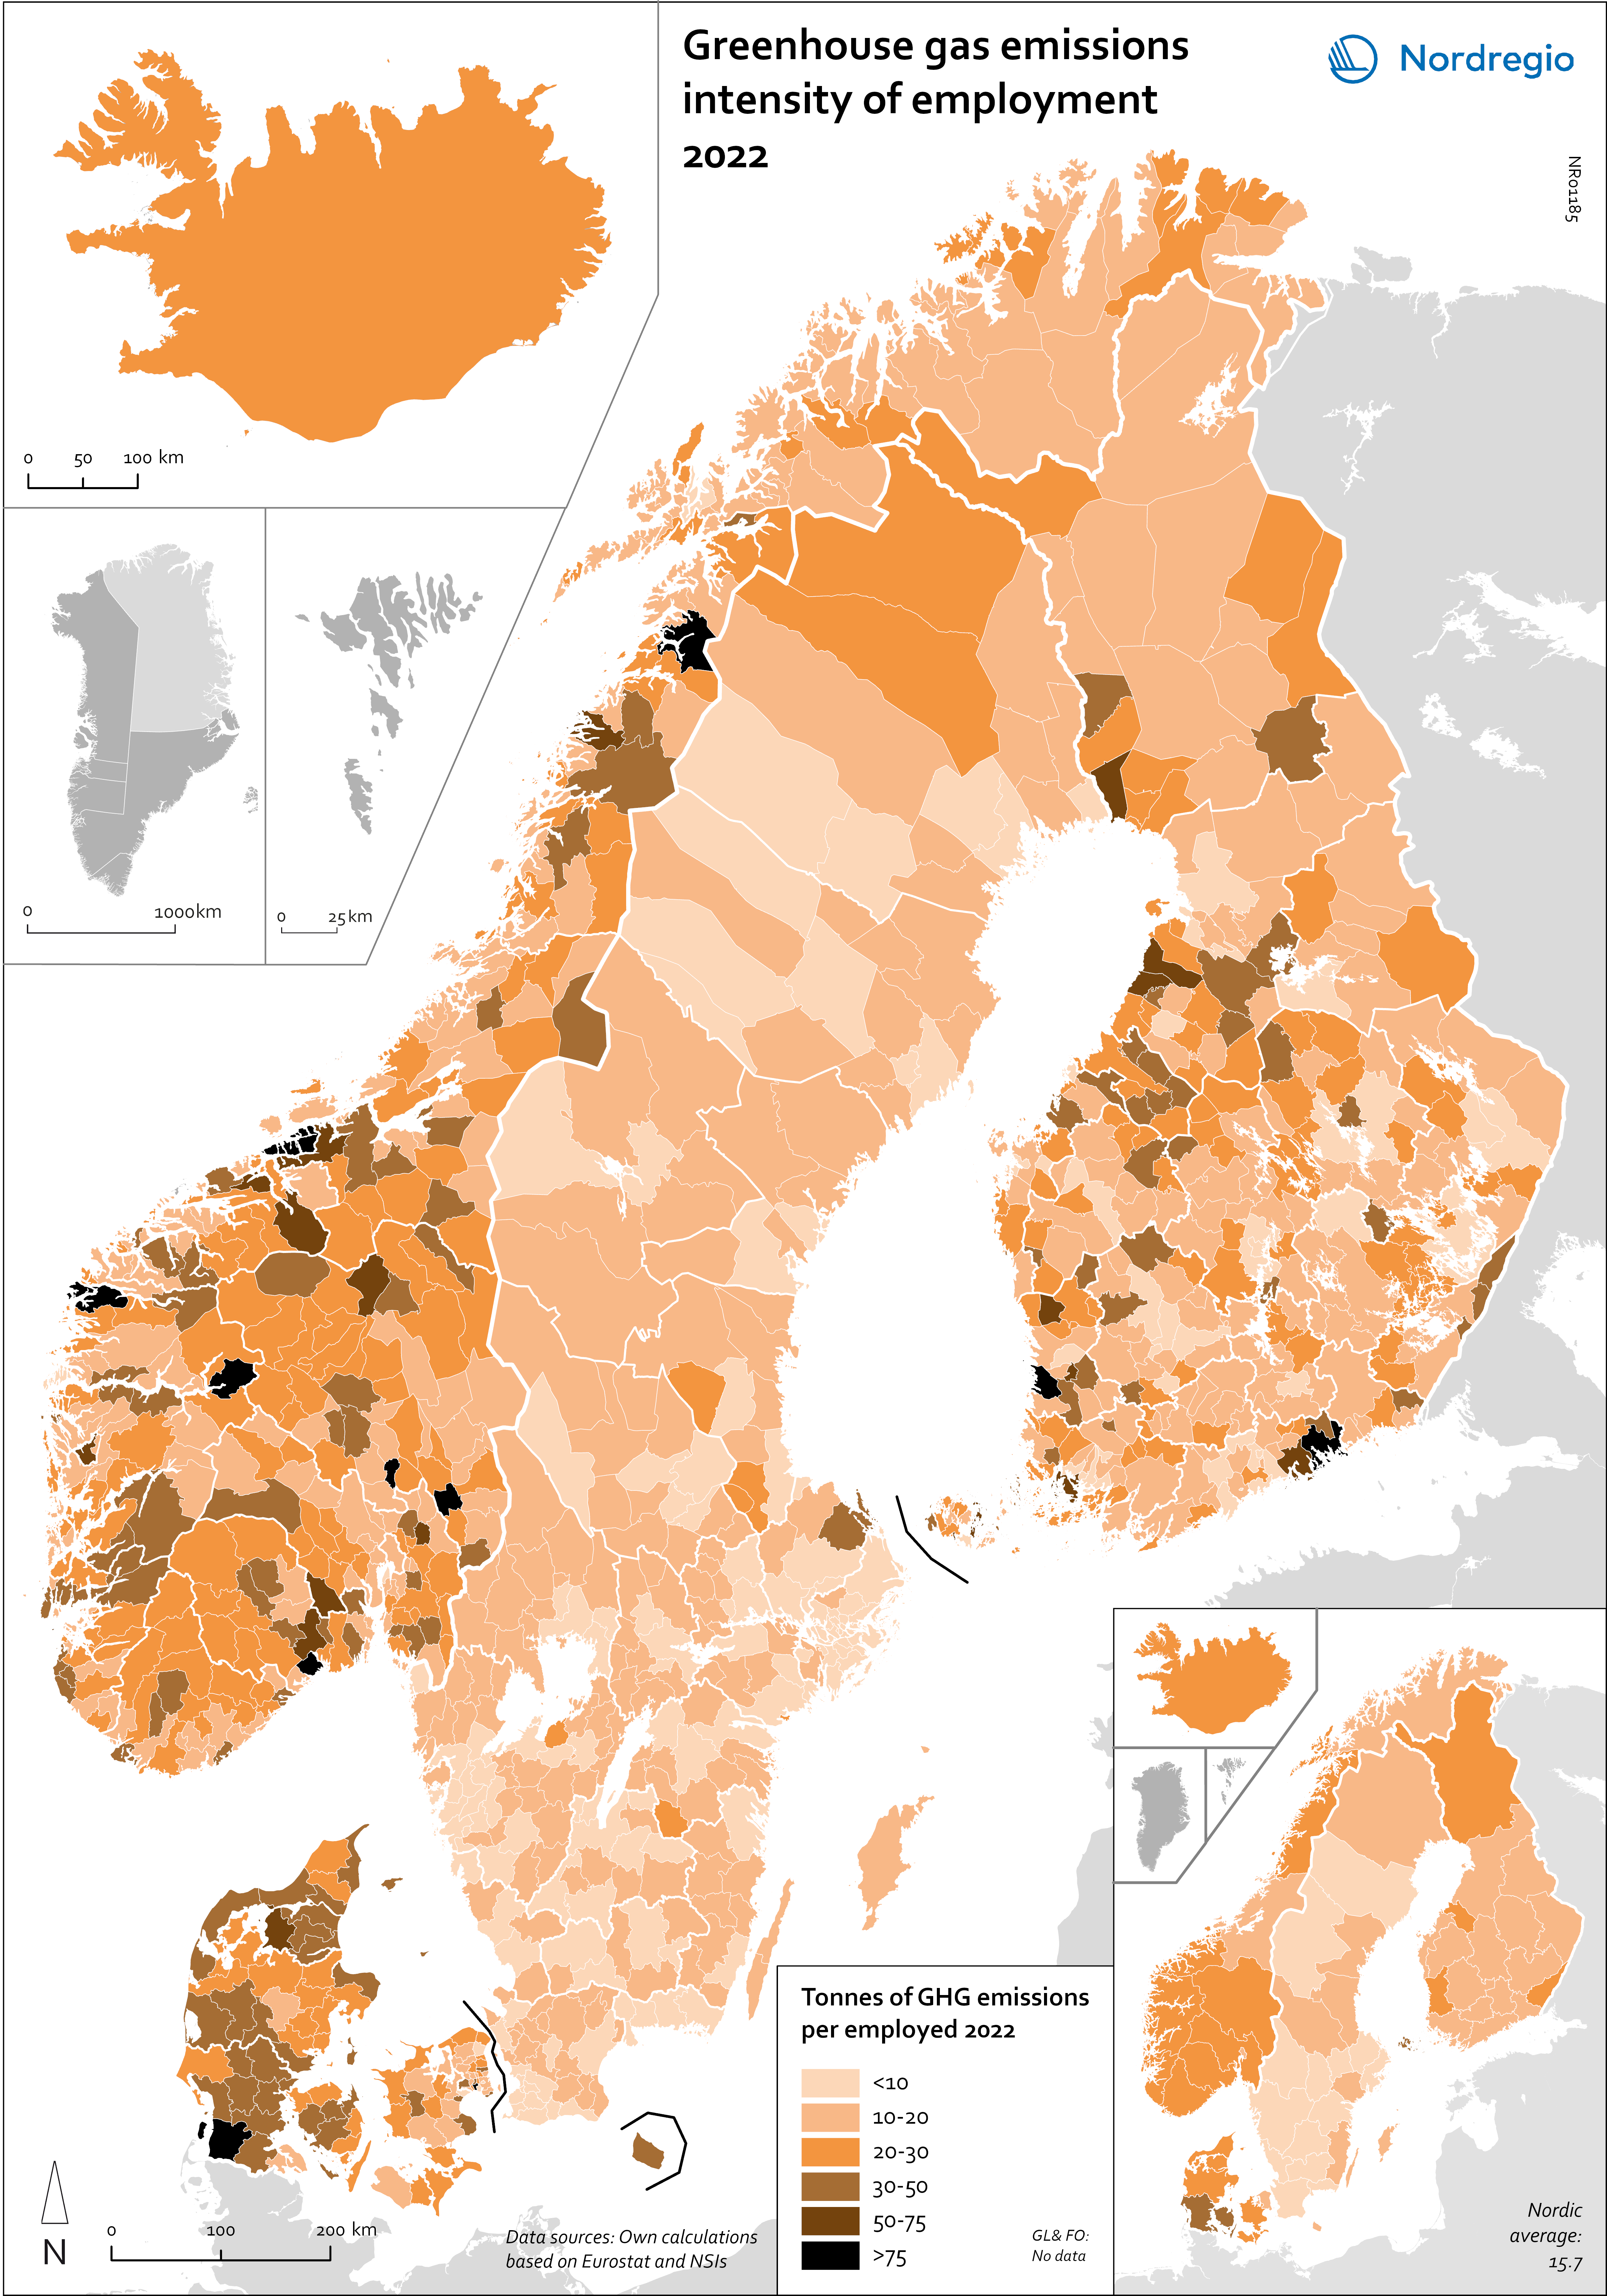
This map shows the tonnes of greenhouse gas emissions per person employed in Nordic municipalities (big map) and regions (small map) in 2022. The data for Iceland is presented at the national level, while no data was available for the Faroe Islands and Greenland. The map is based on data on emissions per sector and country from Eurostat and detailed employment by sector data from the Nordic statistical offices. By calculating the average emissions per person employed and per sector we could use municipal employment by sector data to assess the average emissions per person employed in each municipality. The results are an estimation based on the assumption that all jobs in the same sector have the same GHG emissions. In 2022, greenhouse gas (GHG) emissions per person employed in the Nordic Region were 15.7 tonnes. This is higher than the EU average of 13.5 tonnes. There are also fairly big differences between the Nordic countries, with higher emissions per person employed in Iceland (28.6), Denmark (23.1) and Norway (20.5) and lower emissions in Finland (15.7) and Sweden (8). On the other hand, the emissions per person employed have decreased faster in the Nordic Region than for the EU as a whole. In the last decade, emissions per person employed fell by 24% in the Nordic Region compared to the EU average of 22%. The biggest decrease (32%) was in Finland. The sectors with the highest emissions per worker vary slightly between the countries. In Sweden and Norway, the sector with by far the highest emissions per worker was the manufacture of petroleum coke and refined petroleum products. However, it should be noted that the number of workers in this sector is small. In Denmark, the highest emissions by person employed could be found in water transport; in Finland, in…
- 2025 April
- Environment
- Labour force
- Nordic Region