91 Maps
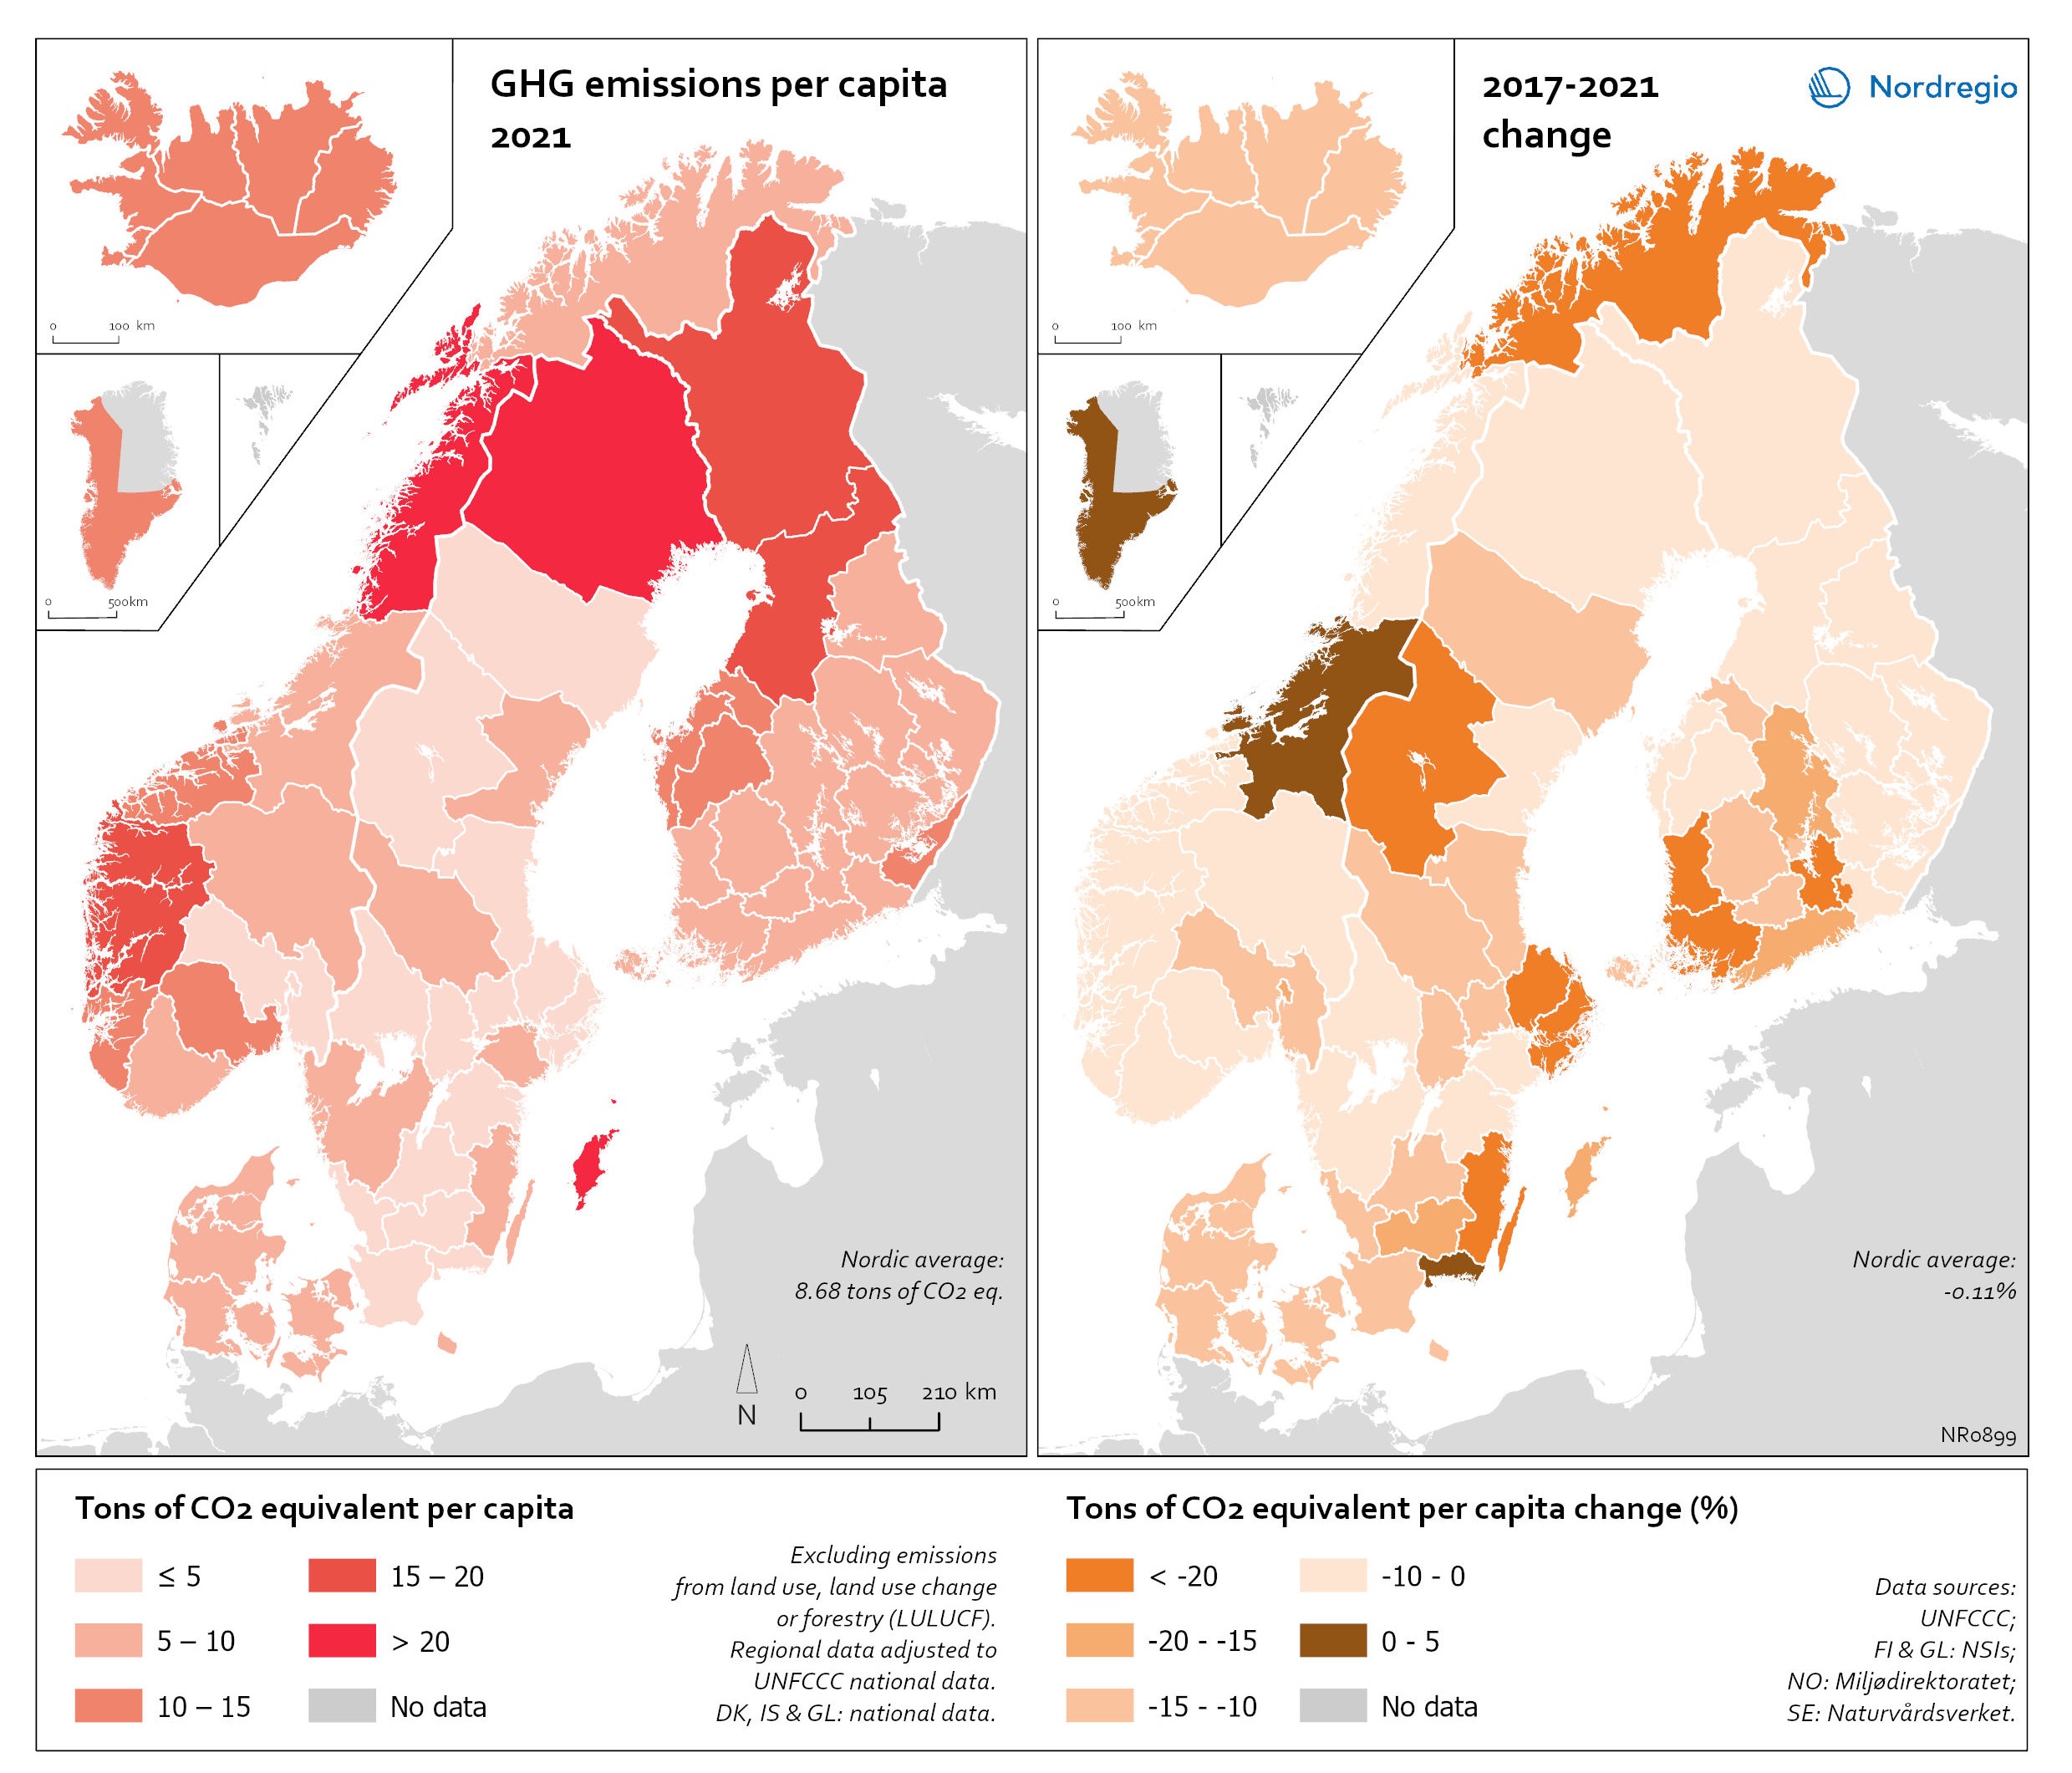
Regional GHG emissions per capita in 2021 and change 2017-2021 on a territorial basis
The data excludes emissions from land use, land use change or forestry (LULUCF). The regional data has been adjusted to UNFCCC national data. The data for Denmark, Iceland and Greenland is on national level. It should be noted that displaying emissions on a territorial basis may be skewed due to the inter-regional dynamics of energy processes, natural resource distributions and concentrations of industrial activities. From 2017 to 2021, the Nordic regions cut their per-capita GHG emissions by on average 11.3%, with an overall Nordic average fall of 8.7% over the same period. In regions historically reliant on fossil fuels for heat and power generation, emissions have continued to decline. This trend is evident in Denmark, as well as in Southern Sweden and Southern Finland – densely populated areas that have taken steps toward expanding district heating coverage and reducing carbon intensity. The largest decrease in GHG emissions per capita was found in Troms and Finnmark, with a 42.3% decrease, Satakunta with a 30.2% decrease and Päijät-Häme – Päijänne-Tavastland with a 29.2% decrease. Only three regions (Greenland, Trøndelag and Blekinge) saw an increase in GHG emissions per capita. At an aggregated level, industrial-related emissions decreased throughout the Nordic Region, but this trend does not hold true for regions in Norway with intensive offshore oil and gas operations. For instance, Nordland, Vestland, Møre og Romsdal, Vestfold and Telemark exhibited the highest per capita emissions in 2021. Between 2017 and 2021, emissions were increasing in many Norwegian regions with intensive offshore oil and gas activity, but also in Norrbotten in Sweden (21.2 tonnes of CO2 equivalent per capita) and Gotland (33.6 tonnes of CO2 equivalent per capita) due to intensive activity in the metal and cement industries, respectively, as well as in several Finnish regions. At the other end of the scale, the…
 2025 April
 - Environment
- Nordic Region
Electricity production 2021
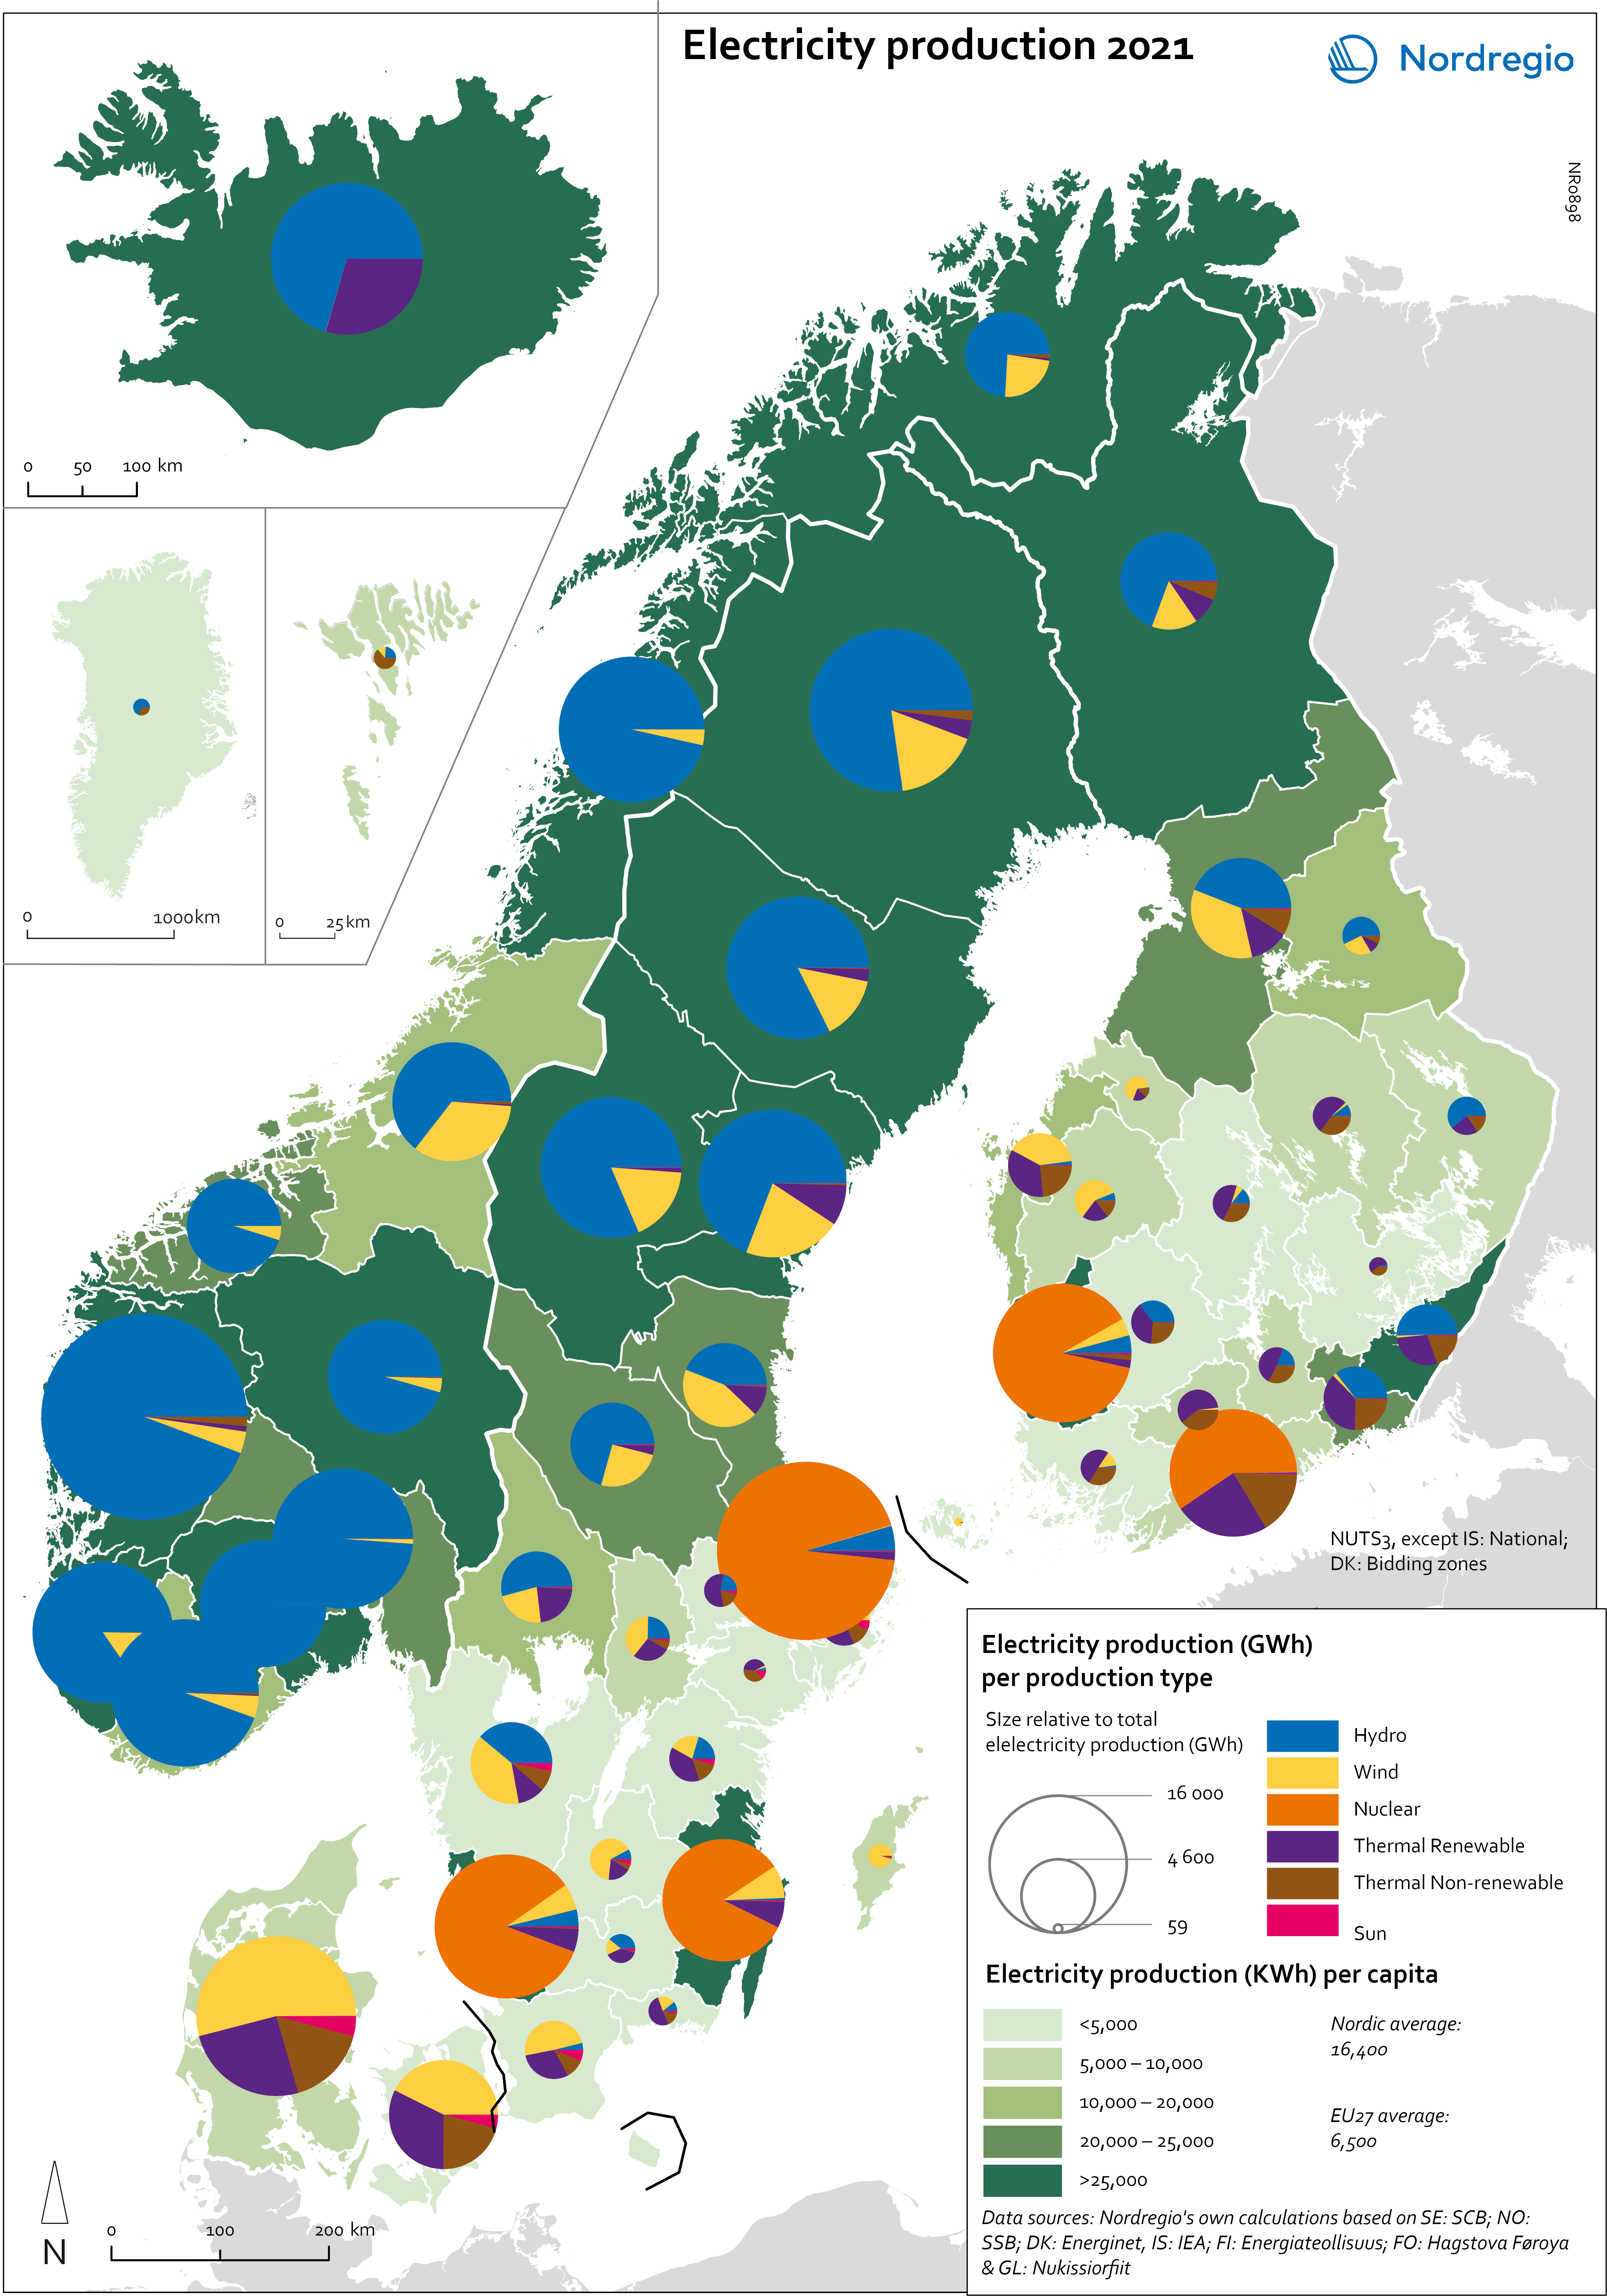
This map shows the spatial distribution of Nordic electricity production per capita, by volume and source type in the Nordic Region in 2021. The data is presented at a regional level, except for Iceland (national level) and Denmark (bidding zones). The circles represent electricity production in GWh, while the green shades indicate electricity production per capita (kWh). Finally, the colour of the circles denotes the source of electricity. The Nordic Region overall has a high electricity production per capita; in fact, Iceland and Norway have the world’s highest electricity production per capita. The electricity mix in 2021 was 96% fossil-free – 73% from renewables (mainly hydropower) and 17% from nuclear power. In 2000 85% of the electricity production was fossile-free. Still there are clear spatial differences in the electricity production. Firstly, we see the high amount of electricity being produced for the five nuclear facilities in Sweden and Finland. Secondly, a substantial volume of hydro-electricity is produced in southern Norway, throughout Iceland, Northern Sweden and Northern Finland. As a result, over half of Nordic electricity is produced from hydropower. Wind power is the source of electricity that has been growing the most during the last two decades, from 1.2% in 2000 to 14% in 2021. The regions with the highest electricity production per capita are in Iceland, Northern Sweden, and Northern and Western Norway. Both Finland and Denmark are net importers of electricity, but both countries have rapidly transitioned away from fossil fuels. Cheap and fossil-free electricity is a prerequisite for the green transition and with growing industries within e.g. battery production, green steel and mining, the need for fossil-free electricity is expected to increase in the coming decades.
- 2025 April
- Environment
- Labour force
- Nordic Region
Greenhouse gas emissions intensity of employment in 2022
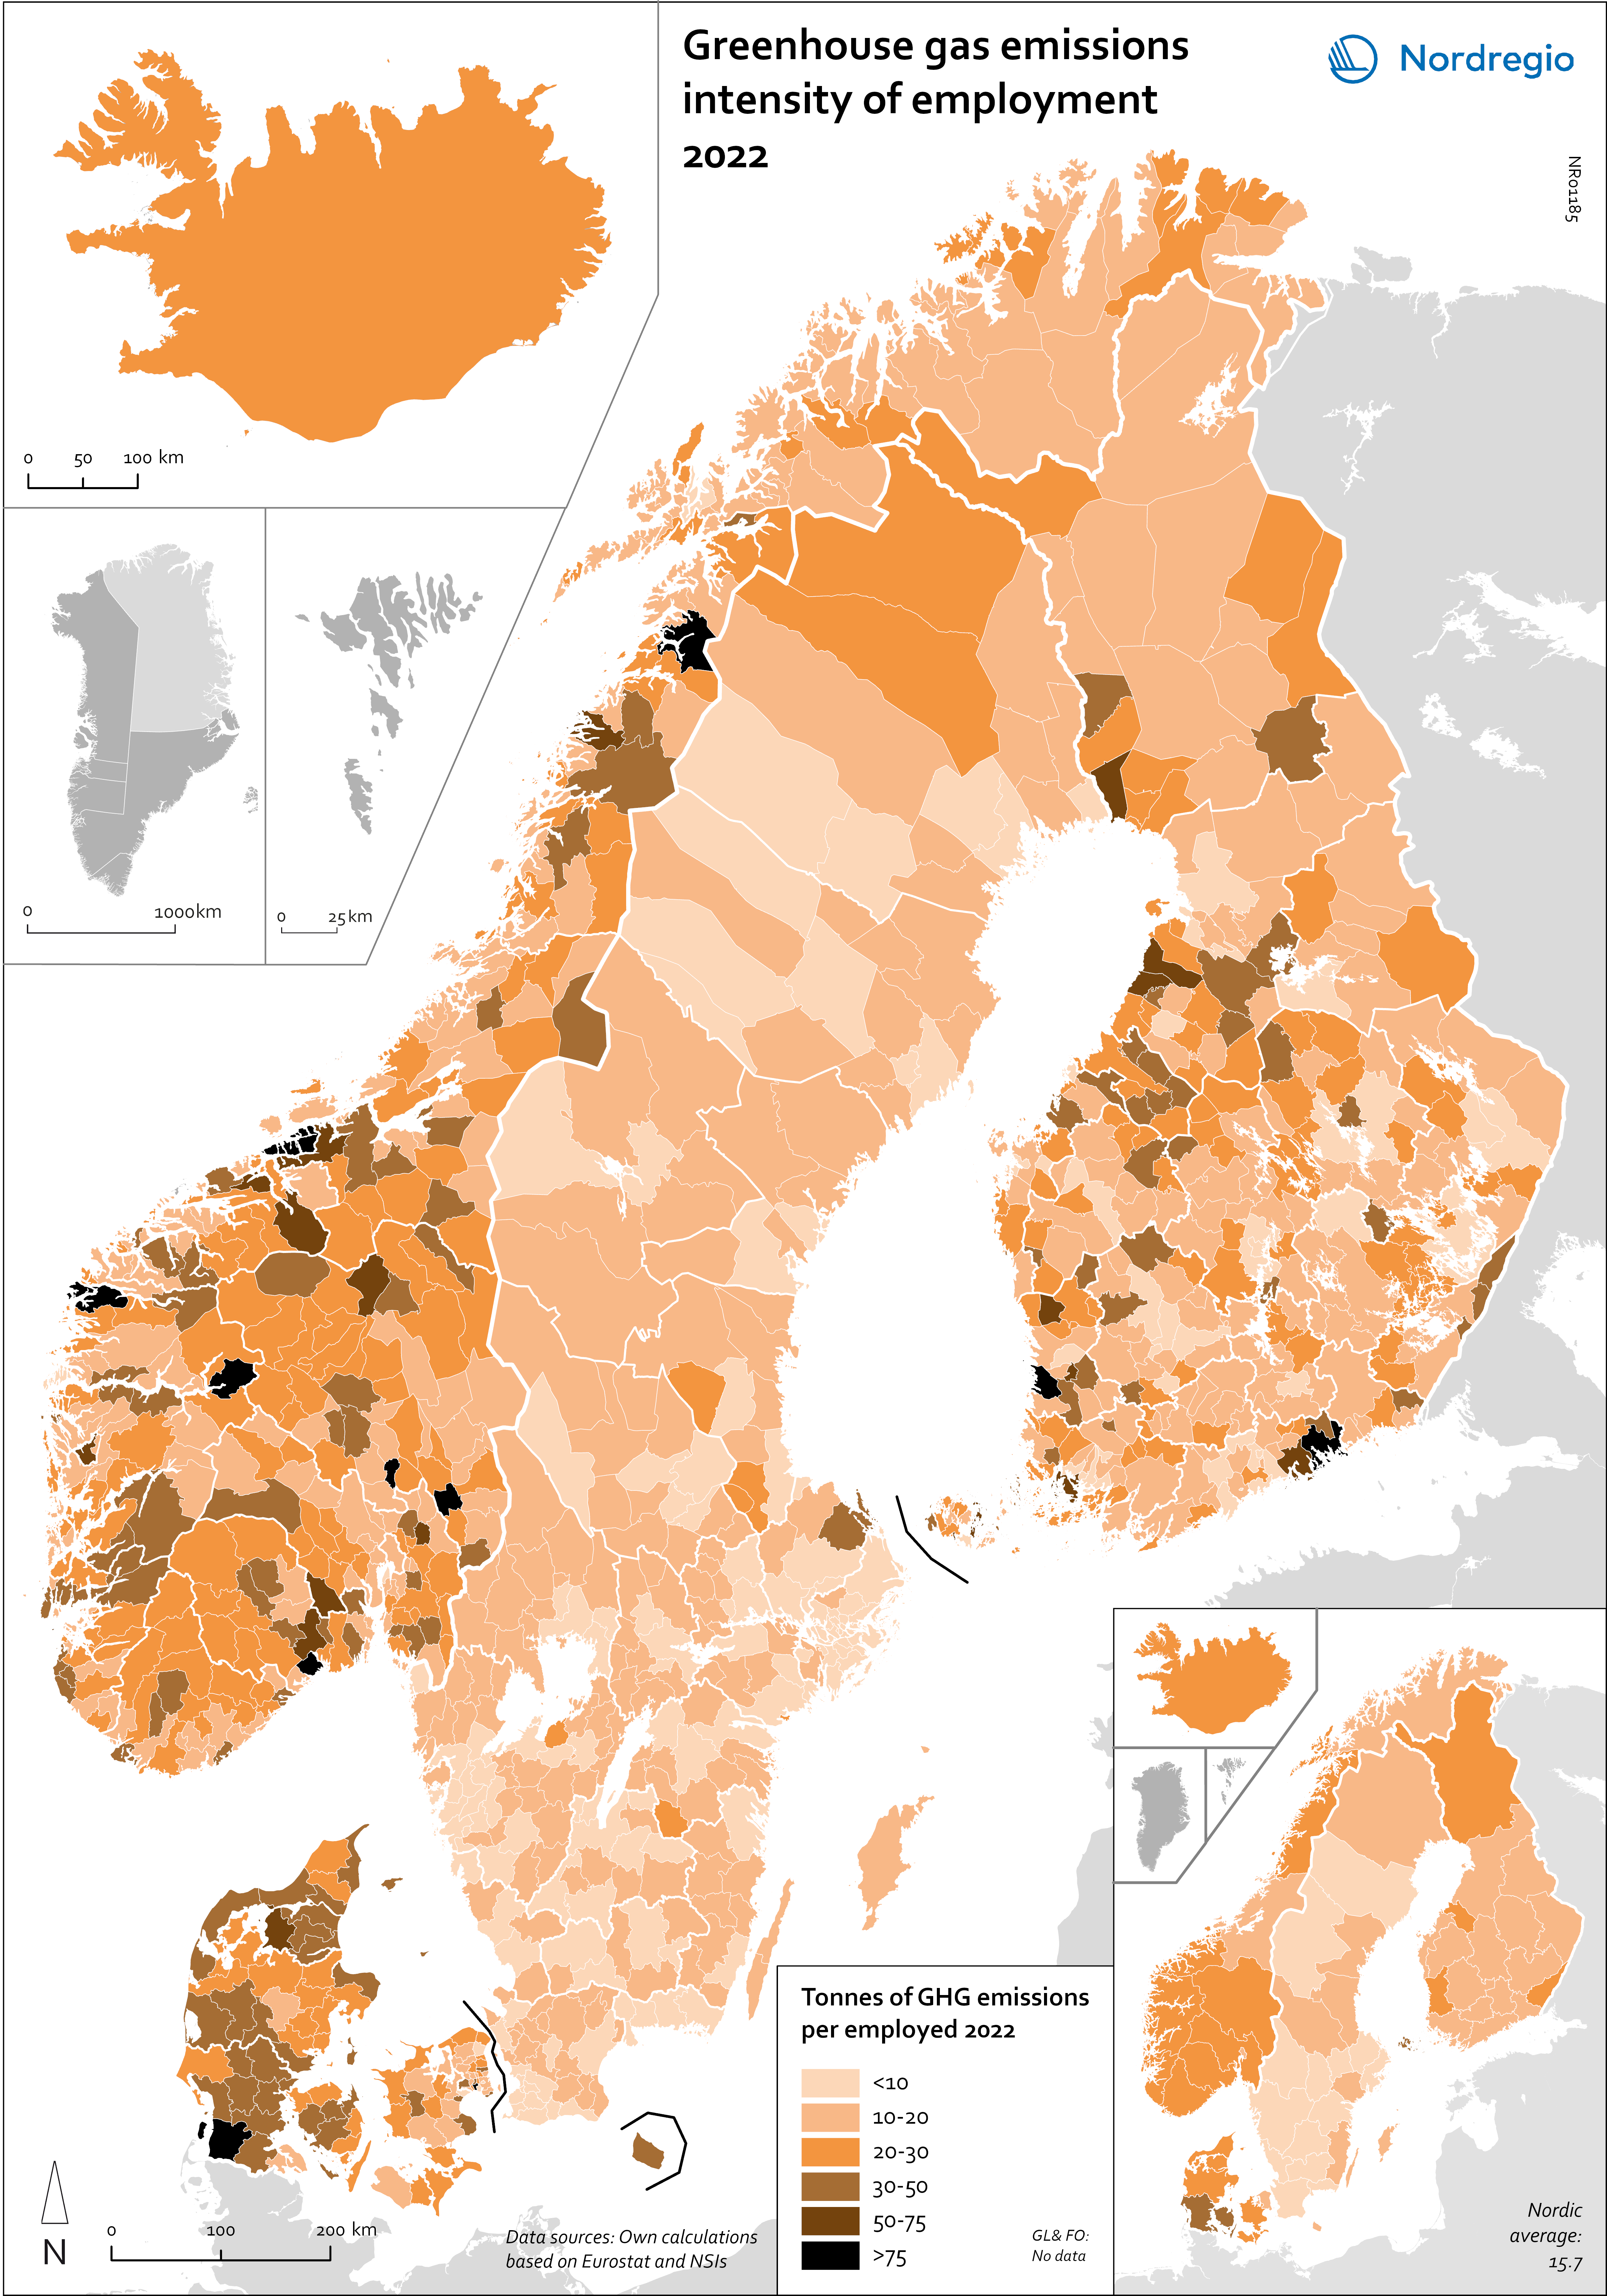
This map shows the tonnes of greenhouse gas emissions per person employed in Nordic municipalities (big map) and regions (small map) in 2022. The data for Iceland is presented at the national level, while no data was available for the Faroe Islands and Greenland. The map is based on data on emissions per sector and country from Eurostat and detailed employment by sector data from the Nordic statistical offices. By calculating the average emissions per person employed and per sector we could use municipal employment by sector data to assess the average emissions per person employed in each municipality. The results are an estimation based on the assumption that all jobs in the same sector have the same GHG emissions. In 2022, greenhouse gas (GHG) emissions per person employed in the Nordic Region were 15.7 tonnes. This is higher than the EU average of 13.5 tonnes. There are also fairly big differences between the Nordic countries, with higher emissions per person employed in Iceland (28.6), Denmark (23.1) and Norway (20.5) and lower emissions in Finland (15.7) and Sweden (8). On the other hand, the emissions per person employed have decreased faster in the Nordic Region than for the EU as a whole. In the last decade, emissions per person employed fell by 24% in the Nordic Region compared to the EU average of 22%. The biggest decrease (32%) was in Finland. The sectors with the highest emissions per worker vary slightly between the countries. In Sweden and Norway, the sector with by far the highest emissions per worker was the manufacture of petroleum coke and refined petroleum products. However, it should be noted that the number of workers in this sector is small. In Denmark, the highest emissions by person employed could be found in water transport; in Finland, in…
- 2025 April
- Environment
- Labour force
- Nordic Region
Algae production in 2019
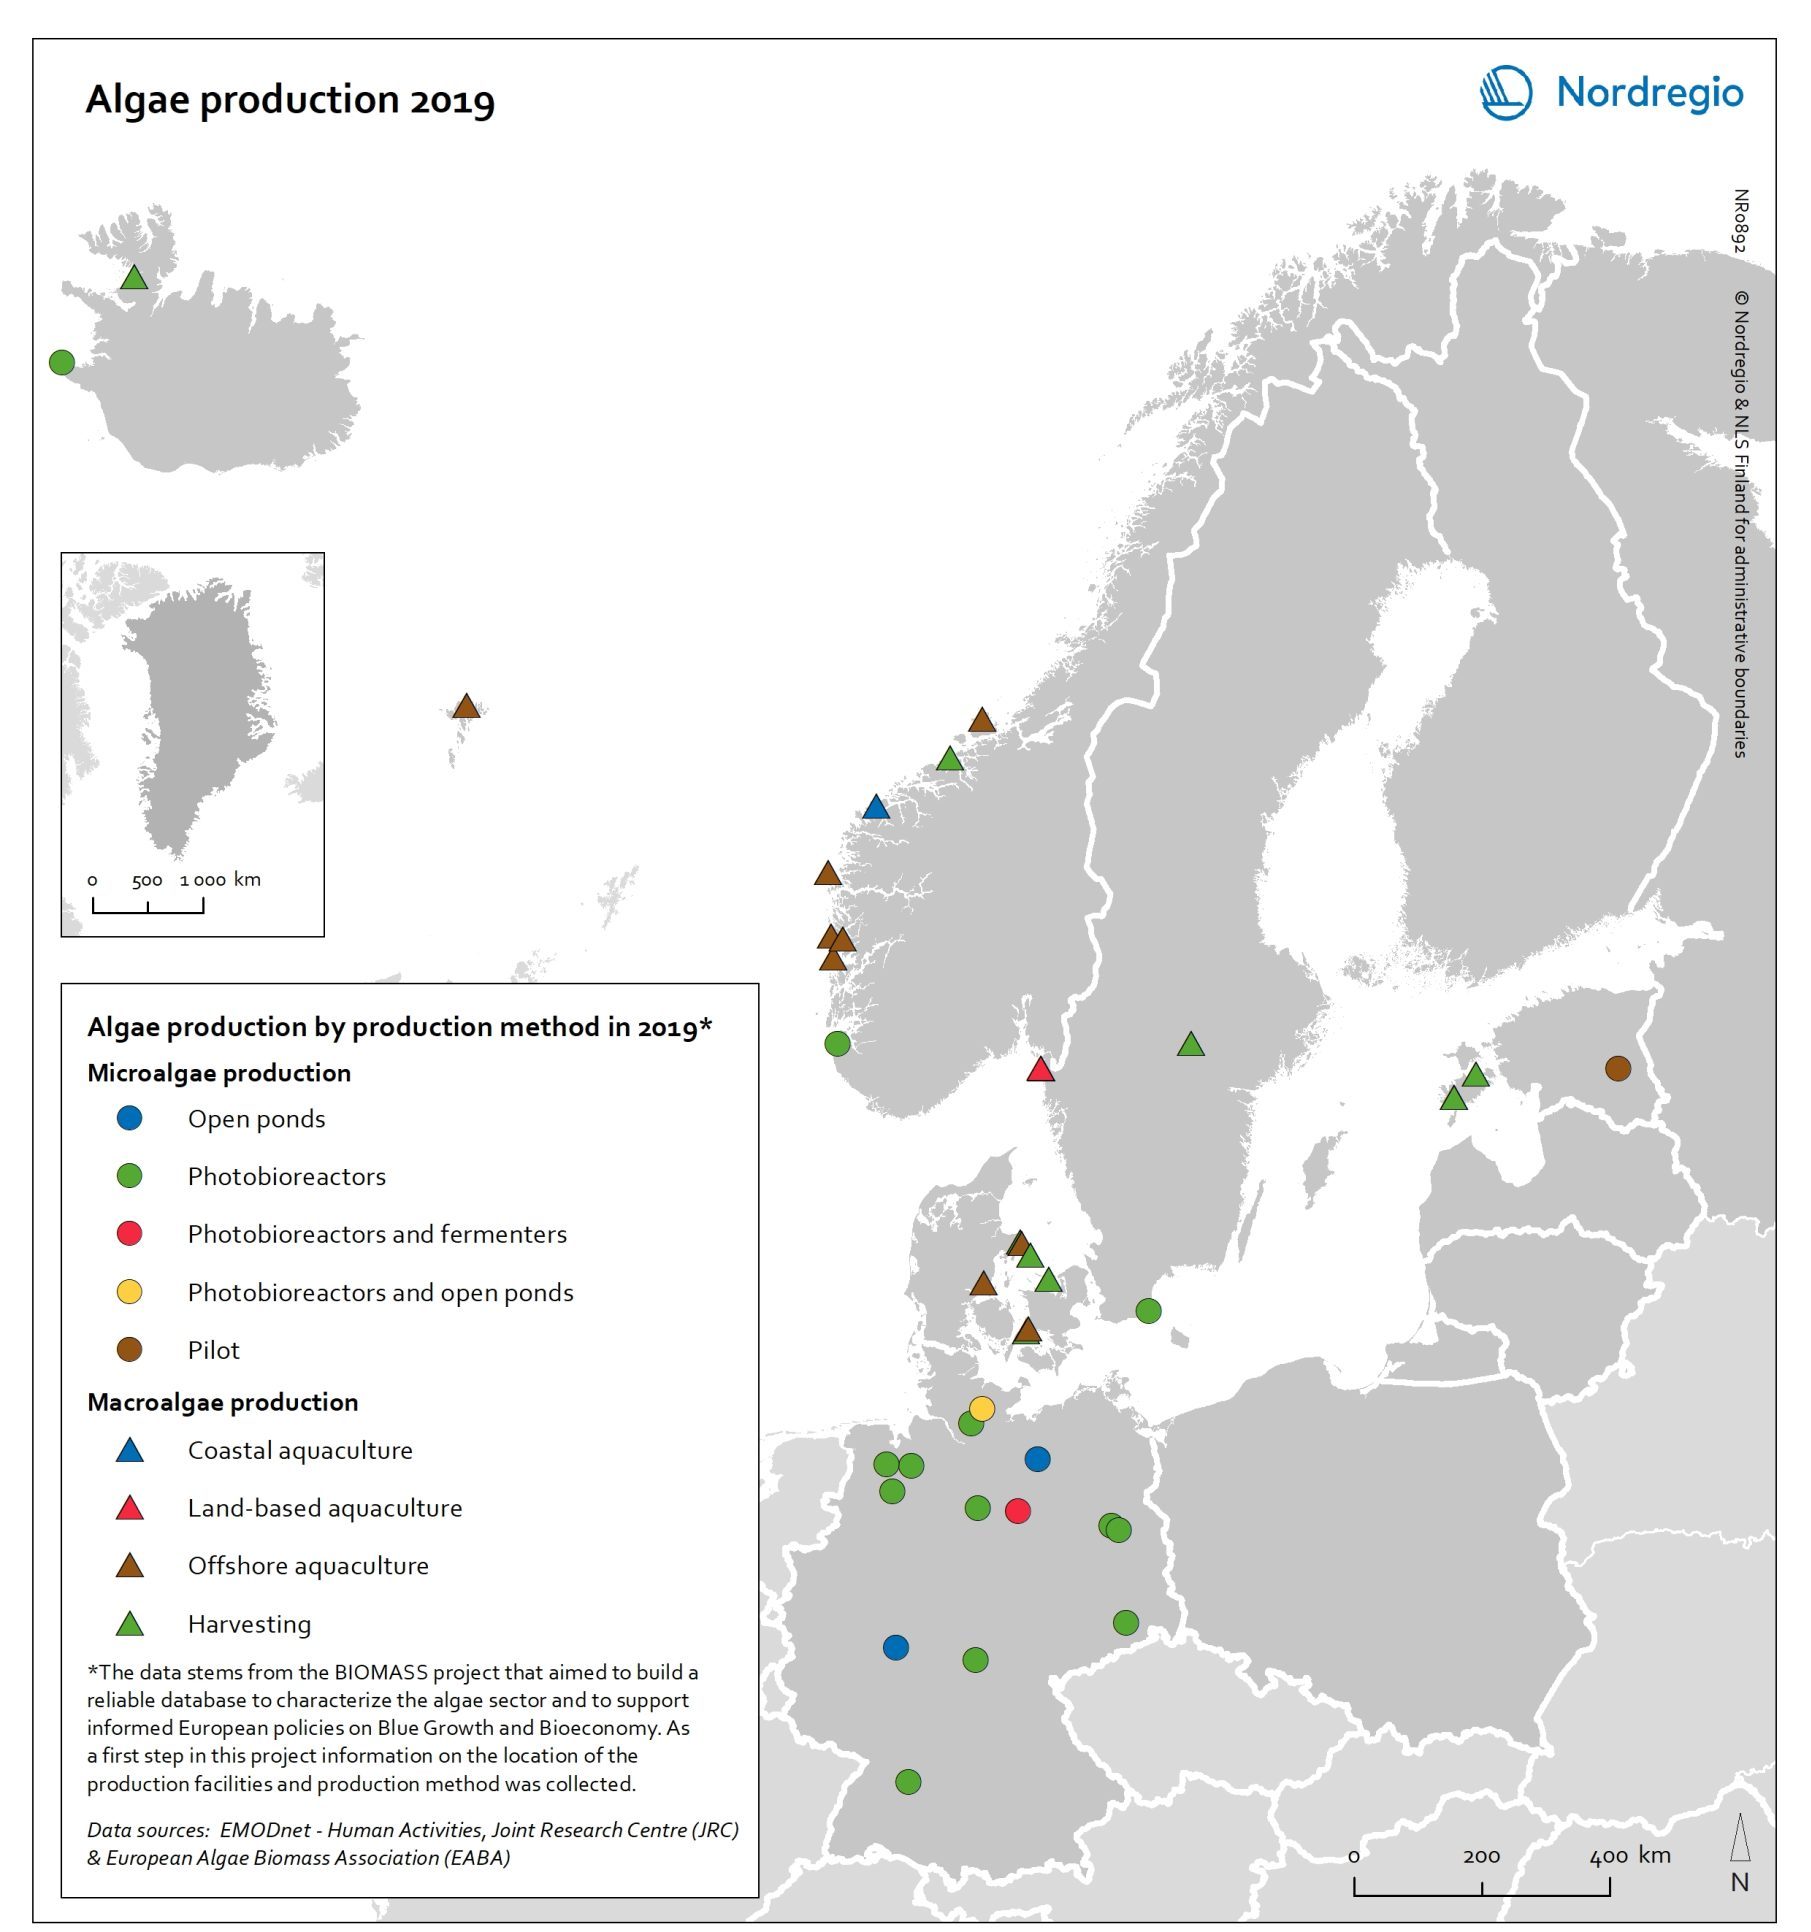
This map shows location of algae production by production method in the Nordic Arctic and Baltic Sea Region in 2019 Algae and seaweeds are gaining attention as useful inputs for industries as diverse as energy and human food production. Aquatic vegetation – both in the seas and in freshwater – can grow at several times the pace of terrestrial plants, and the high natural oil content of some algae makes them ideal for producing a variety of products, from cosmetic oils to biofuels. At the same time, algae farming has added value in potential synergies with farming on land, as algae farms utilise nutrient run-off and reduce eutrophication. In addition, aquatic vegetation is a highly versatile feedstock. Algae and seaweed thrive in challenging and varied conditions and can be transformed into products ranging from fuel, feeds, fertiliser, and chemicals, to third-generation sugar and biomass. These benefits are the basis for seaweed and algae emerging as one of the most important bioeconomy trends in the Nordic Arctic and Baltic Sea region. The production of algae for food and industrial uses has hence significant potential, particularly in terms of environmental impact, but it is still at an early stage. The production of algae (both micro- and macroalgae) can take numerous forms, as shown by this map. At least nine different production methods were identified in the region covered in this analysis. A total of 41 production sites were operating in Denmark, Estonia, the Faroe Islands, Iceland, Norway, Germany, and Sweden. Germany has by far the most sites for microalgae production, whereas Denmark and Norway have the most macroalgae sites.
- 2021 December
- Arctic
- Baltic Sea Region
- Nordic Region
- Others
Change in share of biofuels in transport from 2010 to 2018
This map shows change in share of biofuels in final energy consumption in transport in the Nordic Arctic and Baltic Sea Region from 2010 to 2018. Even though a target for greater use of biofuels has been EU policy since the Renewable Energy and Fuel Quality Directives of 2009, development has been slow. The darker shades of blue on the map represent higher increase, and the lighter shades of blue reflect lower increase. The lilac color represent decrease. The Baltic Sea represents a divide in the region, with countries to the north and west experiencing growth in the use of biofuels for transport in recent years. Sweden stands out (16 per cent growth), while the other Nordic countries has experienced more modest increase. In the southern and eastern parts of the region, the use of biofuels for transport has largely stagnated. Total biofuel consumption for transport has risen more than the figure indicates due to an increase in transport use over the period.
- 2021 December
- Arctic
- Baltic Sea Region
- Nordic Region
- Transport
Share of biofuels in transport in 2018
This map shows the share of biofuels in final energy consumption in transport in the Nordic Arctic and Baltic Sea Region in 2018. There has been considerable political support for biofuels and in the EU, this debate has been driven by the aim of reducing dependency on imported fuels. For instance, 10 per cent of transport fuel should be produced from renewable sources. The darker shades on the map represent higher proportions, and the lighter shades reflect lower proportions. As presented by the map, only Sweden (20.7%) had reached the 10 per cent target in the Nordic Arctic and Baltic Region in 2018. Both Finland (8.3%) and Norway (8.3%) were close by the target, while the other countries in the region were still lagging behind, particularly the Baltic countries.
- 2021 December
- Arctic
- Baltic Sea Region
- Nordic Region
- Transport
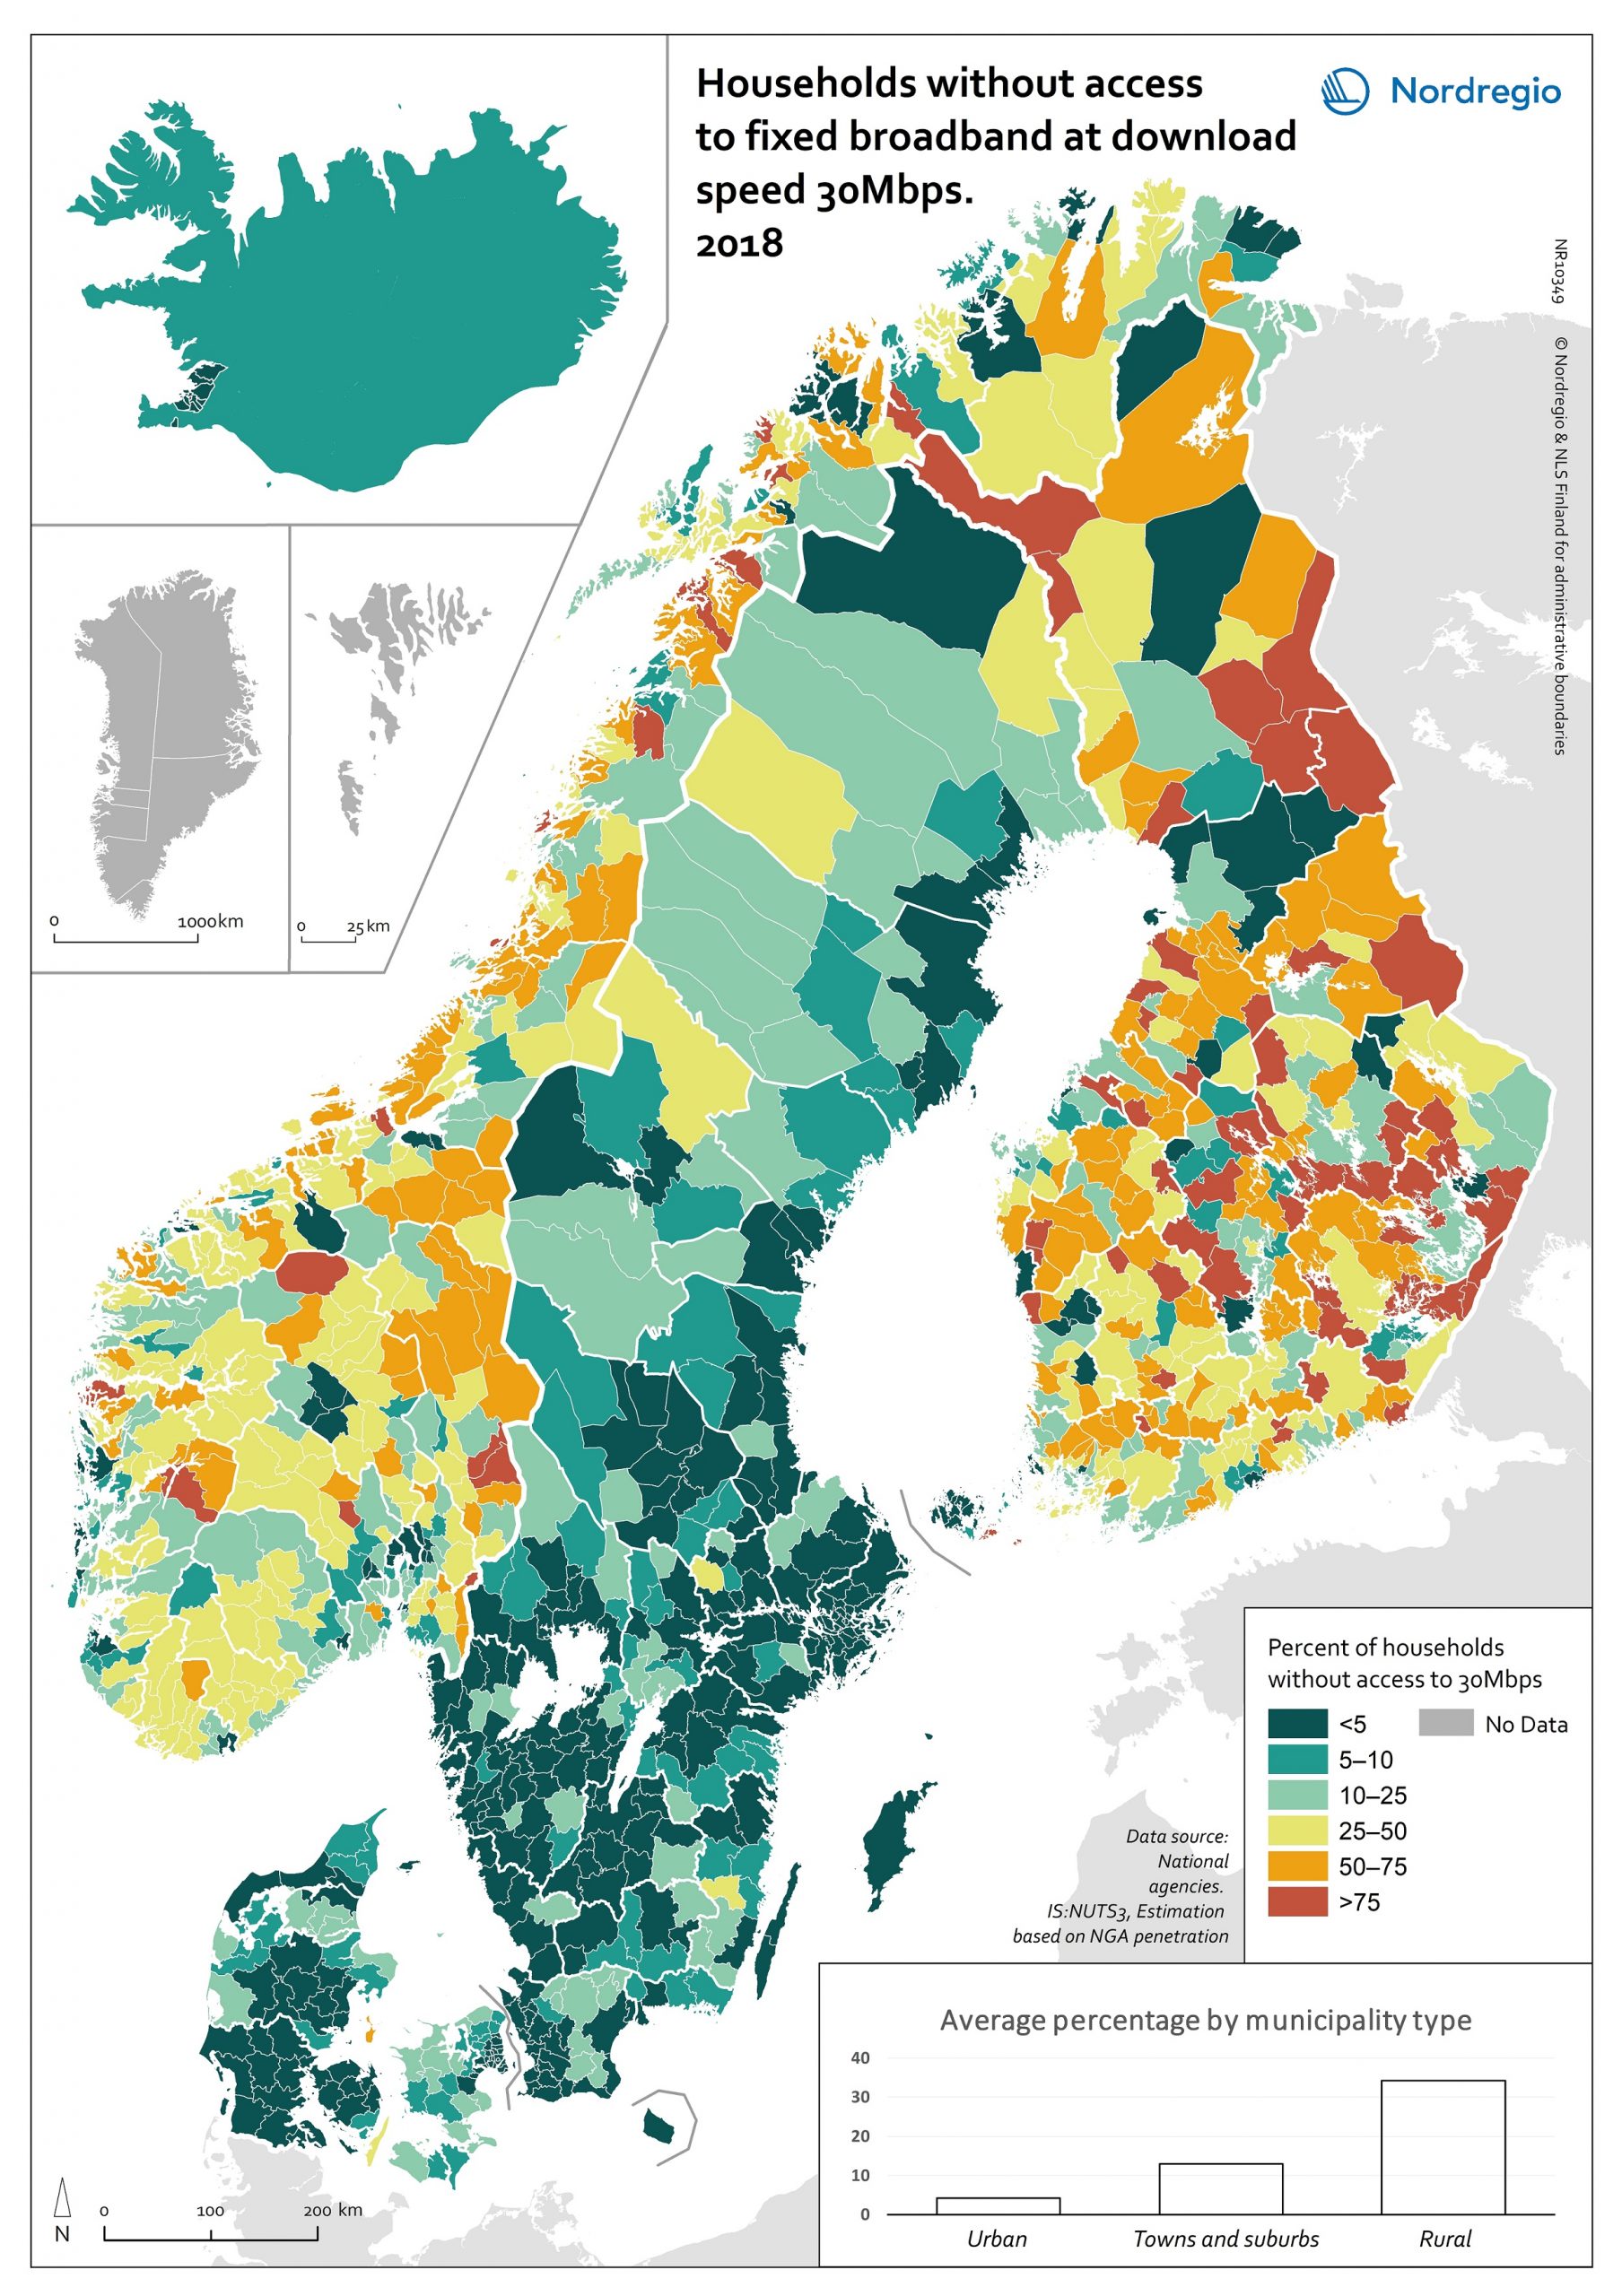
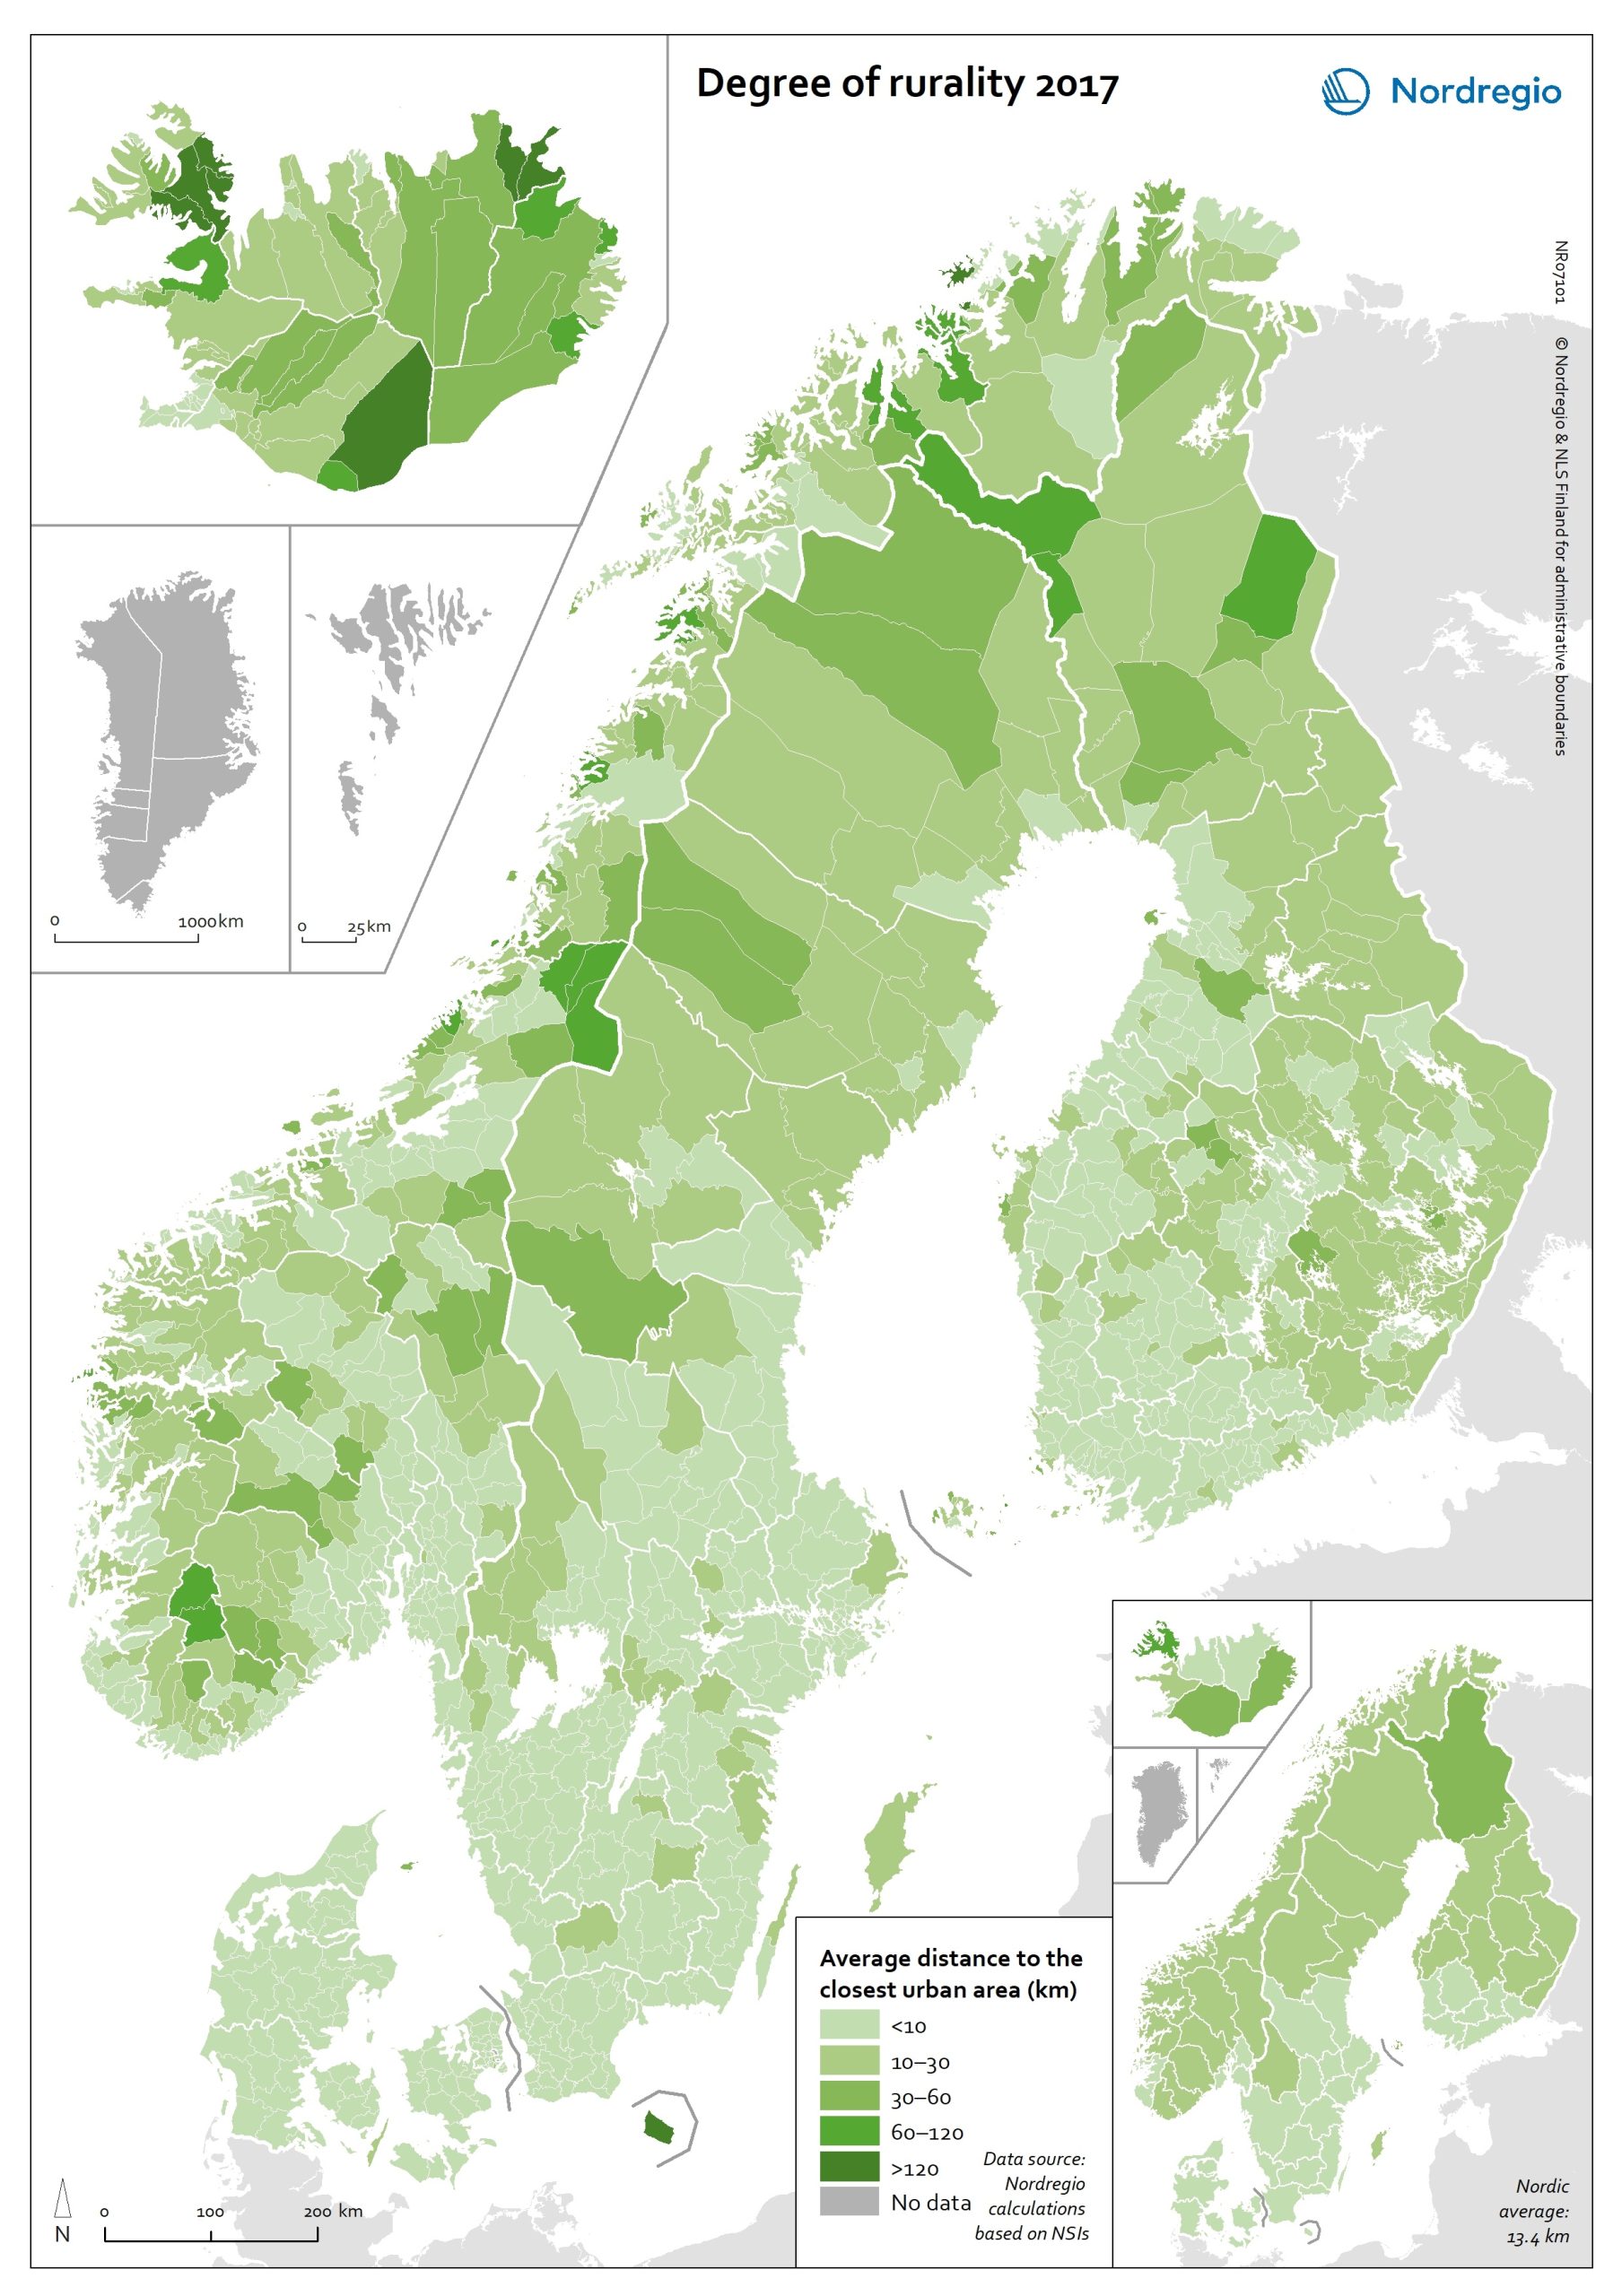
Degree of rurality at the municipal and regional level in 2017
This map shows the average distance to the edge of the closest urban area for the population living outside urban areas in the Nordic municipalities and regions. These figures are of particular interest in the analysis of urban-rural patterns and the Nordic populations’ access to local services in sparsely population areas. The darker shades on the map indicate longer average distances to the edge of the nearest urban area, and the lighter shades indicate shorter average distances. While almost all Danish municipalities have an average distance of below 10 km from rural grid cells to the nearest urban area, a large share of the municipal populations of the remaining Nordic countries need to contend with longer average distances to local services. The largest distances can be found in several municipalities of Iceland and Norway (Árneshreppur 230 km, Hasvik 154 km), whereas the largest average distances for Finnish and Swedish municipalities are considerably shorter (Enontekiö 103 km, Storuman 52 km). Regarding within-country variation, shorter average distances can generally be found in southwestern Finland and southern Sweden, in comparison with the more remote parts of these countries. Both Norway and Iceland provide a rather more mixed picture, since there are municipalities with shorter average distances scattered across different parts of each country. Method used to calculate the degree of rurality In order to take into account access to services such as grocery stores, pharmacies, schools, community centres and public transport, the European definition of urban grid cells was used to create this map, i.e. a population density threshold of 300 inhabitants per km2 applied to grid cells of 1 km2. The closest distance was calculated from each rural grid cell centroid to the nearest urban grid cell centroid along the existing road network traversable by car, including car ferries, based on population…
- 2020 October
- Environment
- Nordic Region
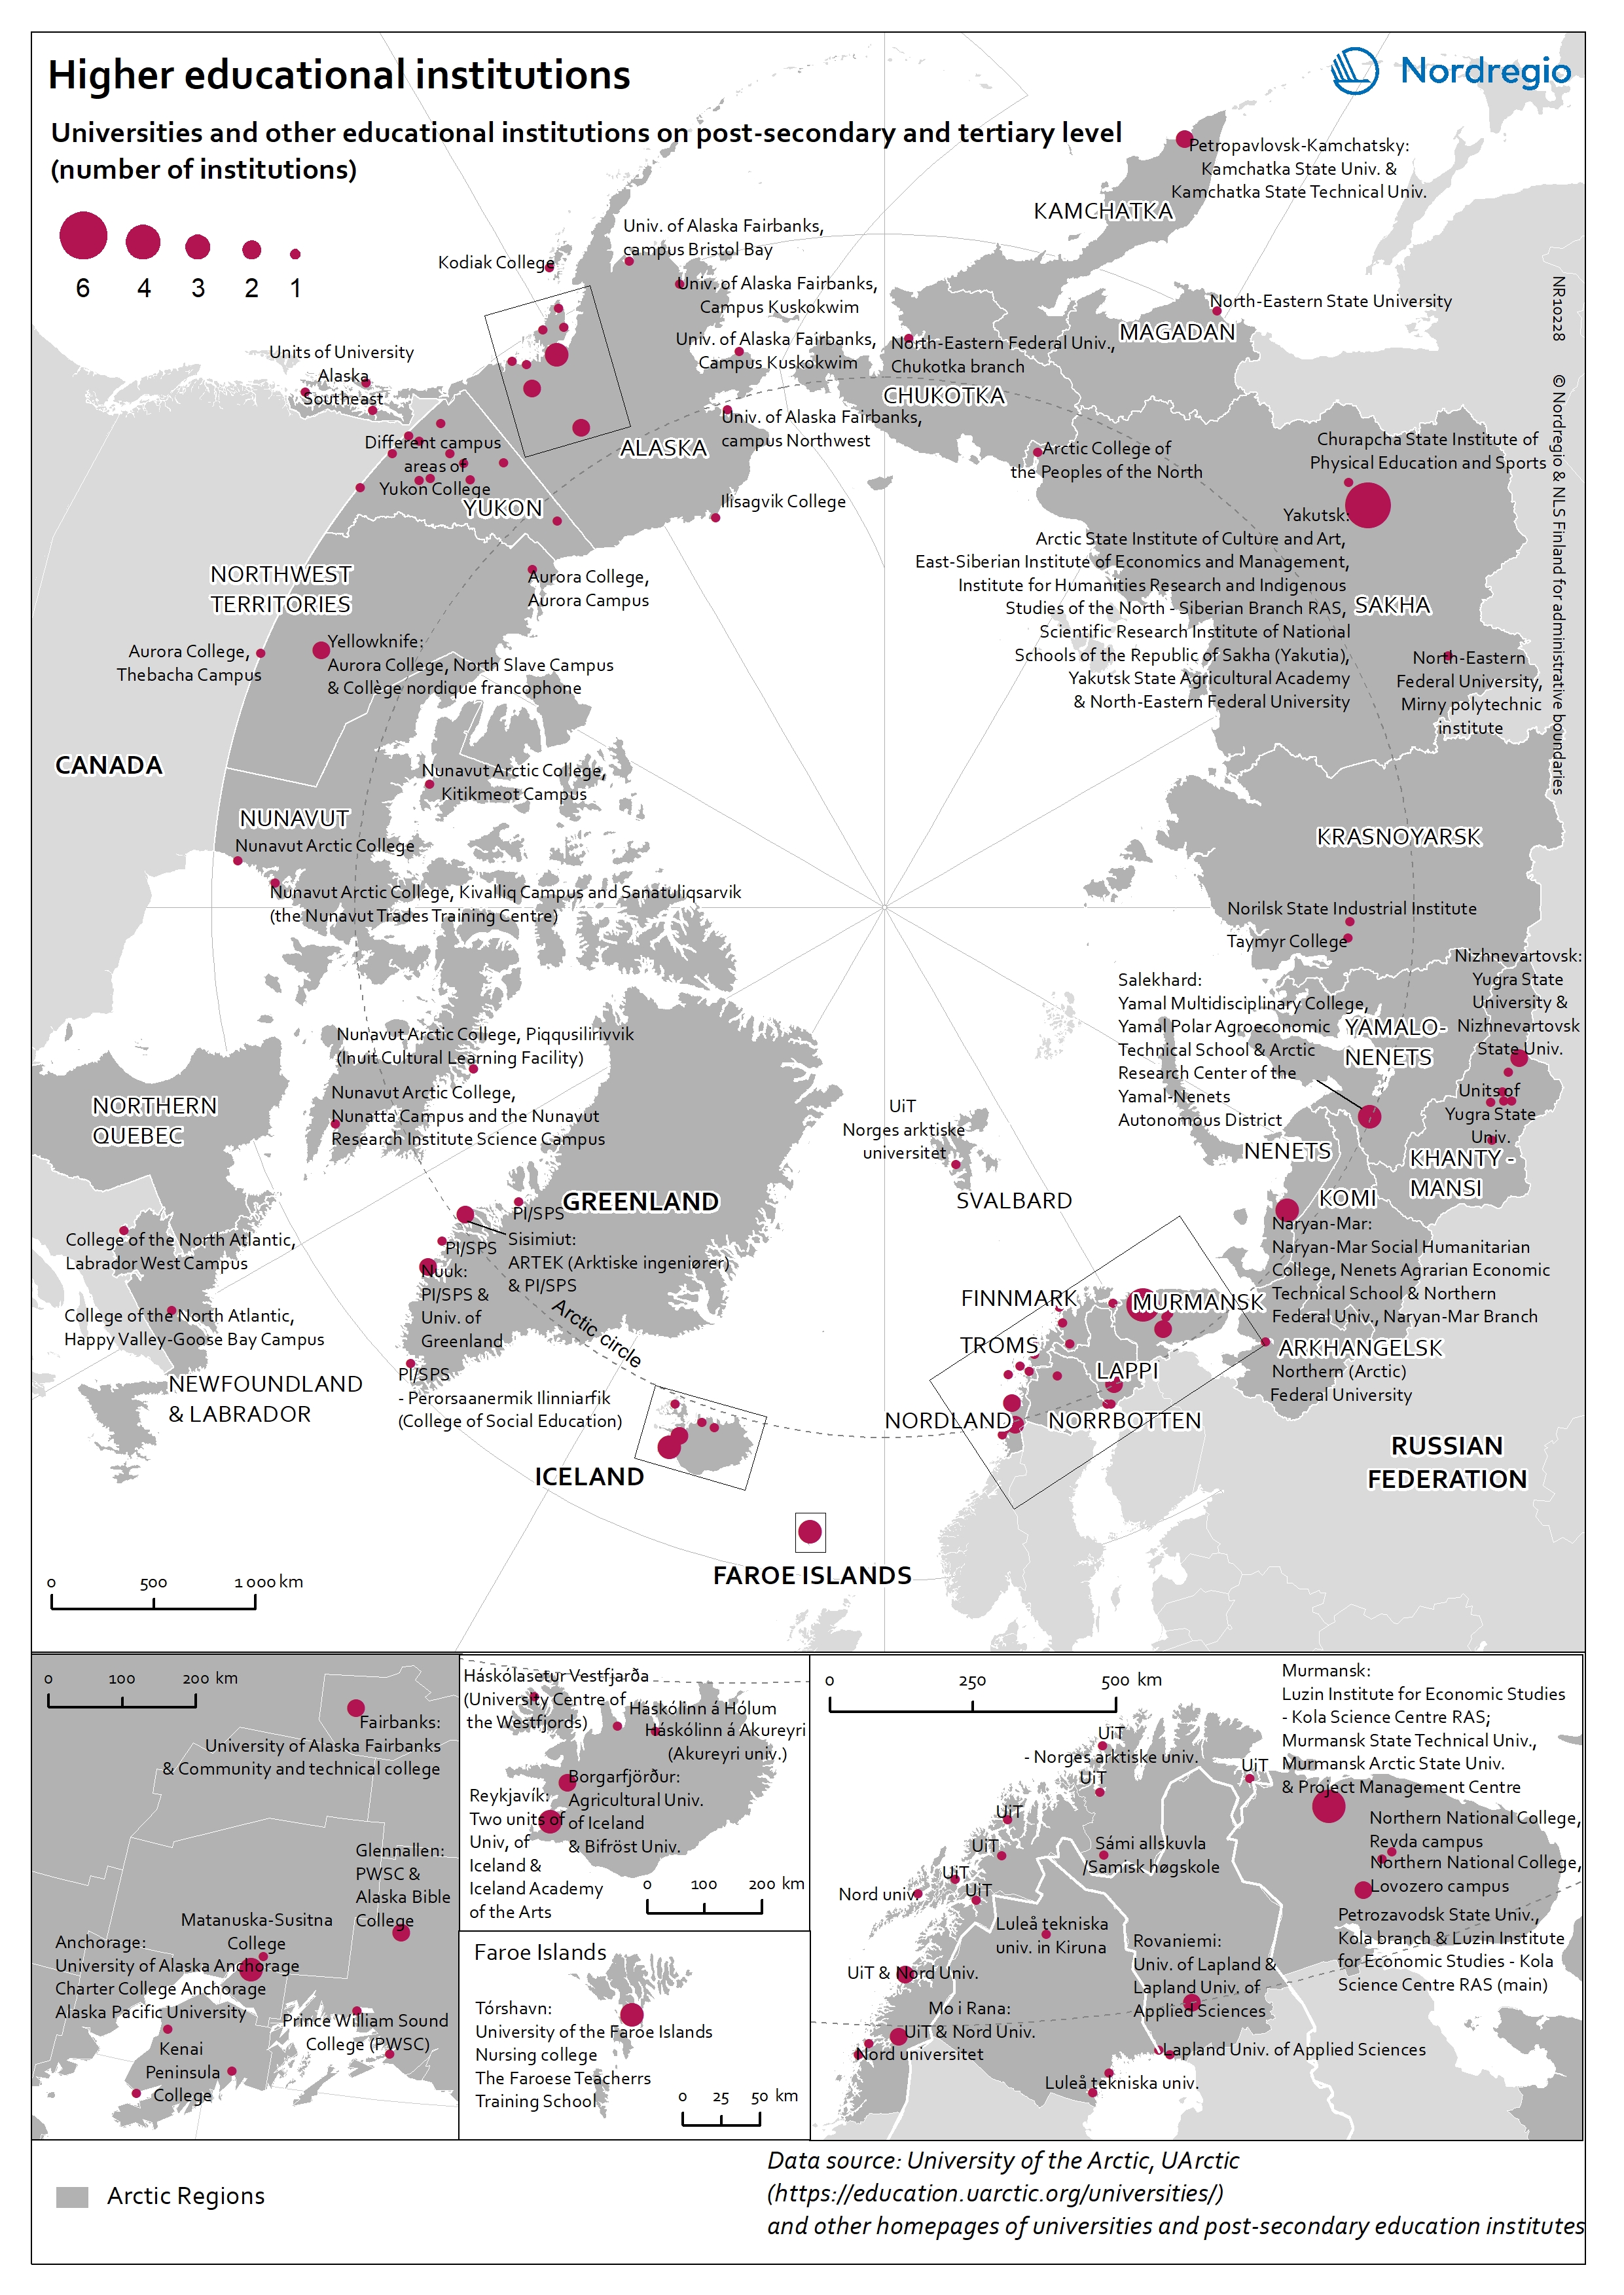
Higher educational institutions in the Arctic
The map shows universities and other educational institutions on post-secondary and tertiary level located in the Arctic. The red circles indicate a location of a university, college, or campus areas within the Arctic. The size of the circle corresponds to the number of educational institutions in a specific location. There is a high density of educational education institutions around Anchorage (Alaska), in Iceland, the Faroe Islands and the Arctic Fennoscandia (see zoom-in maps). In the Yukon (Canada), the Yukon College is the main educational institution, which has several campus areas across the region. In the Russian Arctic the largest centres with higher educational institutions are in Murmansk, Naryan-Mar (Nenets), Nizhnevartovsk (Khanty-Mansi), Salekhard (Yamalo-Nenets), and Yakutsk (Sakha).
- 2019 March
- Arctic
- Others
- Research and innovation
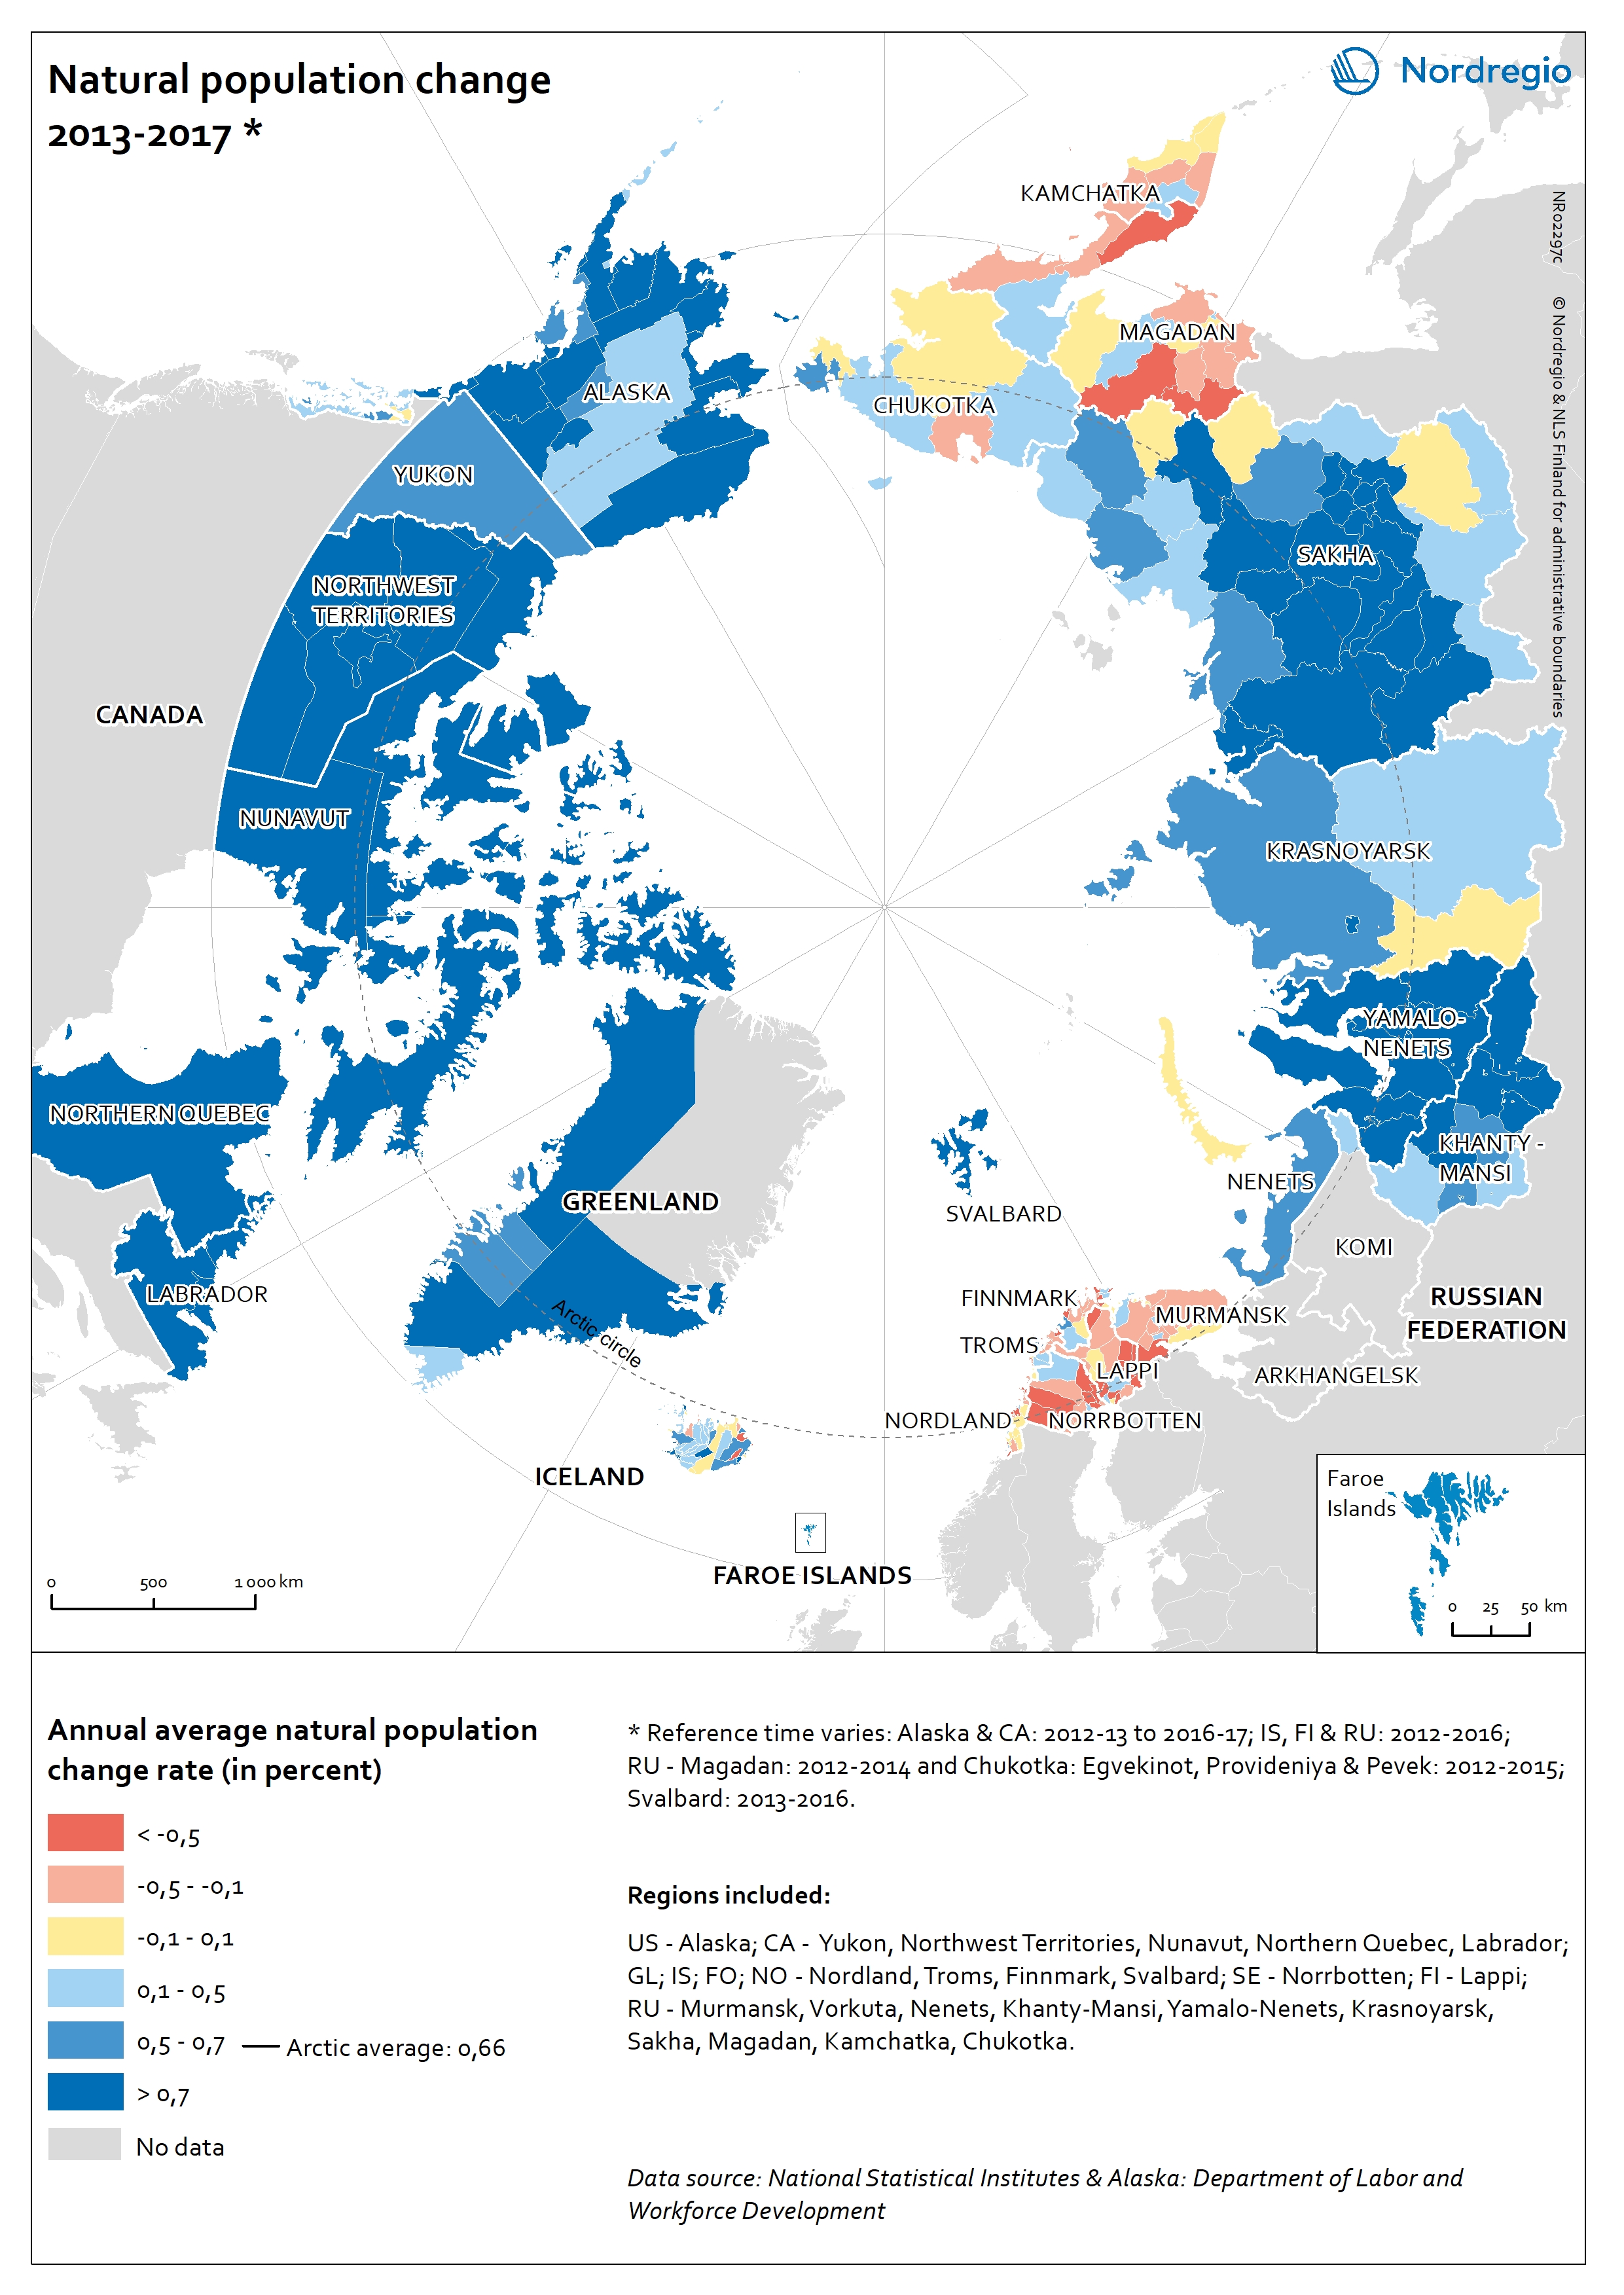
Natural population change in the Arctic
The map shows the annual natural population change rates in the Arctic subregions between 2013 and 2017. The blue tones indicate a positive change: subregions where the number of live births exceeds the number of deaths. The yellow colour indicates no or little change: subregions where the difference between births and deaths are close to zero. The red tones indicate negative change: subregions where the number of deaths exceed the number of live births. In the Artic the annual average natural population change rate was 0,66% between 2013 and 2017. The natural population change was positive especially in the Canadian Arctic, Alaska (USA), Greenland as well as in Yamalo-Nenets, Khanty-Mansi and in Sakha regions (Russian Federation). Natural population decline was the strongest in the Nordic Arctic, as well as in Murmansk, Magadan, and Kamchatka (Russian Federation).
- 2019 March
- Arctic
- Demography
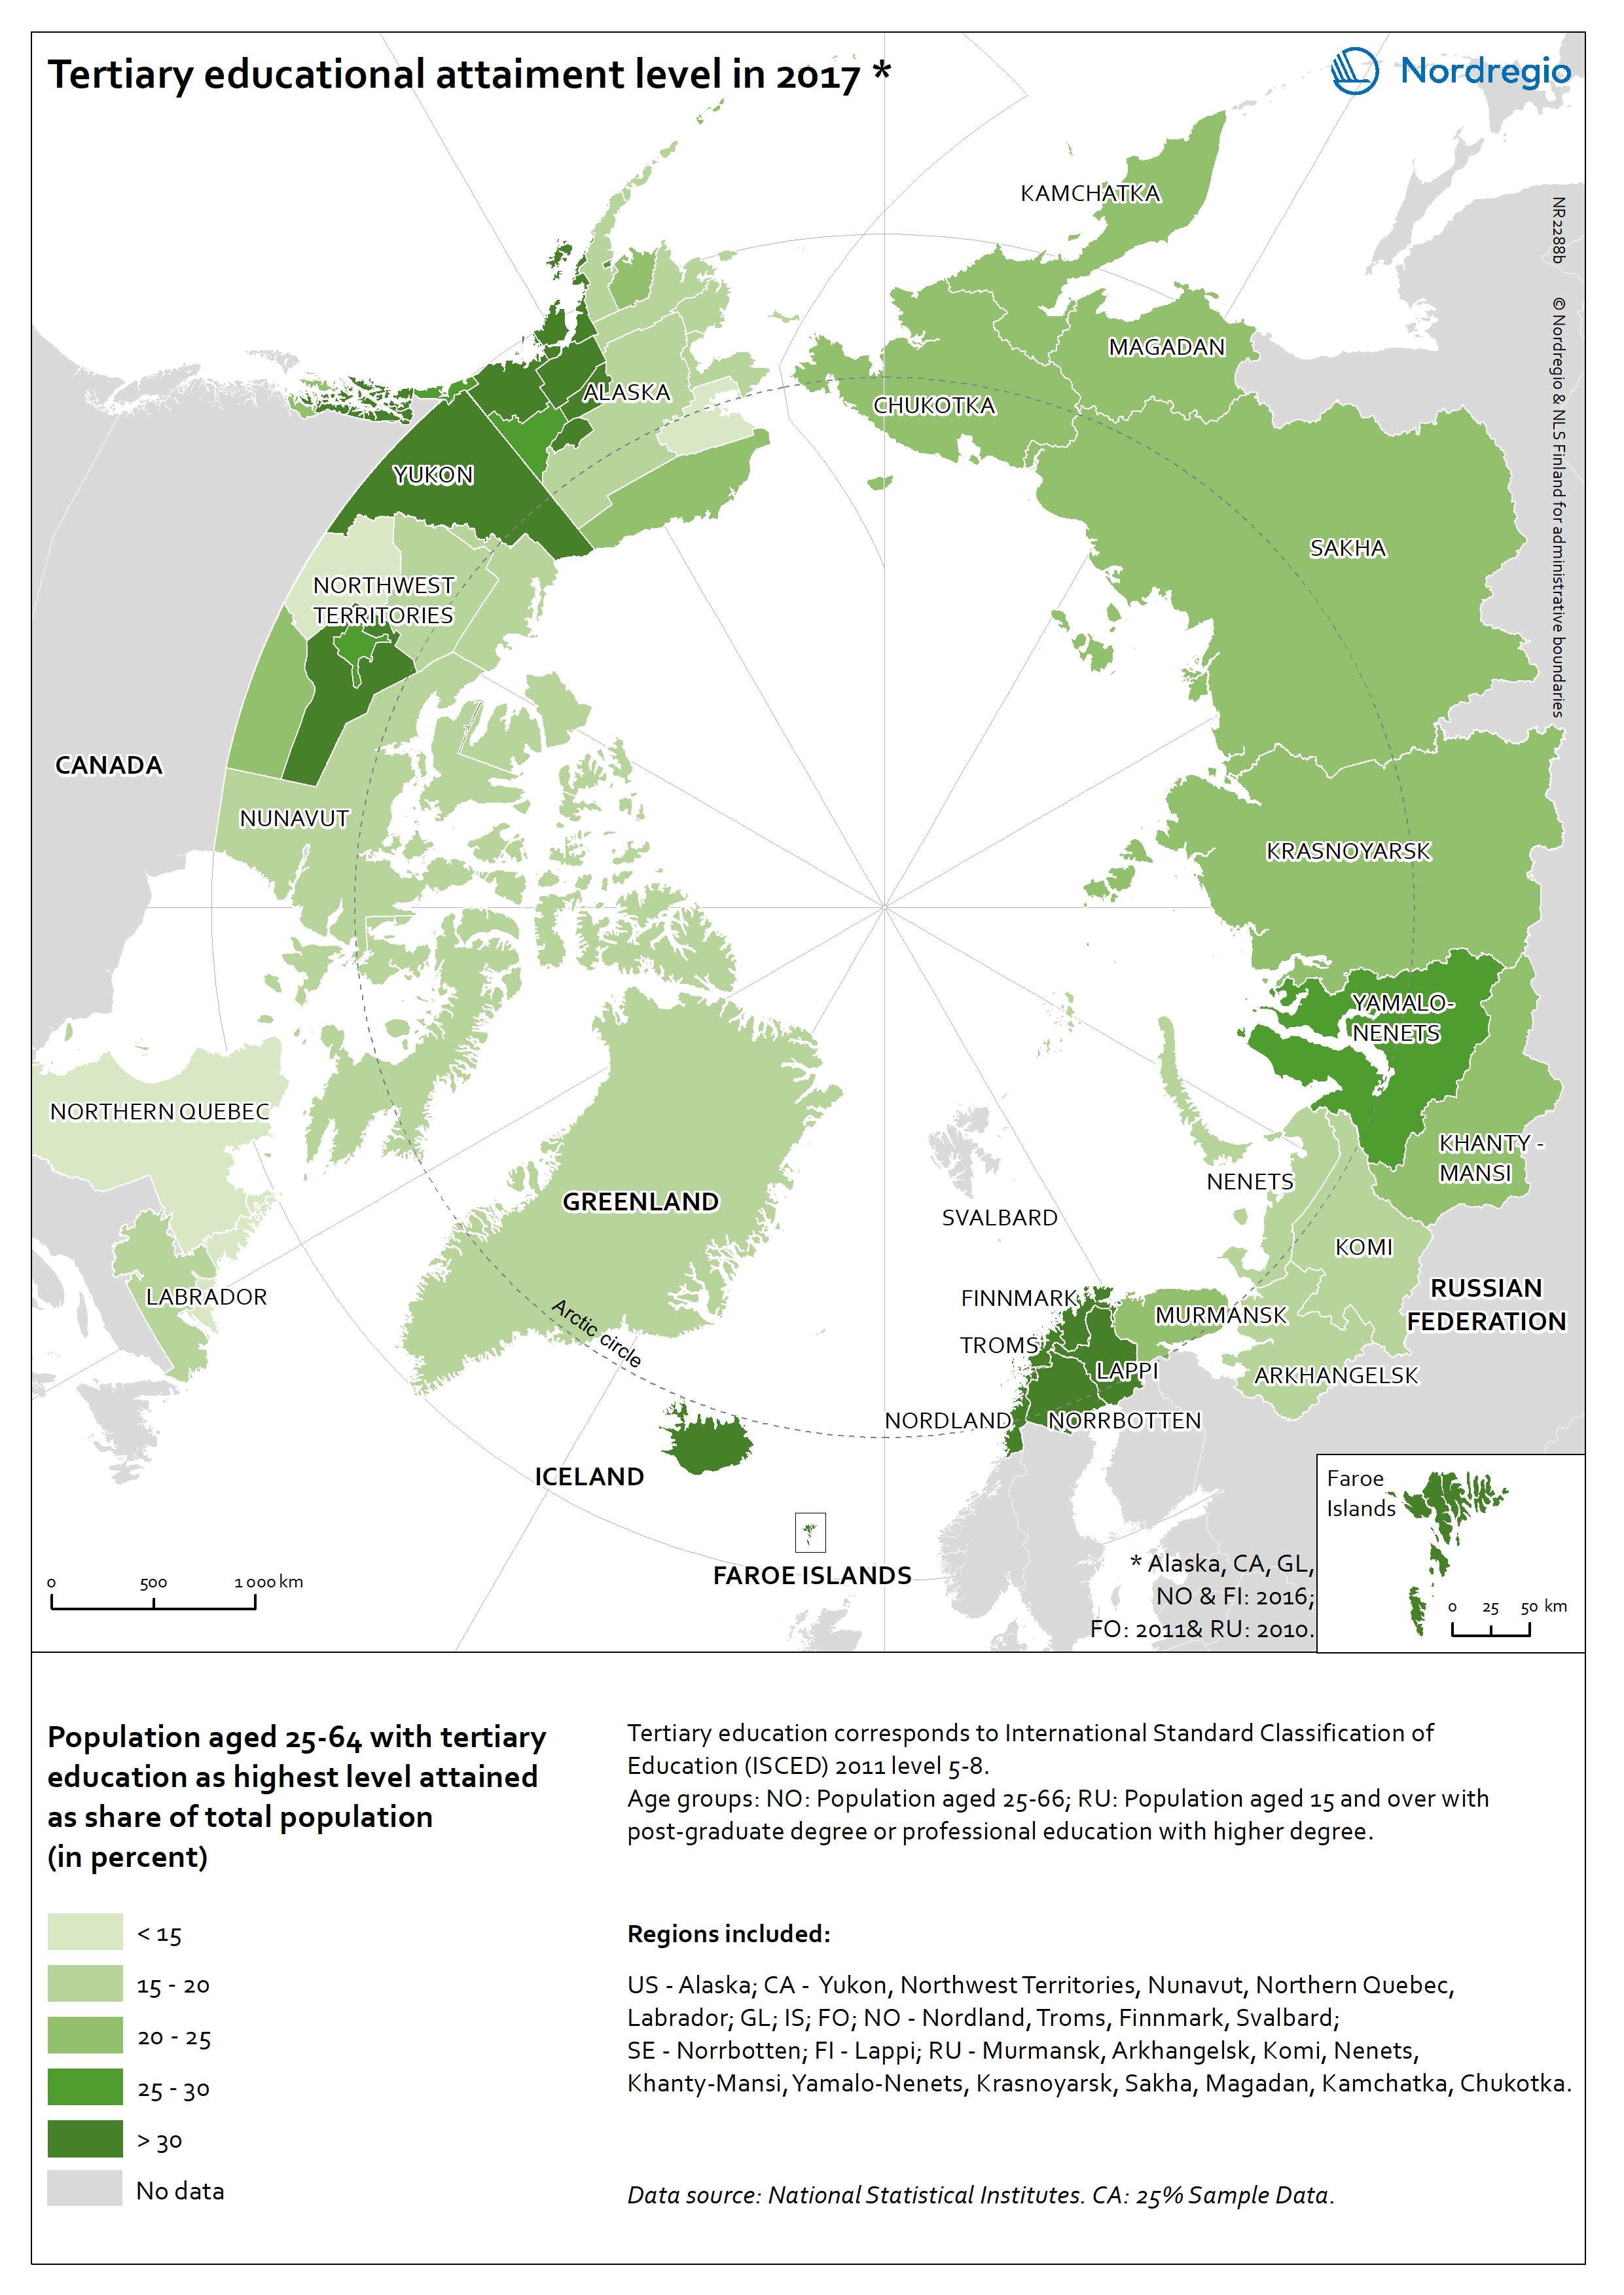
Tertiary educational attainment level in the Arctic
The map shows the percent of individuals aged 25-64 with tertiary education as the highest attainment level in the Arctic regions in 2017. Tertiary education corresponds to International Standard Classification of Education (ISCED) 2011 levels 5-8, which represent bachelor or equivalent and all higher attainment levels. The dark green tones show regions where more than 30% of individuals attained tertiary education as highest level. The light green tones show regions where less than 15% of individuals attained tertiary education as highest level. Highest shares of working aged population with tertiary education were found in Troms (Norway, 43,8%) and Iceland (42,5%). All other Nordic Arctic regions as well as Yukon (Canada, 33,3%) and in some regions in Alaska (USA) had high shares of highly educated people. Northern Quebec (Canada) had the lowest share of working aged population that attained tertiary education (13,0%).
- 2019 March
- Arctic
- Demography
- Economy
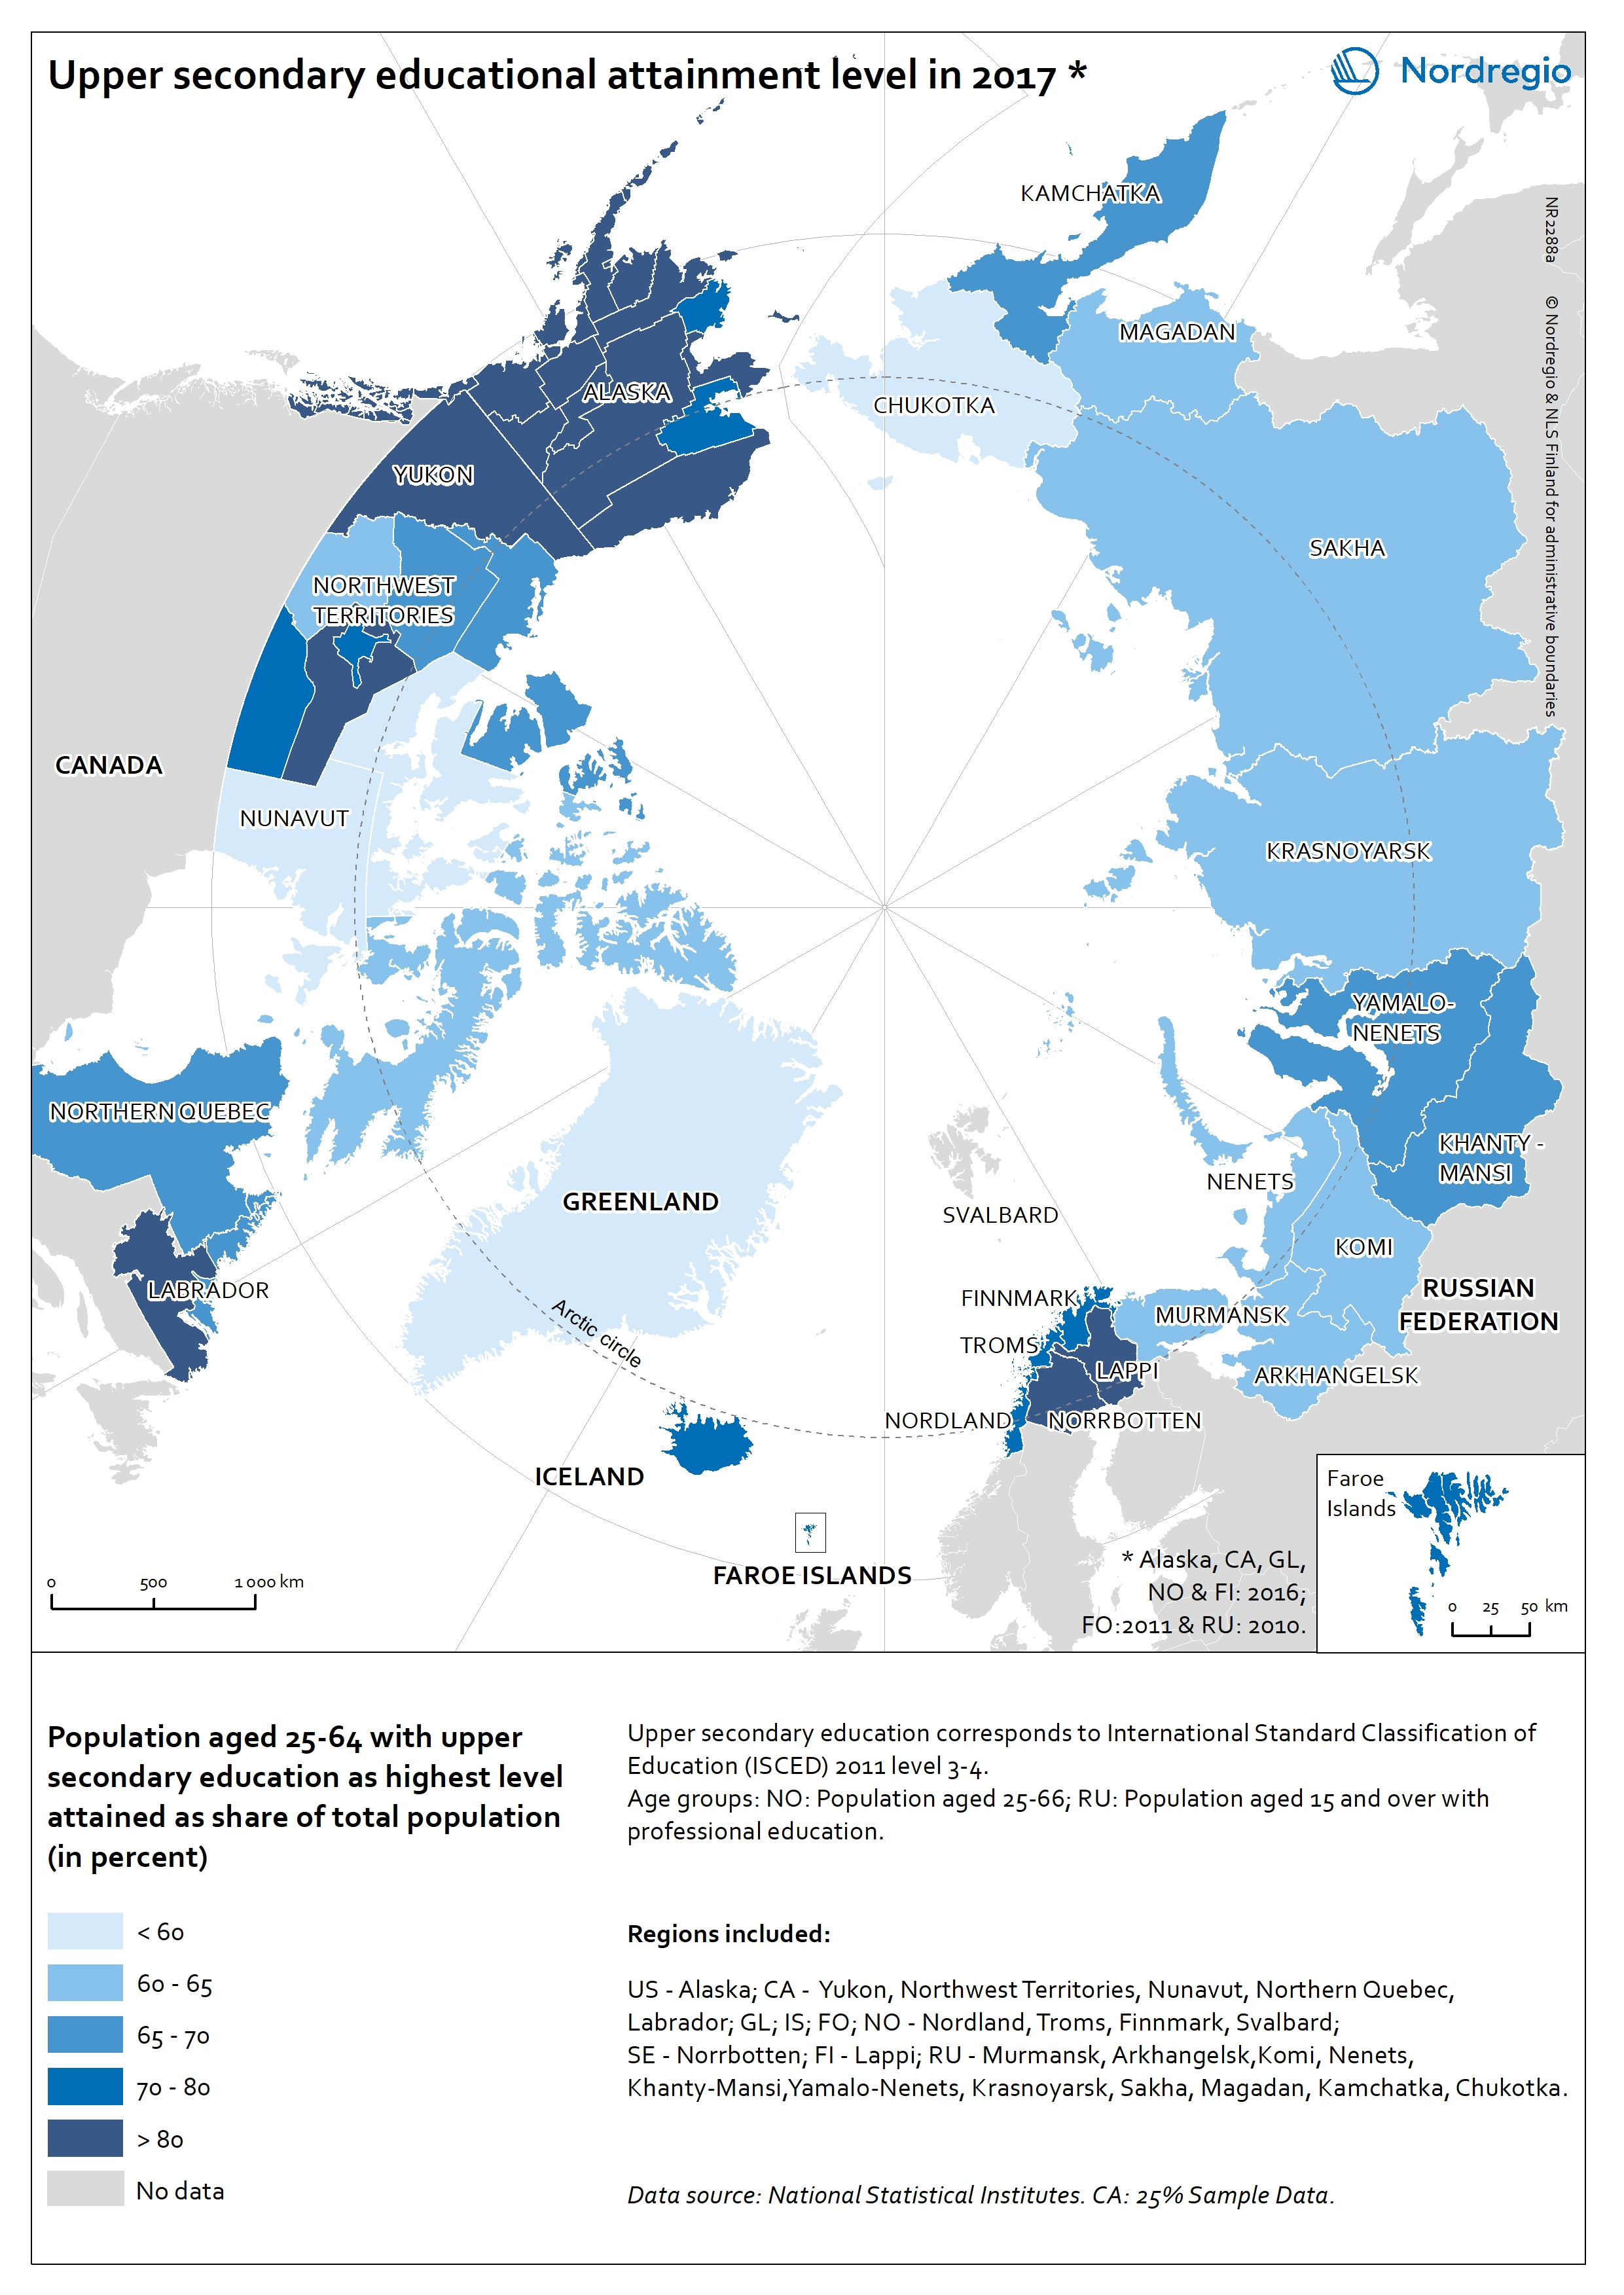
Upper secondary educational attainment level in the Arctic
The map shows the percent of individuals aged 25-64 with upper secondary education as highest level attained in 2017 in Arctic regions. The upper secondary education corresponds to International Standard Classification of Education (ISCED) 2011 levels 3-4. The dark blue tones show regions where more than 80% of individuals attained upper secondary education as highest level. The lightest blue tones show regions where less than 60% of individuals attained upper secondary education as highest level. Among the working age population, the number of individuals with upper secondary education was the highest in Alaska (USA, over 90%). Individuals with upper secondary education attainment level was also high – above 80% – in the Yukon and Labrador (Canada), Norrbotten (Sweden), and in Lappi (Finland). The lowest share of individual with upper secondary education was in Greenland (45,6%), Chukotka (Russian Federation, 58,4%) and in Nunavut (Canada, 59,1%).
- 2019 March
- Arctic
- Demography

Labour force participation rate in the Arctic
The map shows the regional labour force (active population) as share of total population in the Arctic regions in 2016. The active population includes all persons (aged 15 years old and over) with at least one current paid job or searching for one. The dark green tones show regions with high participation rates and correspondingly light green tones show regions with low participation rates. The Russian Arctic regions of Chukotka (83,6%), Yamalo-Nenets (78,0%), and Magadan (76,1%) had the highest participation rates. The lowest participation rates were in Lappi (Finland, 53,3%) and in Nordland (Norway, 59,9%).
- 2019 March
- Arctic
- Economy
- Labour force
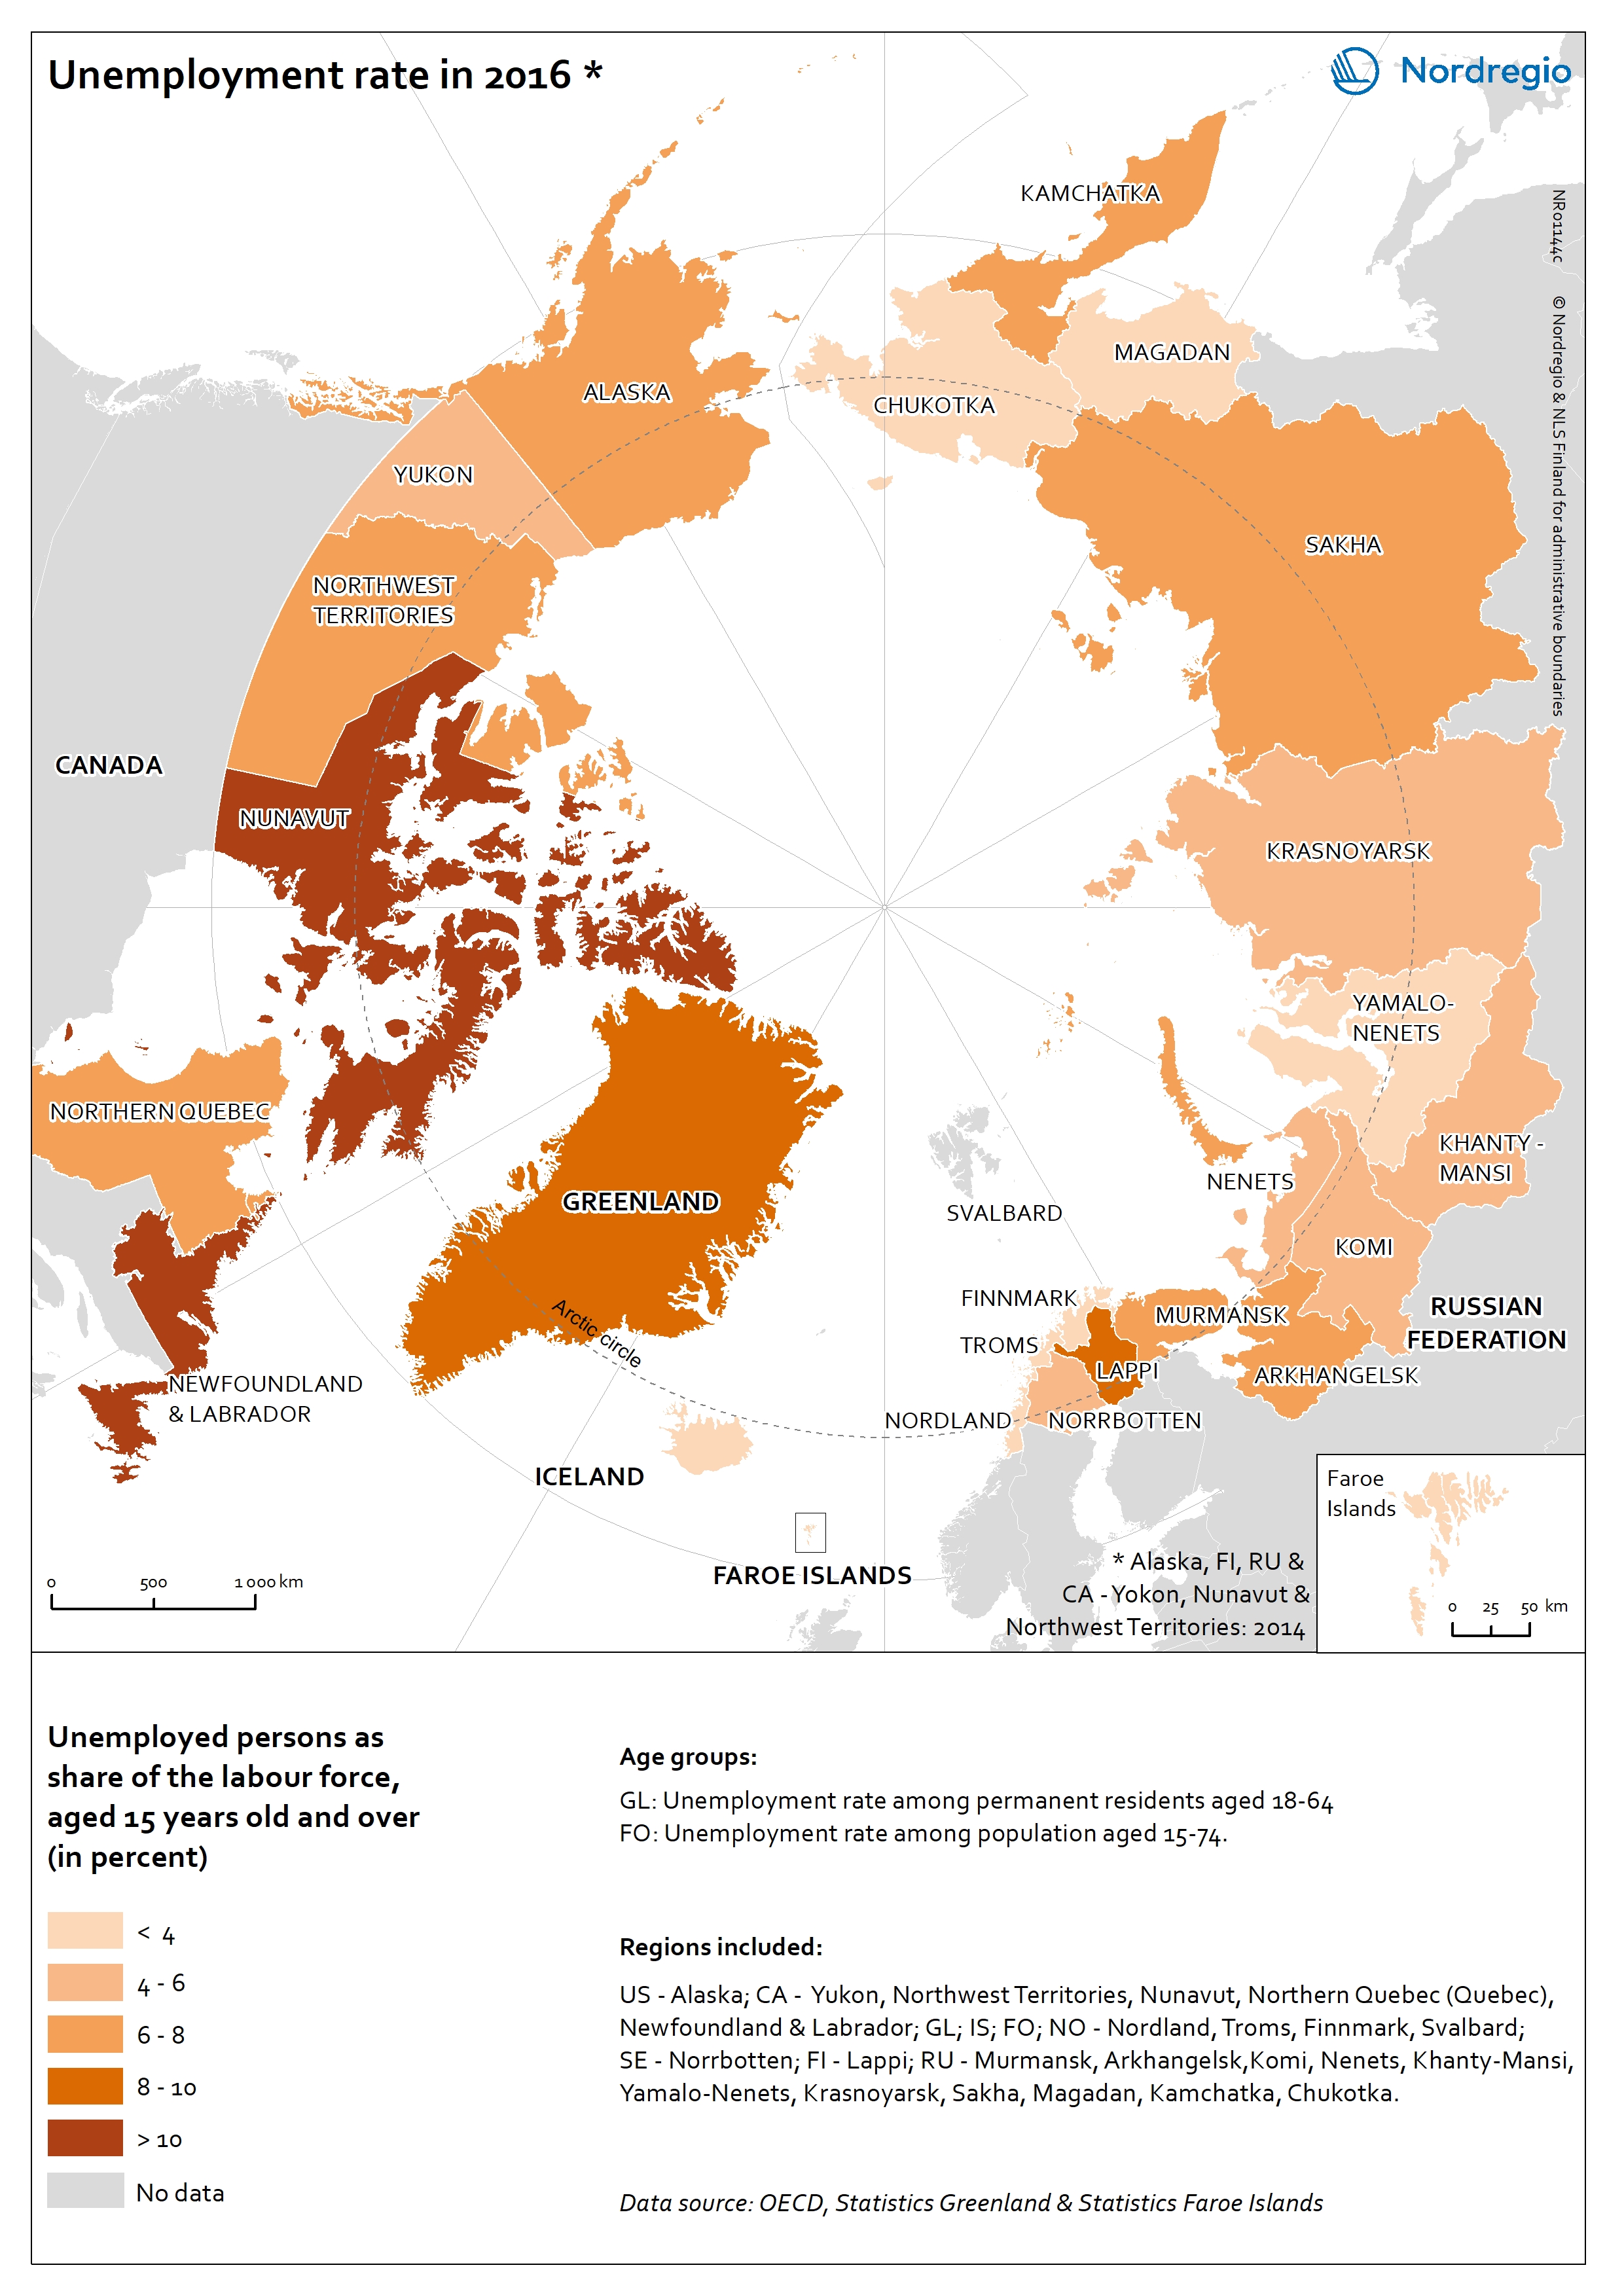
Unemployment rate in the Arctic
The map shows unemployed persons as share of the labour force (aged 15 years old and over) in the Arctic regions in 2016. The dark orange tones show regions with high unemployment rates and correspondingly light orange tones show regions with low unemployment rate. Nunavut and Newfoundland and Labrador (Canada, 14,0% and 13,4%, respectively) had the highest unemployment rates. The unemployment rate was the lowest in Finnmark, Nordland, and Troms (Norway, 2,6%, 3,3%, and 3,3%, respectively), in the Faroe Islands (3,3%), in Iceland (3,0%), as well as in three Russian Arctic regions: Magadan (3,1%), Yamalo-Nenets (3,1%), and Chukotka (3,2%). The unemployment rate in the Arctic regions mostly follows the national averages.
- 2019 March
- Arctic
- Economy
- Labour force
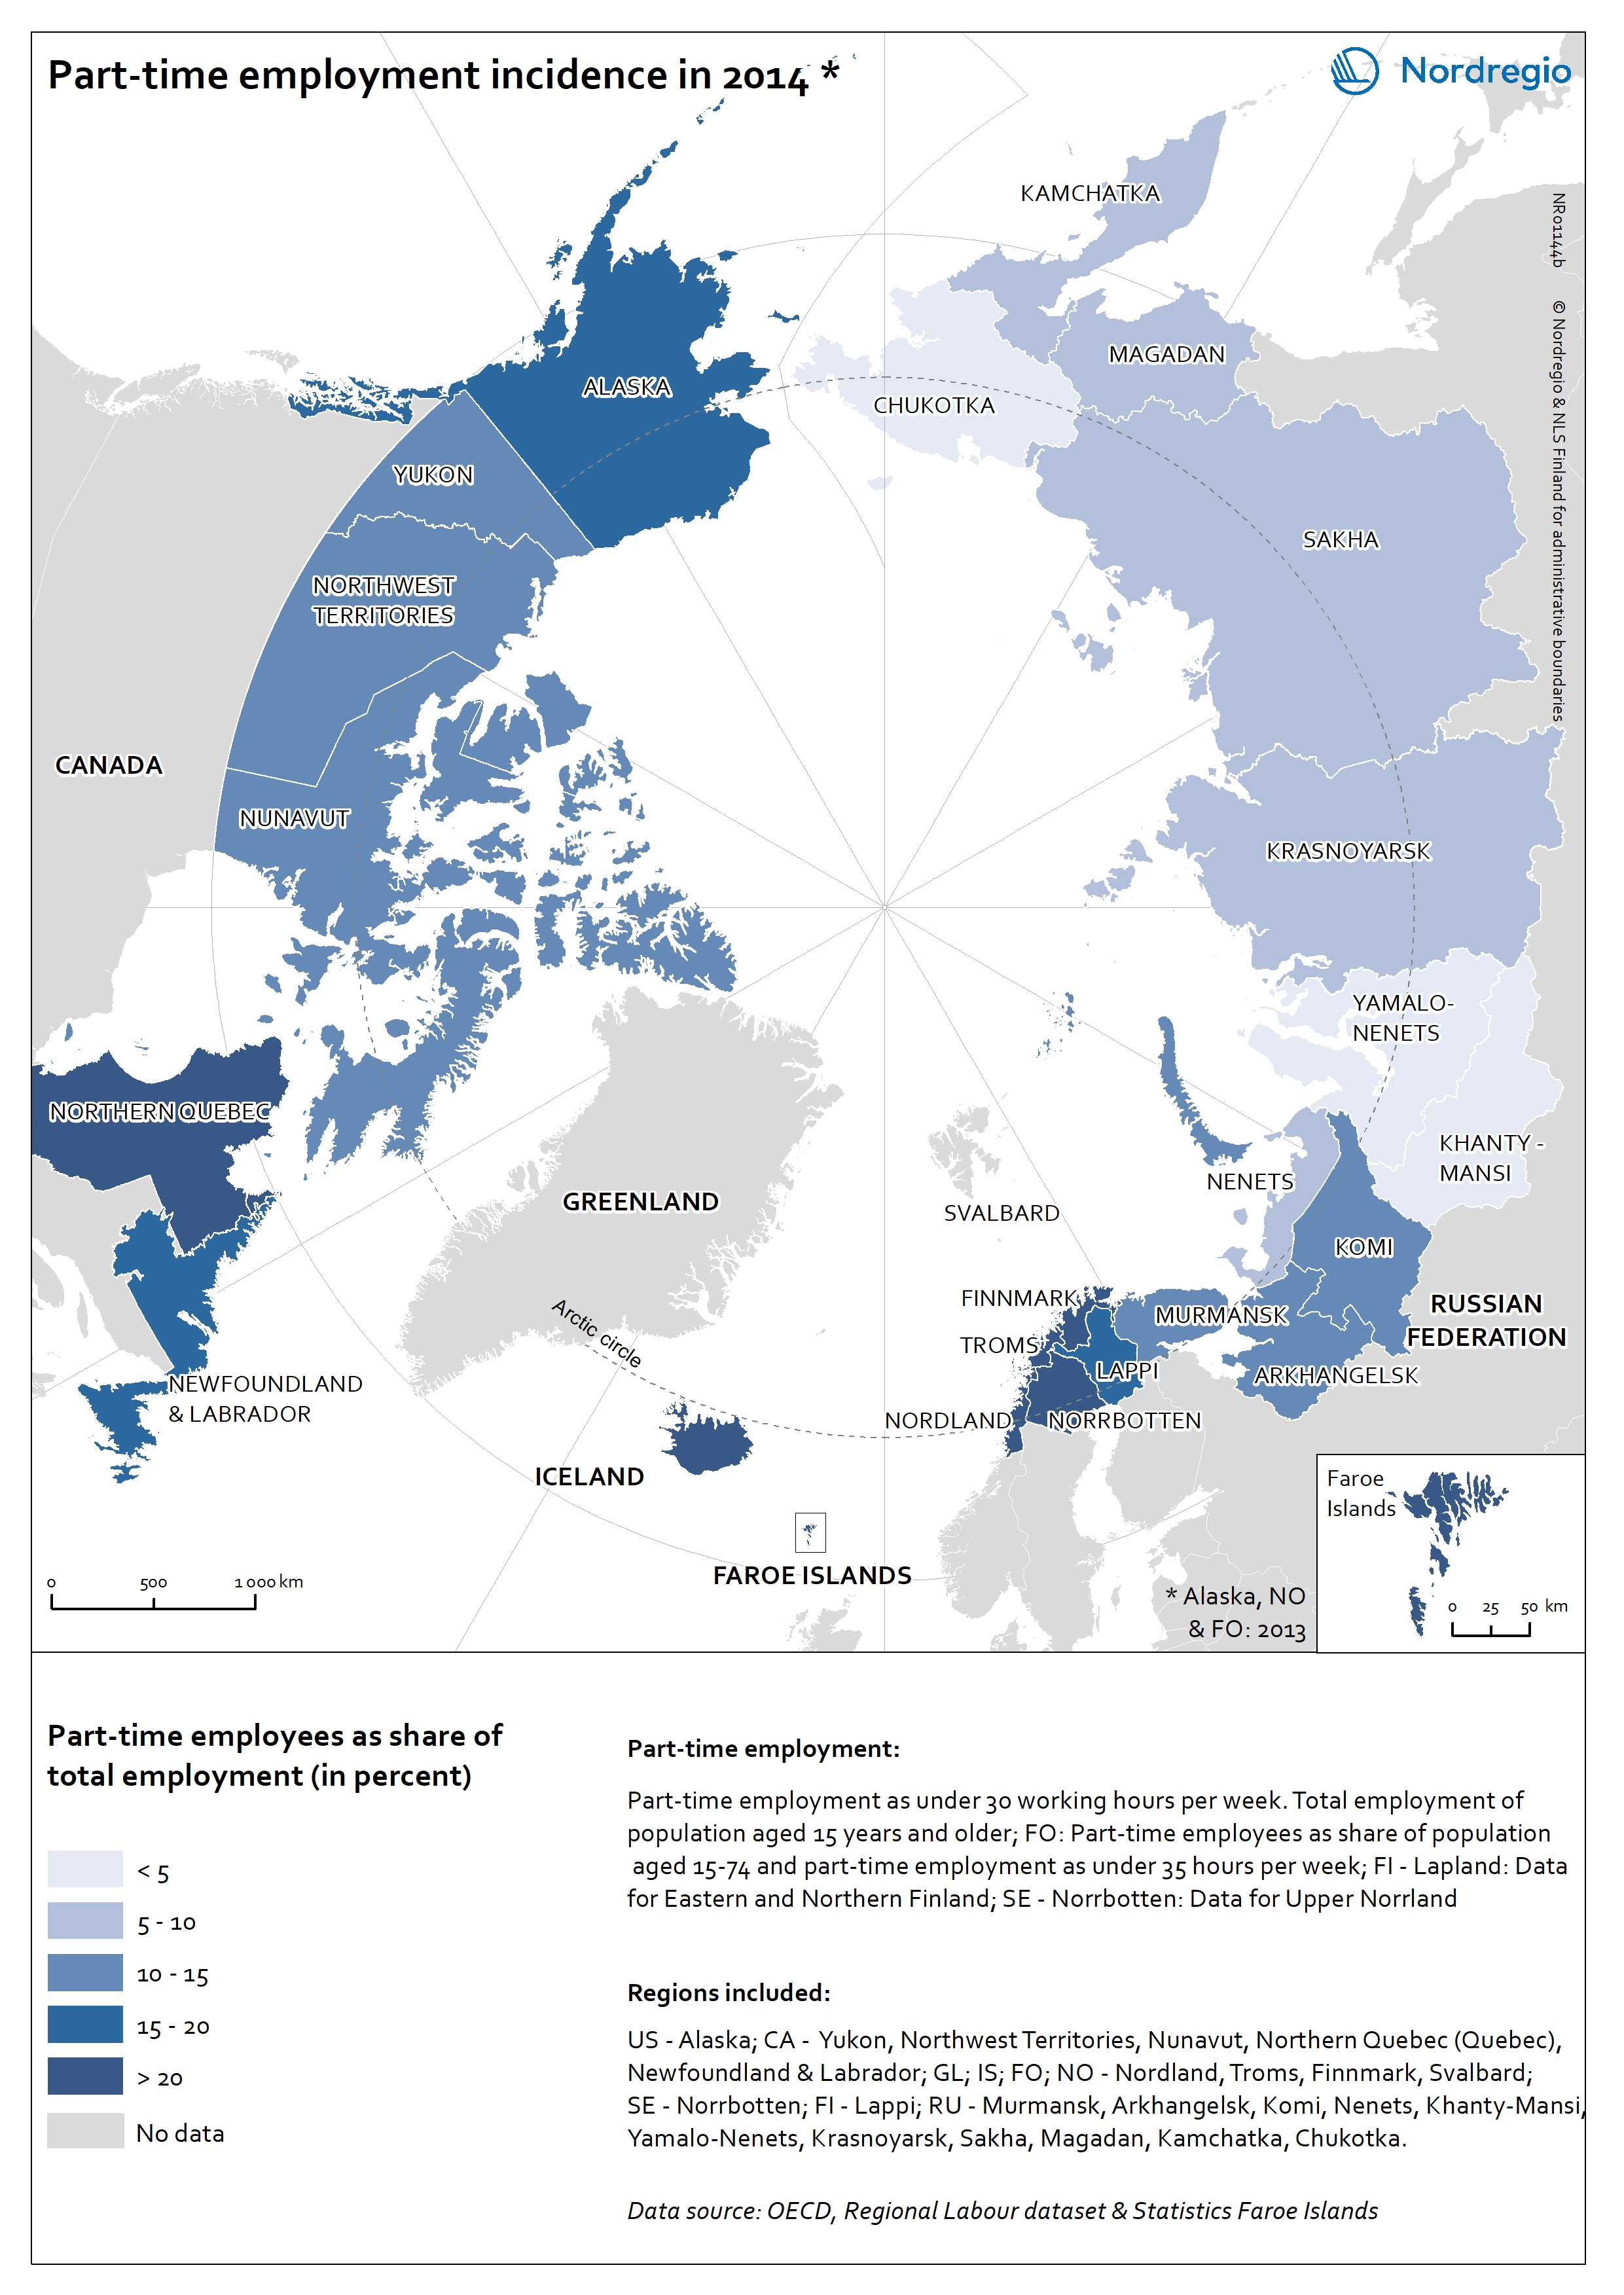
Part-time employment incidence in the Arctic
The map shows the share of the part-time employees over total employment in the Arctic regions in 2014. Part-time workers are considered as persons (aged 15 years old and over) who are working less than 30 hours per week. The dark blue tones show regions with high part-time employment incidence and correspondingly light blue tones show regions with low part-time employment incidence. The three Arctic regions of Norway had the highest part-time employment incidence: Nordland (59,5%), Troms (56,3%), and Finnmark (56,0%). The Russian Arctic regions of Yamalo-Nenets (0,9%), Khanty-Mansi (2,5%), and Chukotka (3,4%) had the lowest part-time employment incidence.
- 2019 March
- Arctic
- Economy
- Labour force
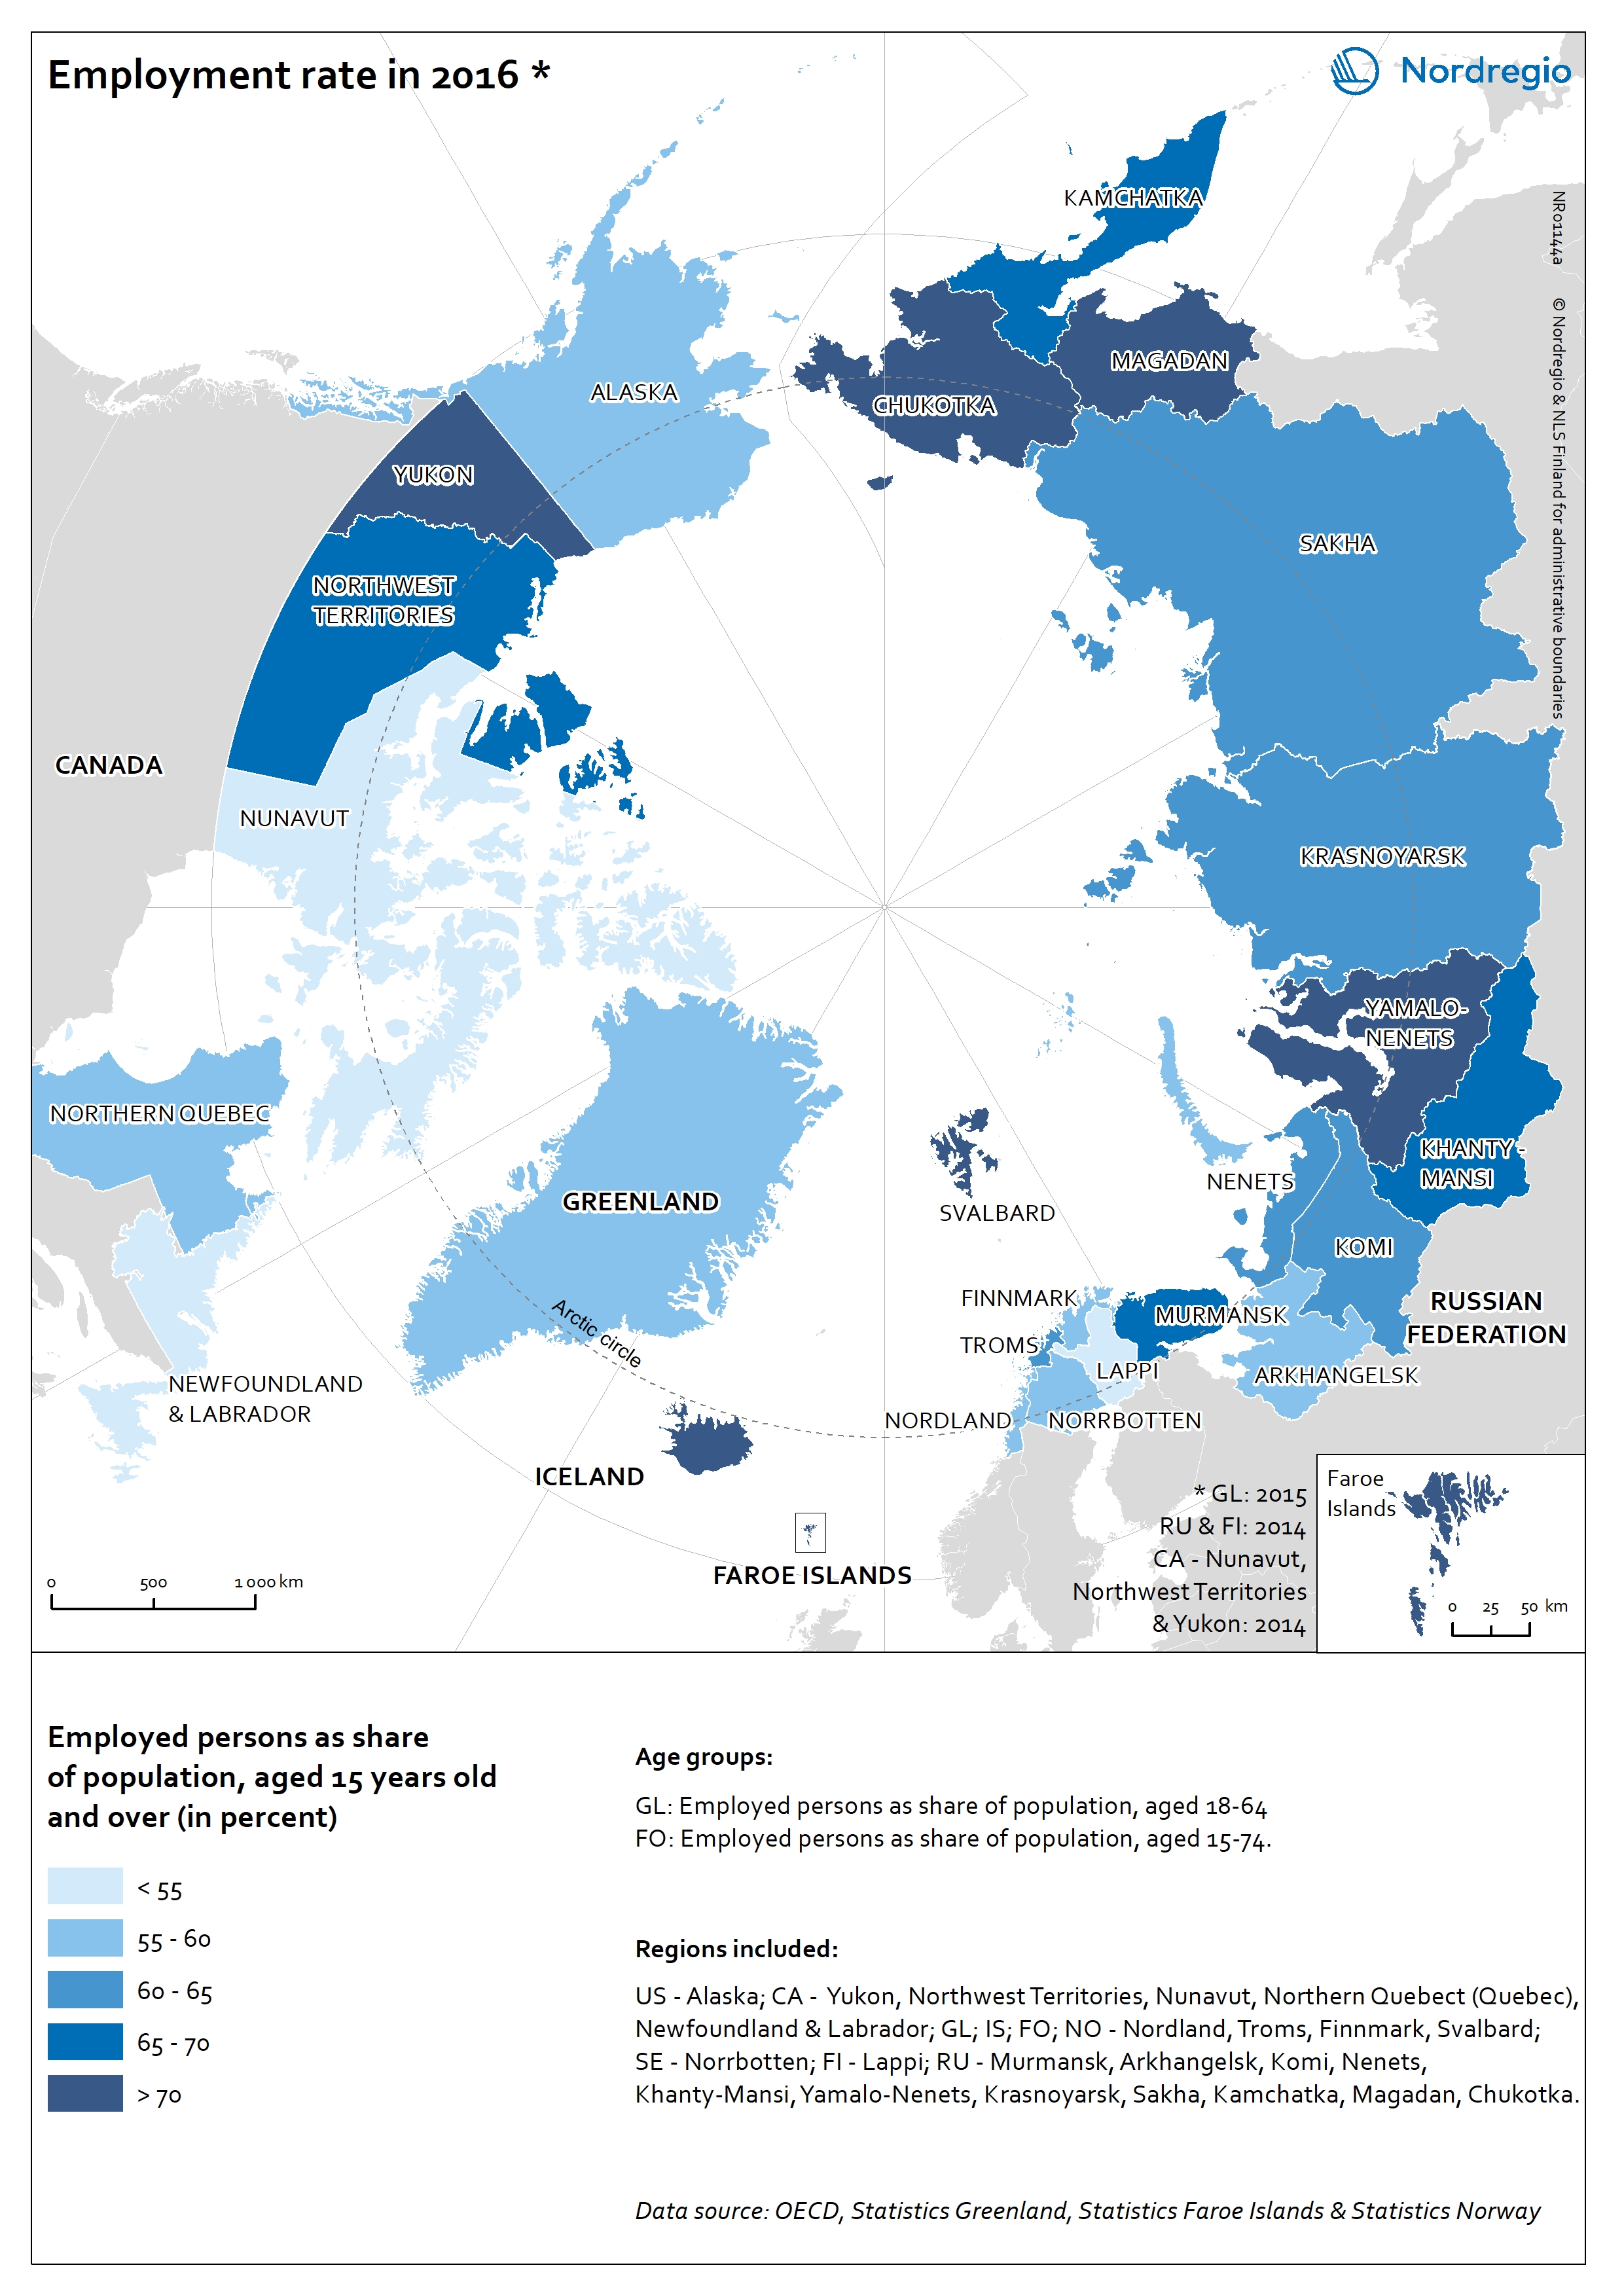
Employment rate in the Arctic
The map shows the employment rate for the Arctic regions in 2016 based on OECD data. The employment rate is the ratio between the employed population and the working age population (aged 15 years old and over). Employed persons are aged 15 or over who report that they have worked in gainful employment for at least one hour in the previous week or who had a job but were absent from work during the reference week. The dark blue tones show regions with high employment rates and correspondingly light blue tones show regions with low employment rate. The highest employment rates in the Arctic regions were in the Faroe Islands, Svalbard, the Yukon (Canada), Chukotka, Yamalo-Nenets, and Magadan Oblast (Russian Federation). The lowest employment rates were in Finnish Lapland (48,1%), Newfoundland & Labrador, and Nunavut (Canada, 52,4% and 53,0%, respectively). The employment rate in the Nordic Arctic regions was lower than the average of their respective countries whereas in Alaska (USA) and the Russian Arctic the employment rate was higher than average of their respective countries.
- 2019 March
- Arctic
- Economy
- Labour force
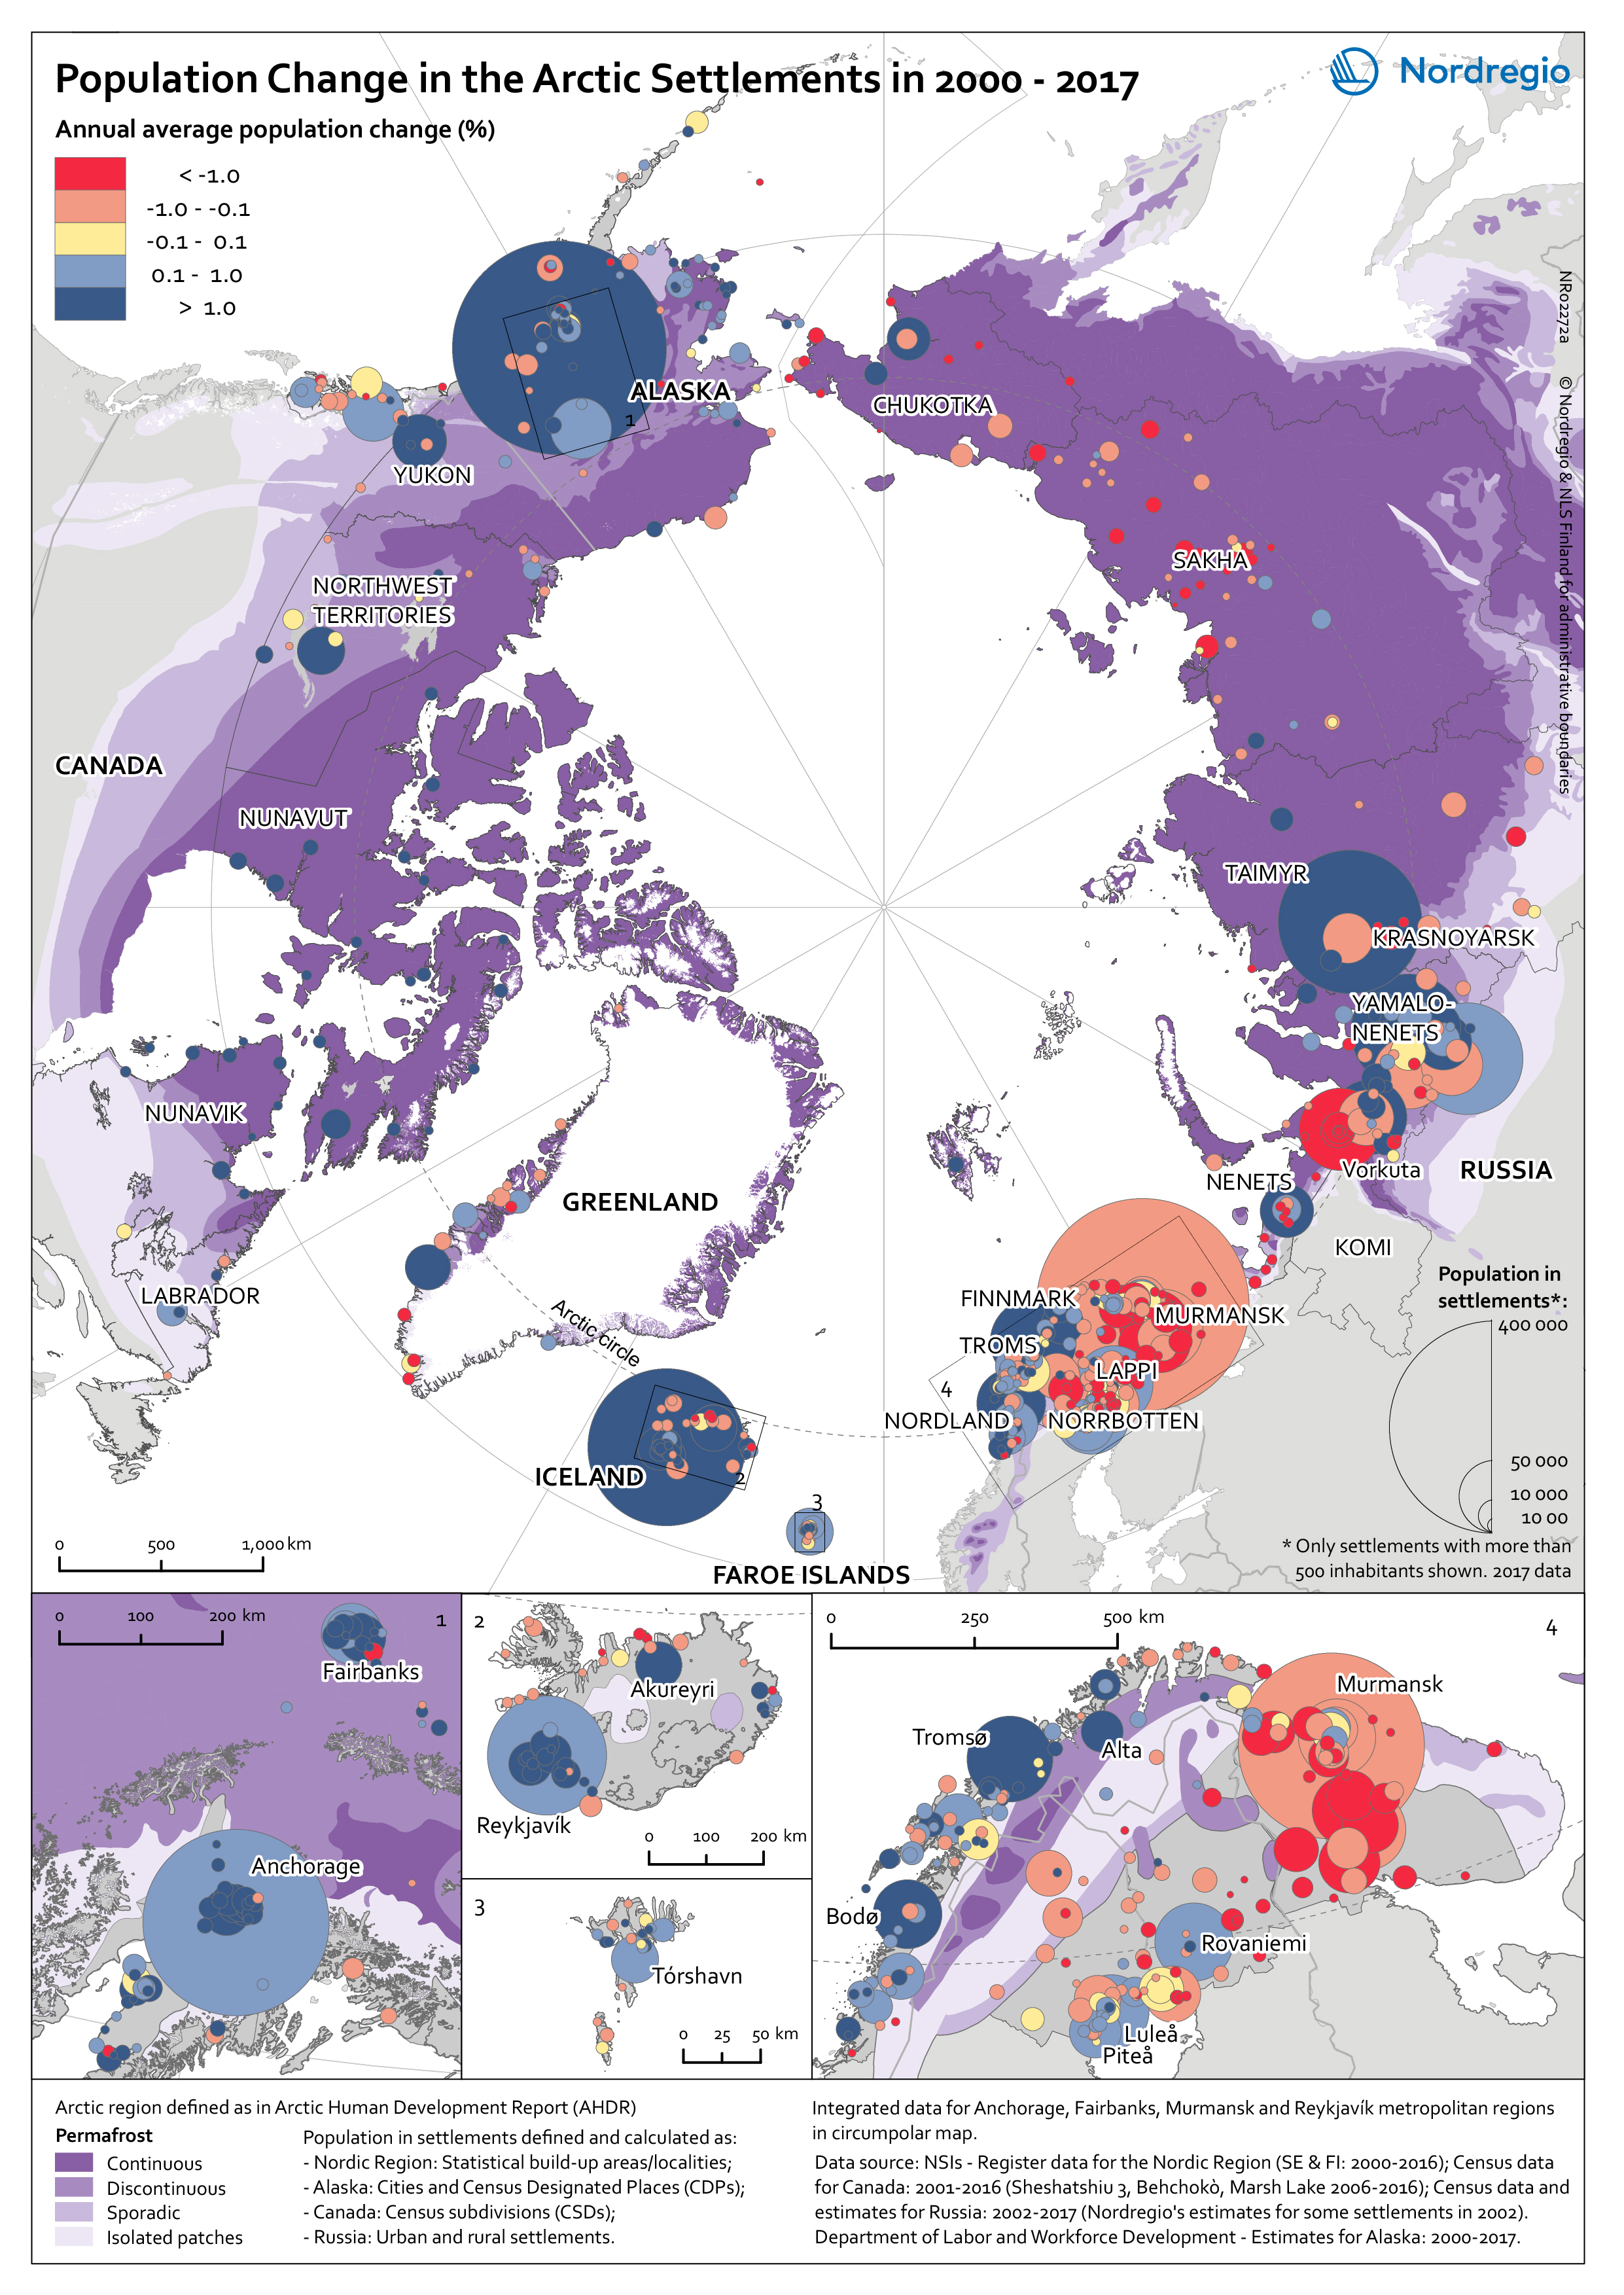
Population change in Arctic settlements
The map provides an overview of the population change in Arctic settlements with 500 inhabitants or more during the period 2000 to 2017. The purple underlaying layer shows the extent of permafrost across the Arctic. The circles indicate settlements with 500 inhabitants or more and are proportional to the total population in 2017. Blue tones indicate population growth between 2000 and 2017, while red tones indicate population decline. Four zoomed-in maps show areas with high settlement density – Arctic Fennoscandia, Iceland, the Faroe Islands, and Alaska. In Alaska, population increased in the largest settlements between 2000 and 2017. The population decline in small settlements located far from the two large cities – Anchorage and Fairbanks – has been caused by outmigration, which has cancelled out the positive natural population growth. In the Canadian Arctic, most people live in a few settlements. Similar to Alaska, the population increased in the largest settlements and decreased in small settlements. Most of the smaller settlements in Arctic Fennoscandia have witnessed a population decline between 2000 and 2017, except in Norway. The dominant pattern in Fennoscandia is a population growth in larger settlements and a population decline in surrounding smaller settlements. This is similar to the pattern observed in the other Nordic Arctic countries – Iceland, Greenland, and the Faroe Islands. New inhabitants settled in the capitals (Reykjavik, Nuuk, and Torshavn) and regional centres, from both domestic and international locations, while settlements in sparsely populated areas are becoming less attractive to incomers. In the Russian Arctic, the regions can be divided into the oil and gas areas of the Khanty-Mansi and Yamal-Nenets, and other areas. The population is growing in the oil and gas areas and declining slowly in the others. Over 75% of the settlements have been shrinking throughout the 21st century, mainly because…
- 2019 March
- Arctic
- Demography
- Migration
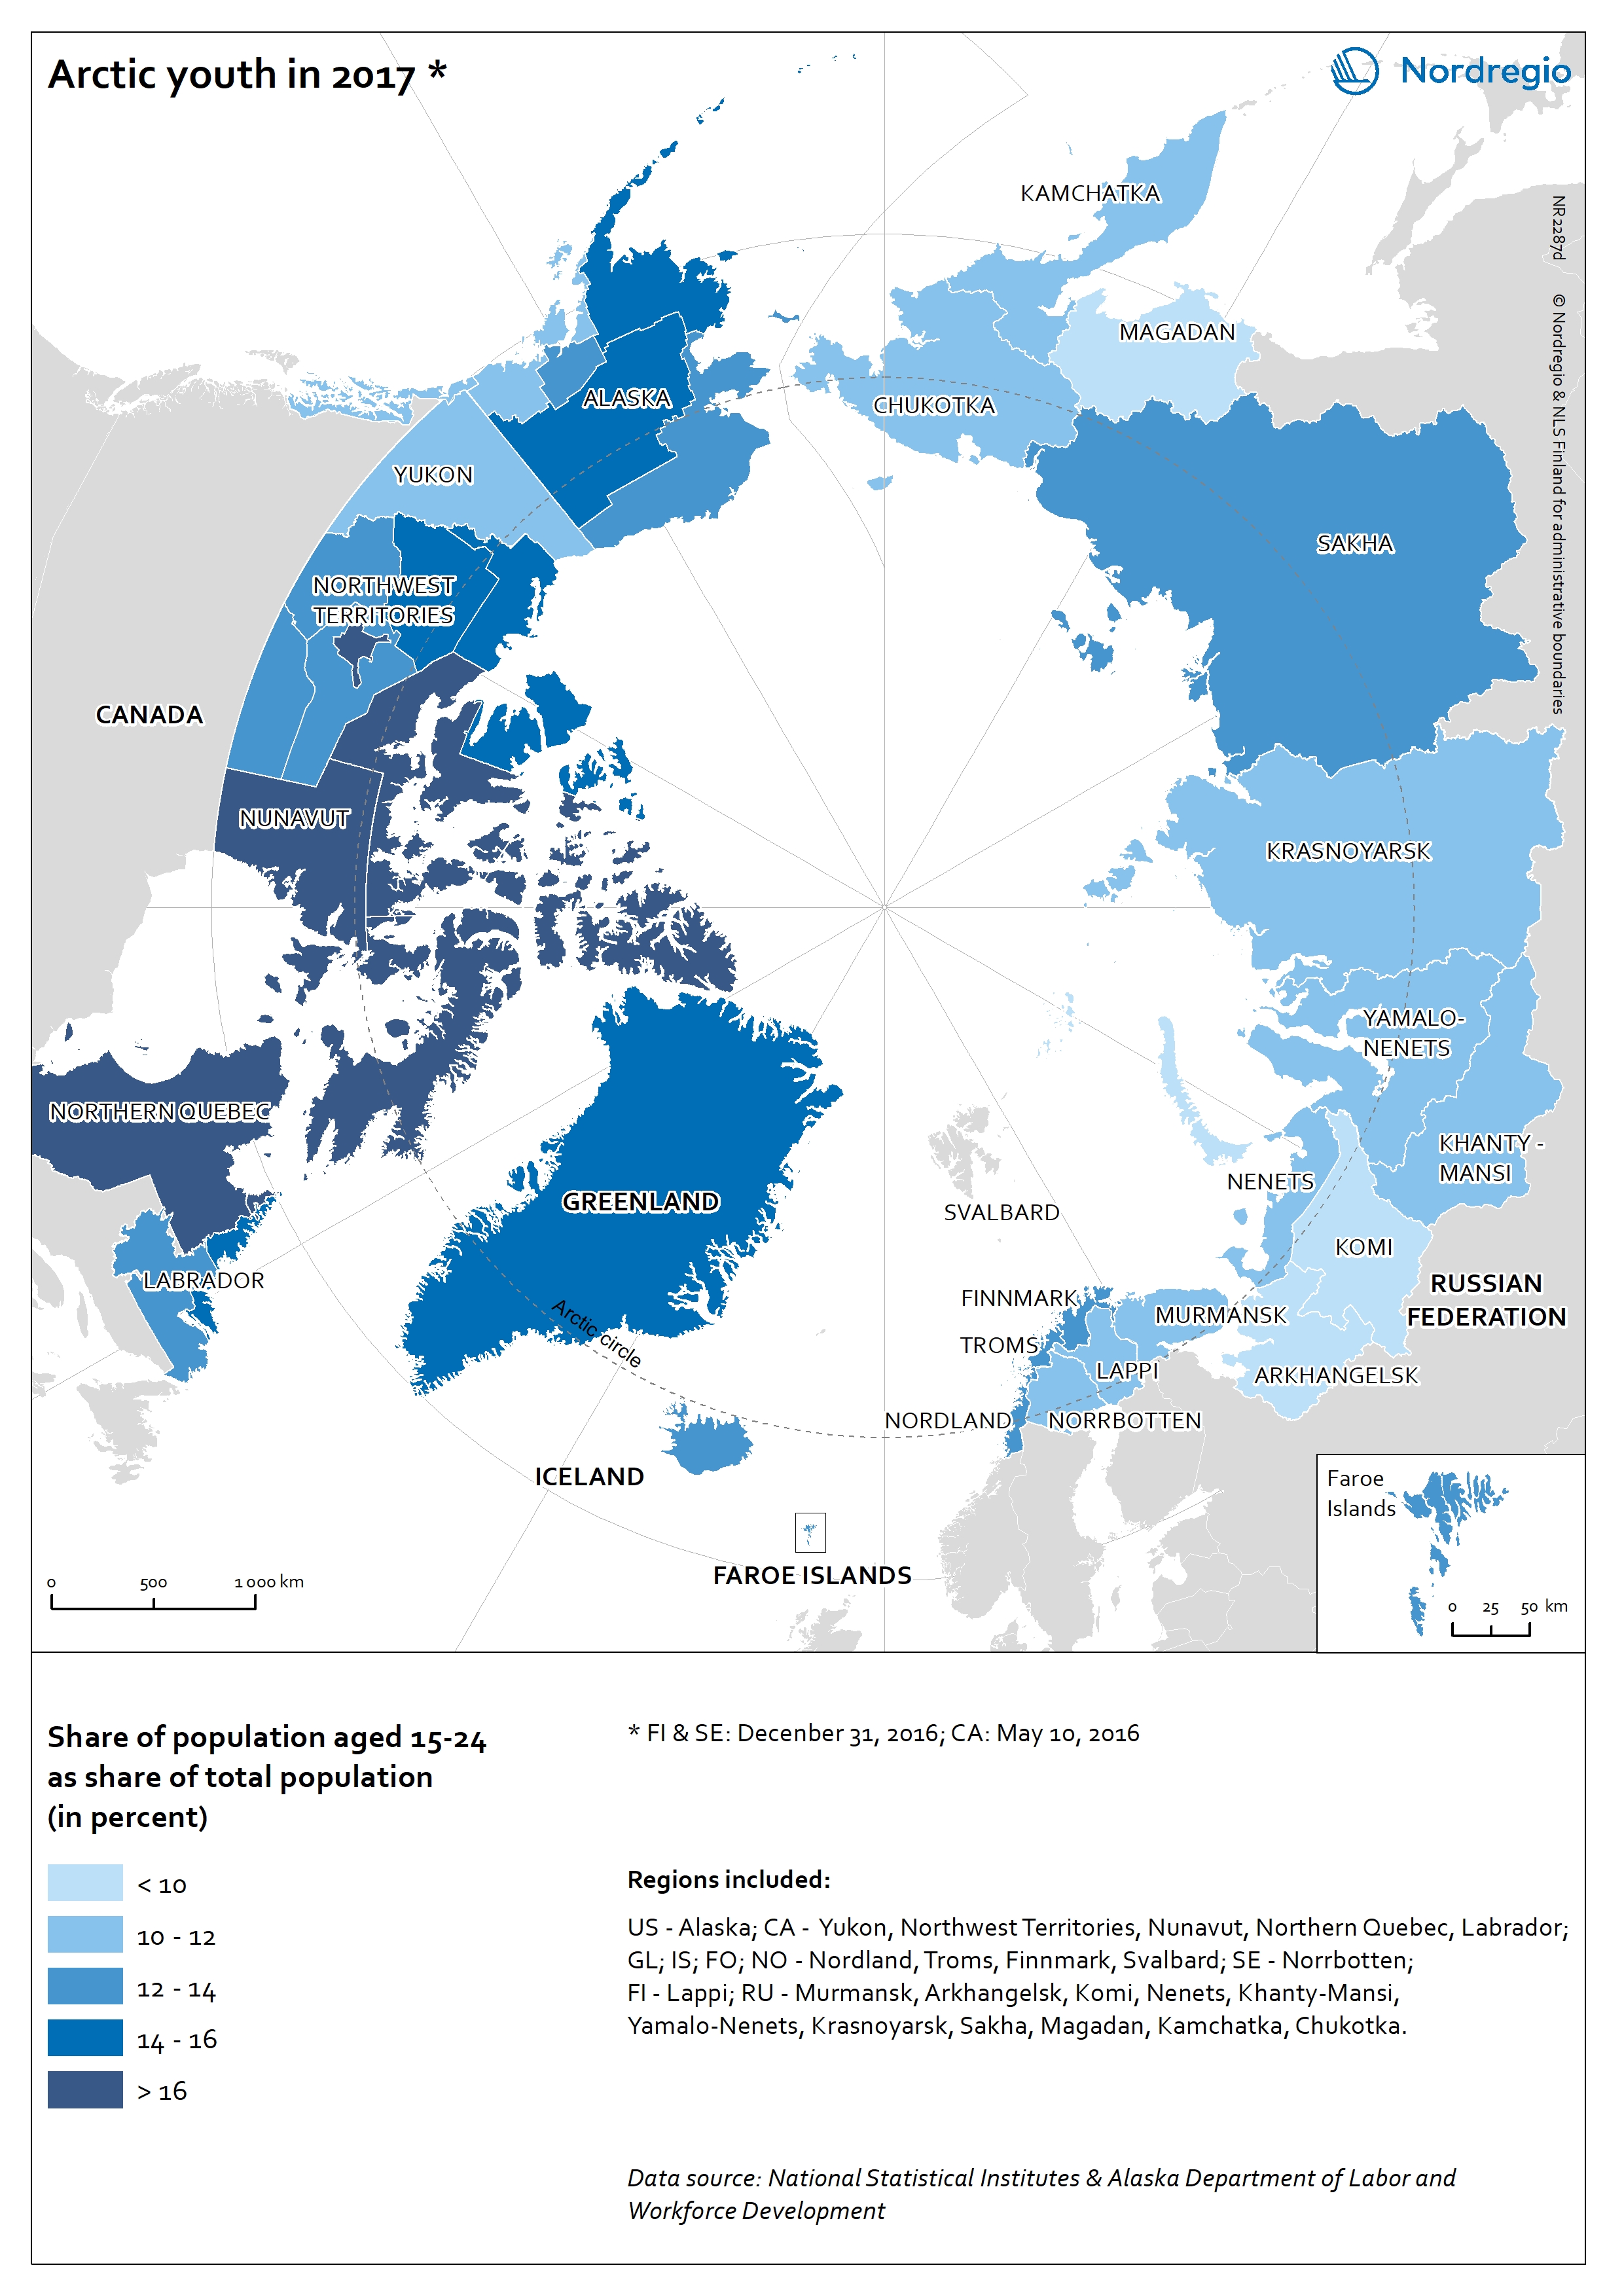
Share of youth population in the Arctic
The map shows the population aged 15-24 as share of the total population in 2017 at the regional level in the Arctic. Age 15 to 24 is a standard international definition of youth used by the OECD and United Nations. Dark blue tones indicate regions with high share of youth in the total population, and light blue tones indicate regions with low share of youth. Keewatin in Nunavut region (Canada) had the highest share of youth (18,8%). Region 3 in the Northwest Territories, Northern Quebec, as well as the other two regions in Nunavut (Canada) had a share of youth above 15%. Magadan (9,2%), Arkhangelsk (9,4%) and Komi (9,7%) (Russian Federation) had the lowest shares of youth in their total populations.
- 2019 March
- Arctic
- Demography
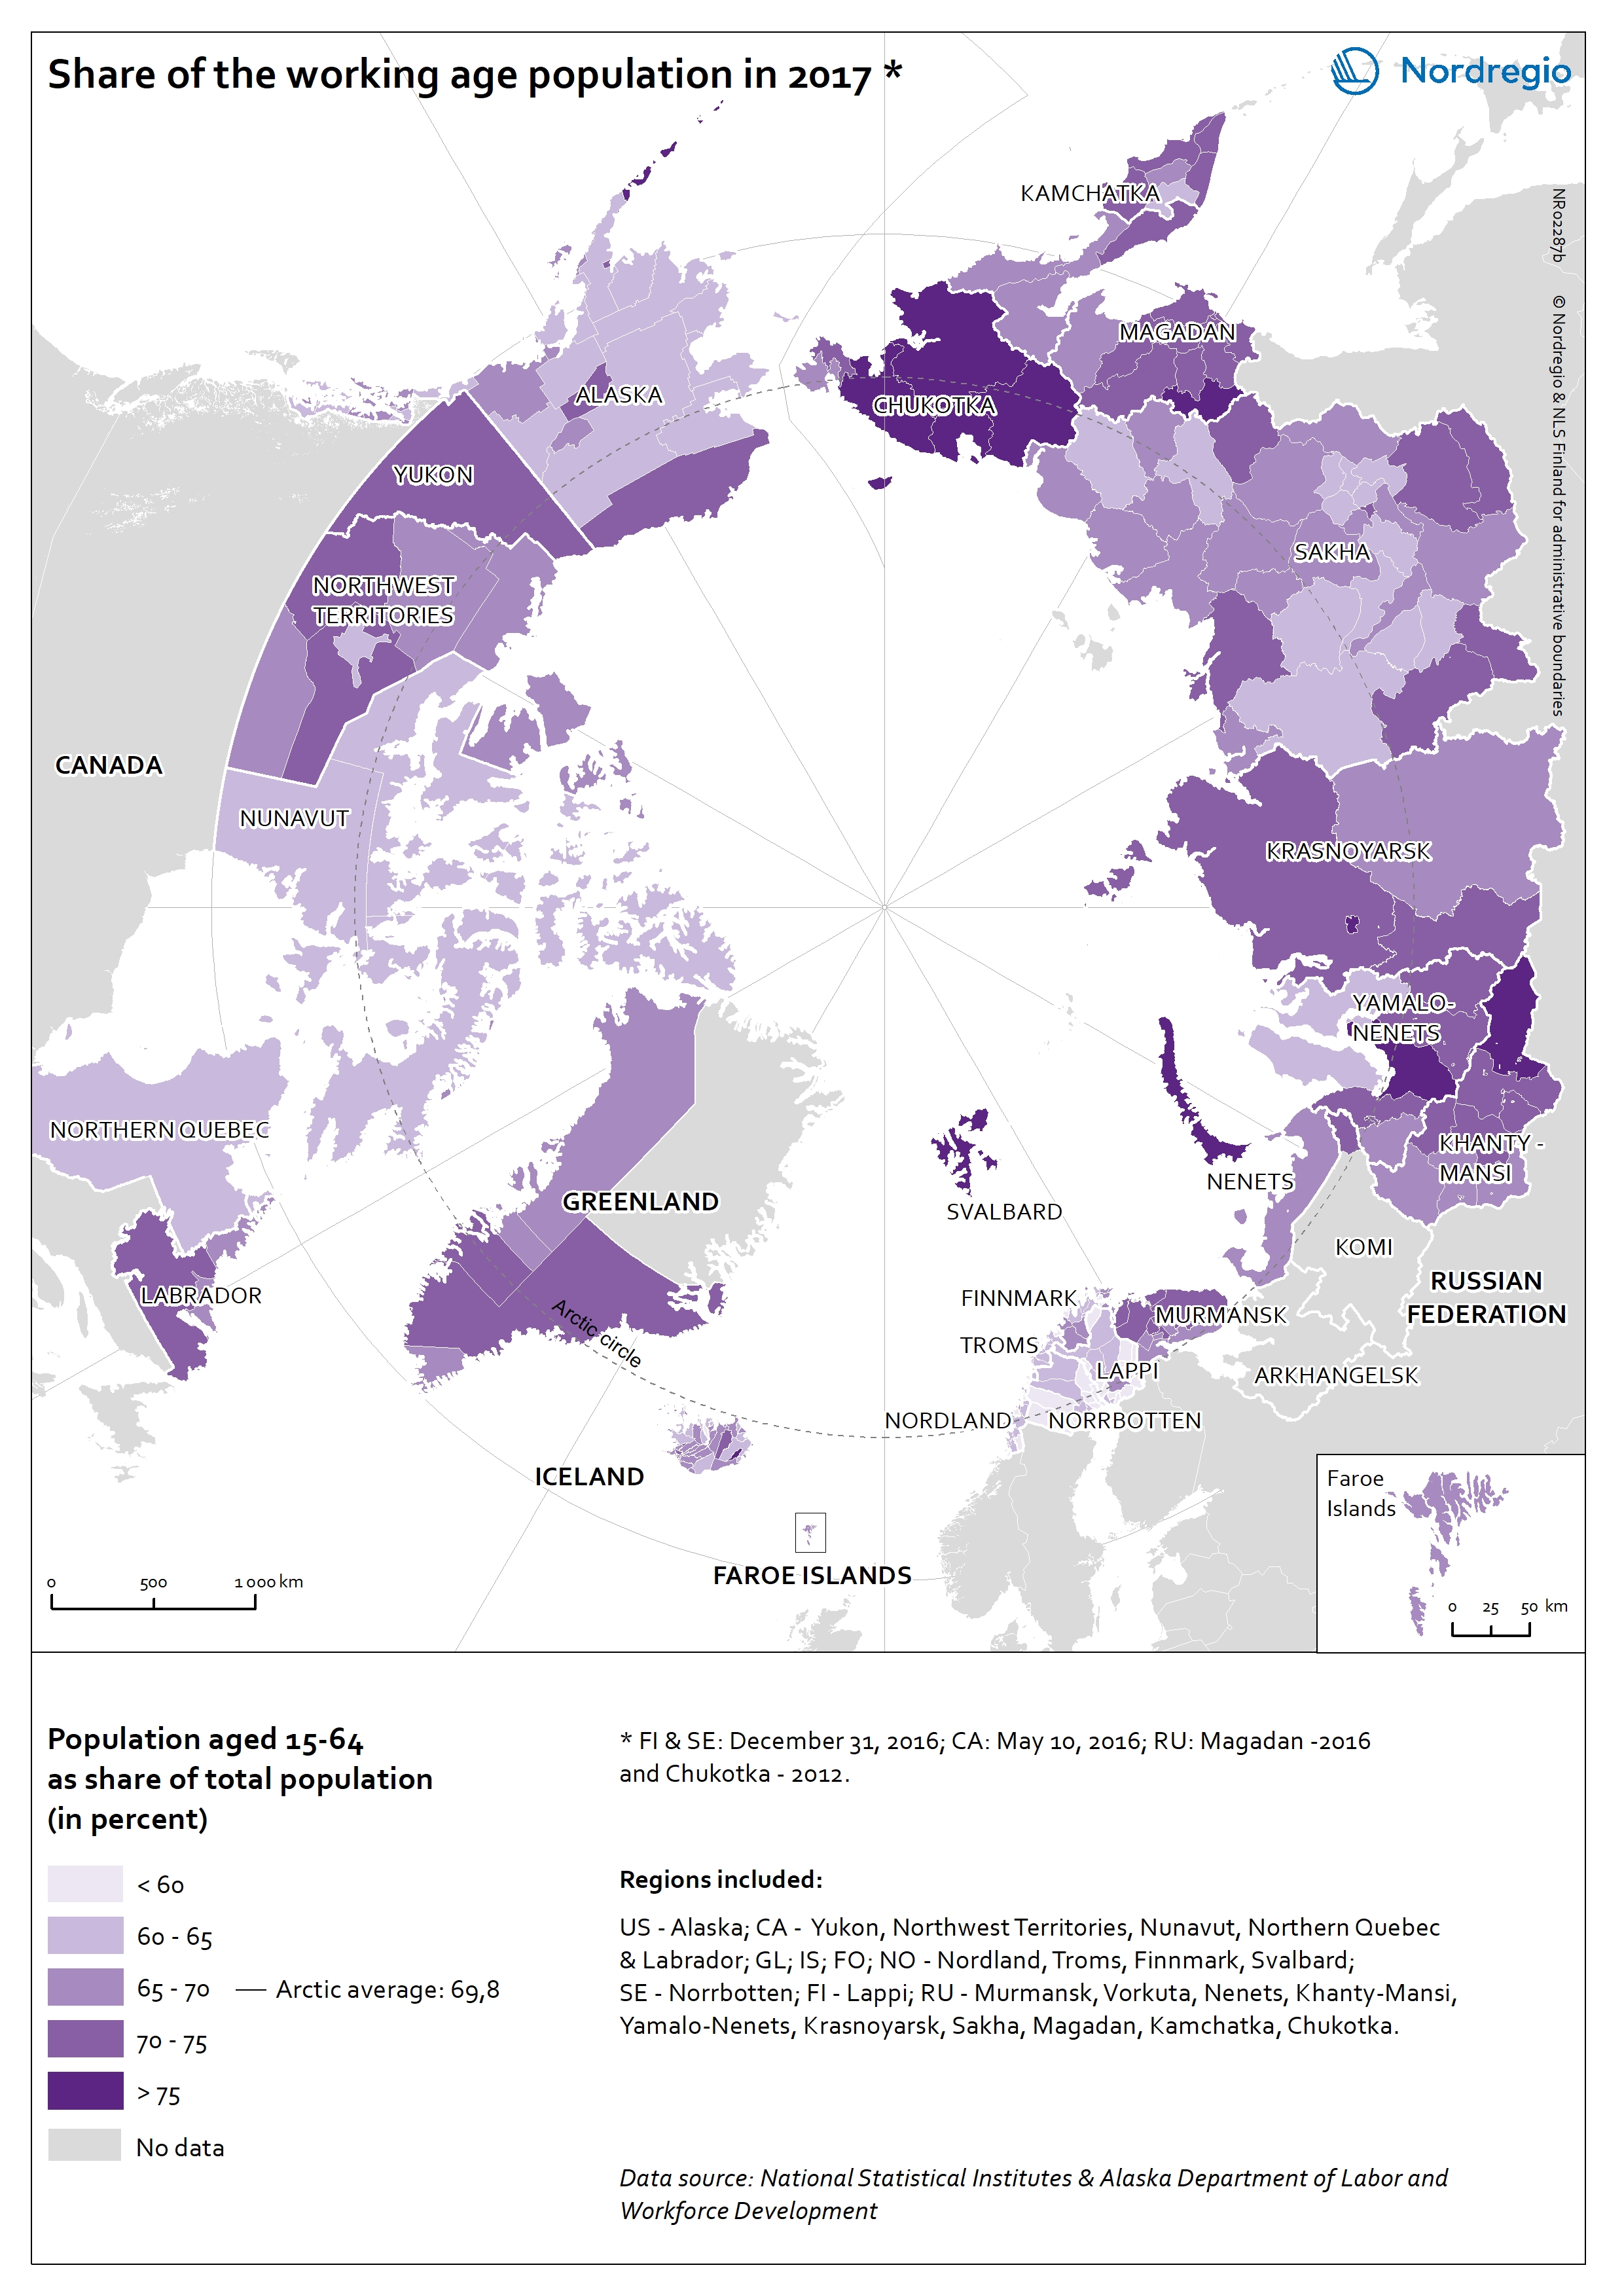
Share of working age population in the Arctic
The map shows the population aged 15-64 as a share of the total population in 2017 at the sub-regional level in the Arctic. Dark purple tones indicate subregions with high share of working age population, and light purple tones indicate subregions with low share of working age population. In the Arctic the share of the working age population was 69,8%. The highest share of working age population was in regions where a large share of employment is related to natural resources extraction such as oil, gas, and minerals. This is especially the case in the Russian Arctic regions. All subregions in the Nordic countries had a share of working age population smaller than 60%. Subregions in the Russian Federation as well as in Svalbard (Norway) and in Aleutian Islands (Alaska) had high shares of working age population.
- 2019 March
- Arctic
- Demography
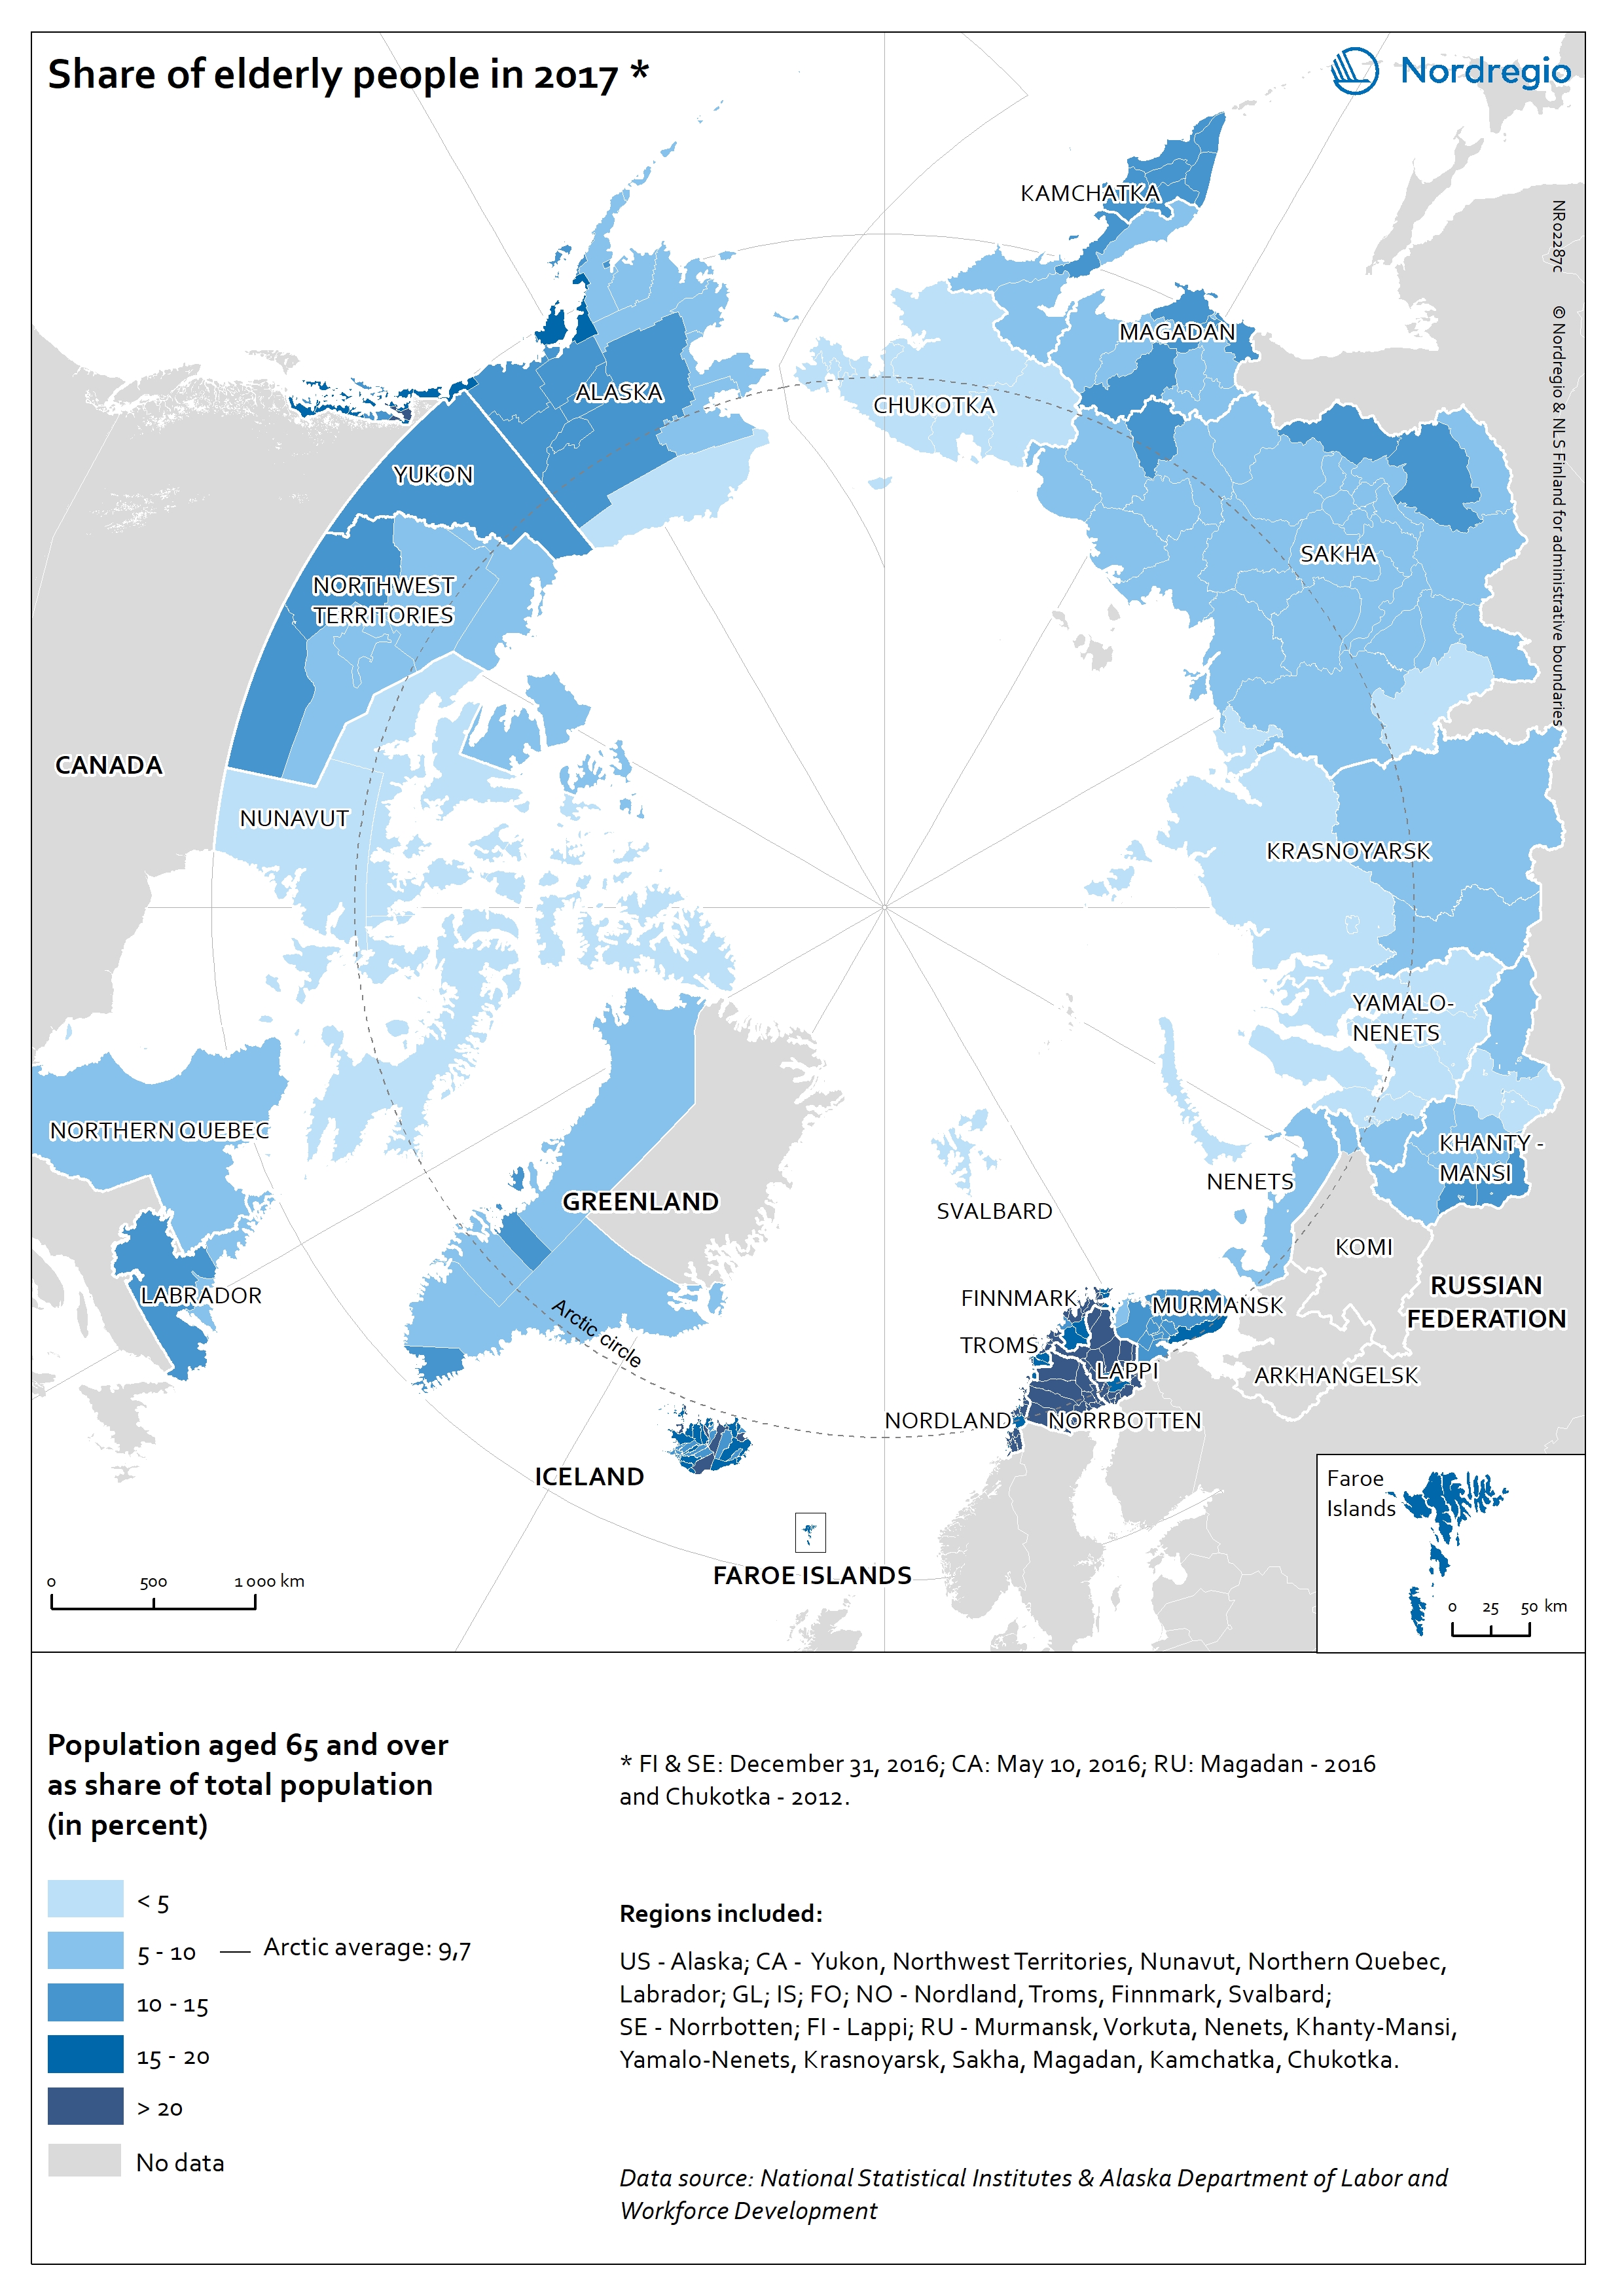
Share of elderly population in the Arctic
The map shows the population aged 65 and over as share of the total population in 2017 at the sub-regional level in the Arctic. Dark blue tones indicate subregions with high share of elderly people, light blue tones show subregions low share of elderly population. The Arctic is generally characterized by a low share of elderly (9,7%), especially in the subregions of Yamalo-Nenets, Krasnoyarsk, and Chukotka (Russian Federation), and Nunavut (Canada). Many of the Nordic subregions had a share of elderly over 20%, as well as in the Haines Borough (Alaska).
- 2019 March
- Arctic
- Demography
