117 Maps
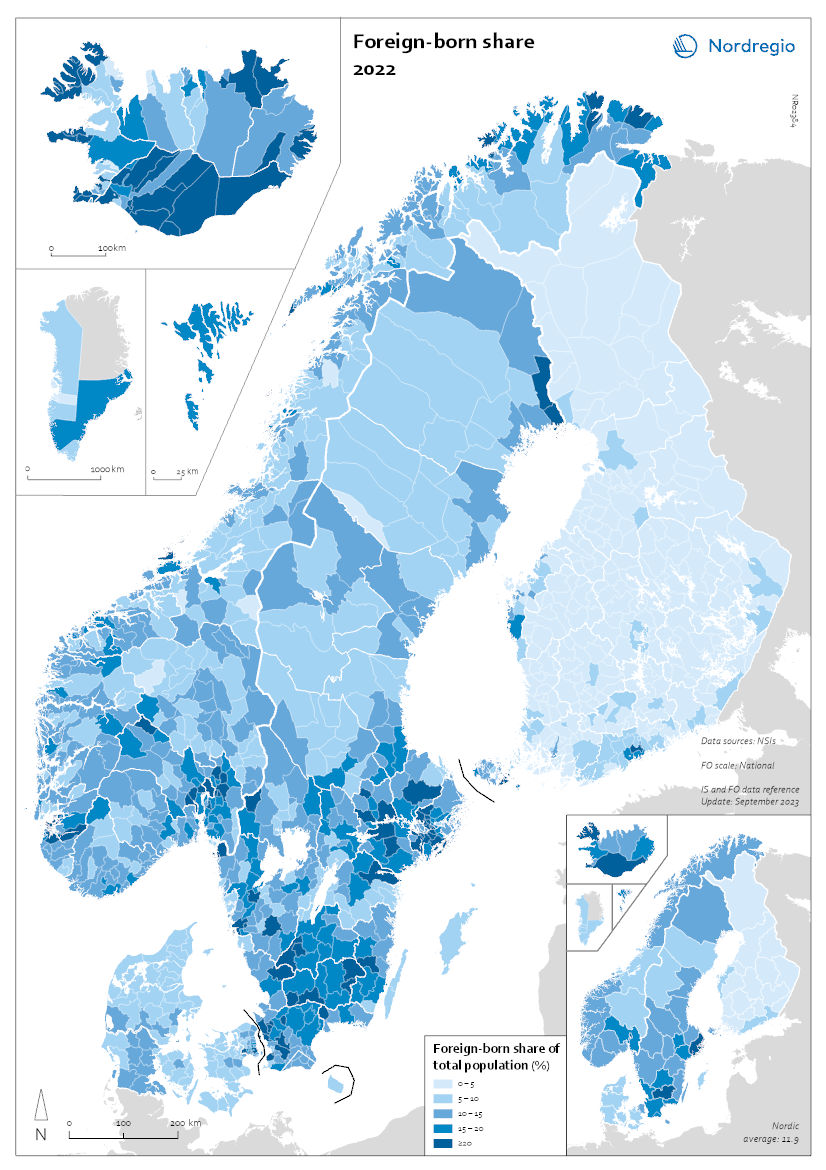
Foreign-born share 2022
This map shows the share of foreign-born of the total population in the Nordic countries. This map shows the share of foreign-born of the total population in Nordic municipalities (big map) and regions (small map), and municipalities (big map) in 2022. Iceland has the highest share of foreign-born residents in the Nordic Region, at 22%. Mýrdalshreppur, the municipality in the south containing the village of Vik, has the largest foreign-born population, at 58%. It is also the only municipality in the Nordic Region with a majority non-native population. Other municipalities in the south, some of which are quite small, also have significant foreign-born populations. Reykjanesbær, near Keflavik airport, is the largest municipality with a sizeable foreign-born population, at 29%. In Reykjavíkurborg, 20% of the population is foreign-born, about the same as the national average. Many municipalities with tiny populations in the Westfjords and the north also have small shares of foreign-born persons. In 2022, 17% of the population of Norway was foreign-born. Municipalities with high shares of foreign-born include Oslo (28%), several suburban municipalities near Oslo, and a few in the north – which have small overall populations but large numbers of foreign workers employed in the fishing industry. In Sweden, 20% of residents are foreign-born, with large differences in distribution by region and municipality. At the regional level, Stockholm has the highest share of foreign-born persons (27%), followed by Skåne, including the city of Malmö (24%). The percentage of foreign-born persons in Västra Götaland, which encompasses Gothenburg, is the same as that of Sweden as a whole. The regions with low shares of foreign-born persons are in the north of the country – Dalarna, Gävleborg, Västernorrland, Jämtland, Västerbotten, and Norrbotten – plus the island of Gotland, which has the lowest share (9%). There are no municipalities in which foreign-born…
 2025 April
 - Demography
- Migration
- Nordic Region
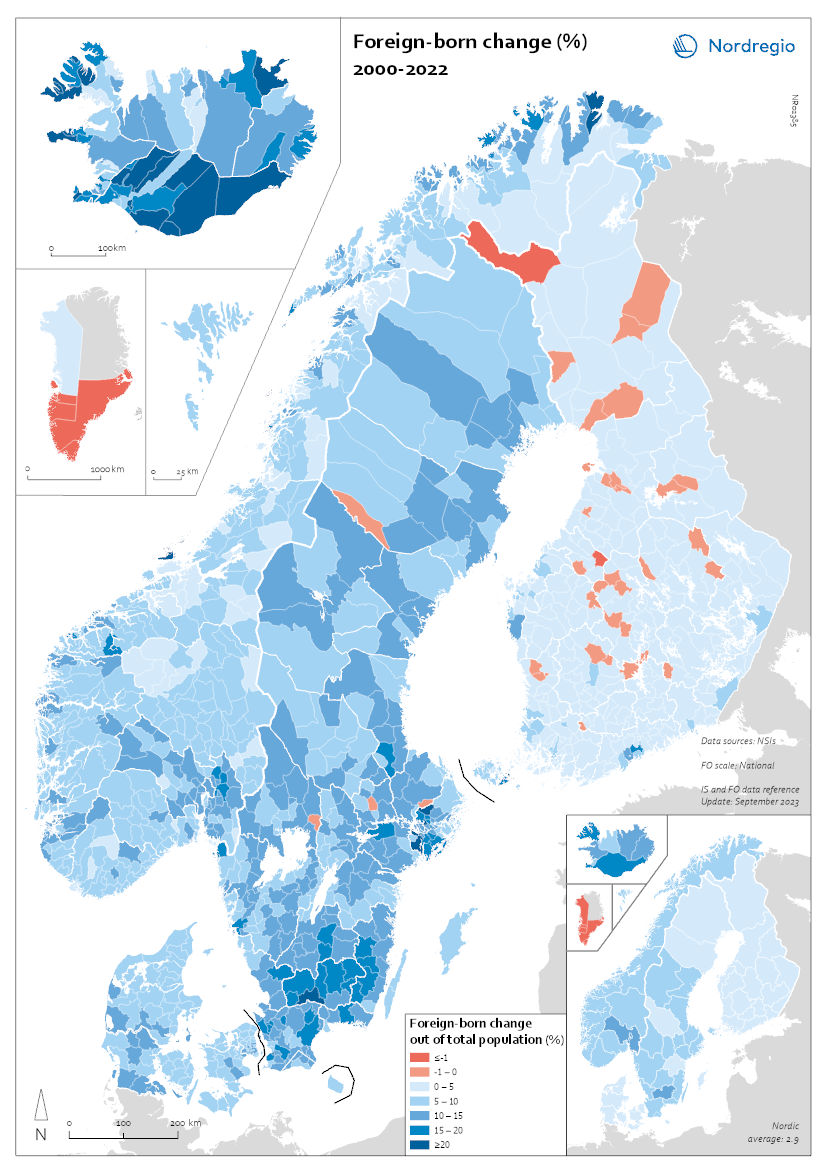
Foreign-born change (%) 2000-2022
This map shows the percentage-point change in foreign-born populations in the Nordic countries. This map shows the percentage-point change in foreign-born populations by region (small map) and municipality (big map) between 2000 and 2022. The blue shades indicate an increase in the number of foreign-born while the red shades indicate a decrease. The recent growth in foreign-born populations differs among the Nordic countries, regions, and municipalities. During the period 2000-2022, much of both the absolute and percentage-point increases in the foreign-born populations took place in suburbs around the capital cities and other large urban centres. However, with few exceptions, every municipality across the Nordic Region saw increases in foreign-born populations. In Iceland, the foreign-born population increased from 5% to 20%. The largest percentage-point increases in the foreign-born populations were in municipalities in the southwest, which had small populations and small foreign-born shares. Of the larger municipalities, Reykjanesbaer and the Capital Region had the largest absolute and percentage point increases. The foreign-born population in Norway grew from 7% to 17%. The municipalities with significant increases in foreign-born populations include several suburban areas near Oslo, as well as scattered municipalities elsewhere that had small foreign-born shares in 2000. The percentage of foreign-born residents in Oslo increased from 16% to 28% between 2000 and 2022. No municipalities experienced a decline in foreign-born population during this period.
- 2025 April
- Demography
- Migration
- Nordic Region
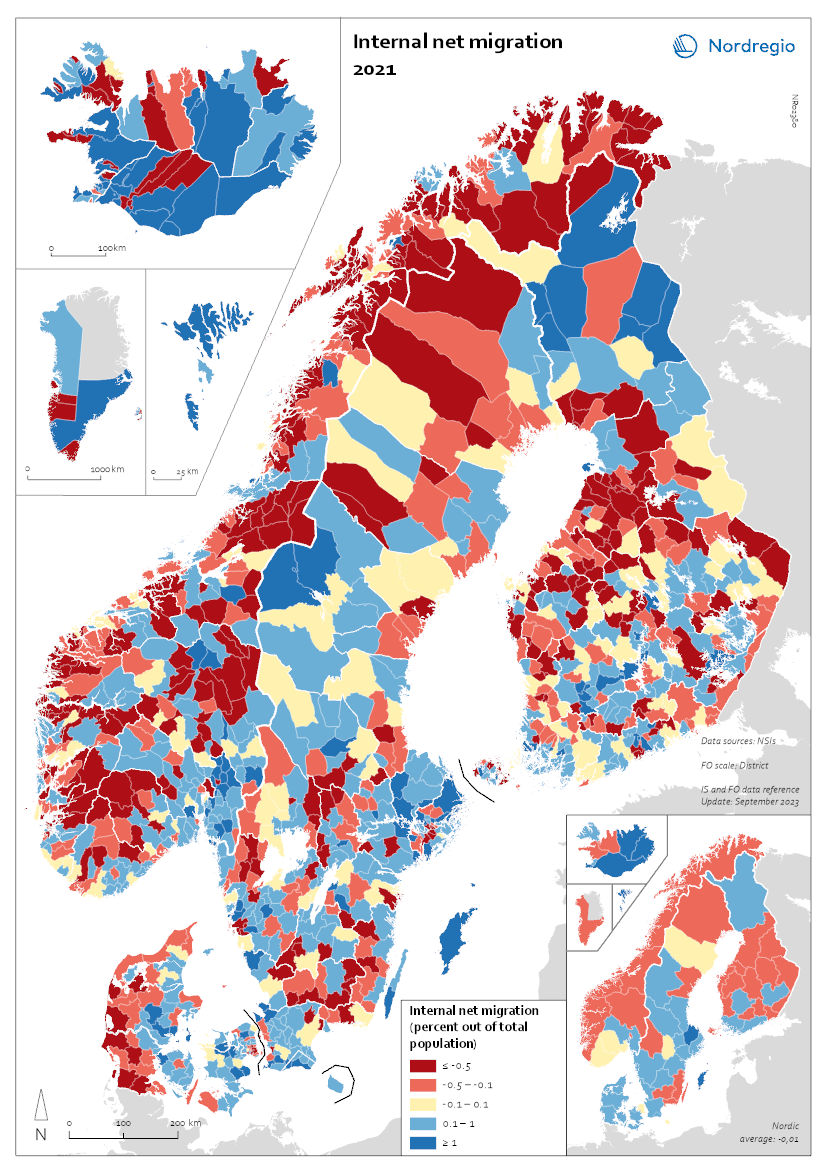
Internal Migration 2021
This map shows the internal net migration in 2021 as a percentage of the total population. This map shows the internal net migration in 2021 as a percentage of the total population. The small map shows the result on a regional level, and the big map on the municipal level. Internal (sometimes referred to as domestic) net migration refers to migration between municipalities and regions within the same country. International migration is excluded. In 2021, internal net migration was positive (indicated by shades of blue) or at least balanced (shown in yellow) in many of the municipalities in central and northern Sweden and in central and eastern Finland – areas that traditionally were more likely to lose population due to internal migration. Conversely, several municipalities in the capital regions – such as Stockholm, Oslo, and Copenhagen – exhibited negative internal net migration. Iceland, Greenland, and Åland exhibited mixed internal migration flows, with some municipalities experiencing positive net migration while others faced negative net migration. The Faroe Islands stand as an exception, maintaining only positive internal migration at the municipal level for this year.
- 2025 April
- Demography
- Migration
- Nordic Region
Typology of regional internal net migration 2020-2021
The map presents a typology of internal net migration in regions by considering average annual internal net migration in 2020-2021 alongside the same figure for 2018-2019. The colours on the map correspond to six possible migration trajectories: Dark blue: Internal net in migration as an acceleration of an existing trend (net in-migration in 2020-2021 + increase compared to 2018-2019) Light blue: Internal net in migration but at a slower rate than previously (net in-migration in 2020-2021 + decrease compared to 2018-2019) Green: Internal net in migration as a new trend (net in-migration in 2020-2021 + change from net out-migration compared to 2018-2019) Yellow: Internal net out migration as a new trend (net out-migration in 2020-2021 + change from net in-migration compared to 2018-2019) Orange: Internal net out migration but at a slower rate than previously (net out-migration in 2020-2021 + decrease compared to 2018-2019) Red: Internal net out migration as a continuation of an existing trend (net out-migration in 2020-2021 + increase compared to 2018-2019)
- 2022 May
- Demography
- Migration
- Nordic Region
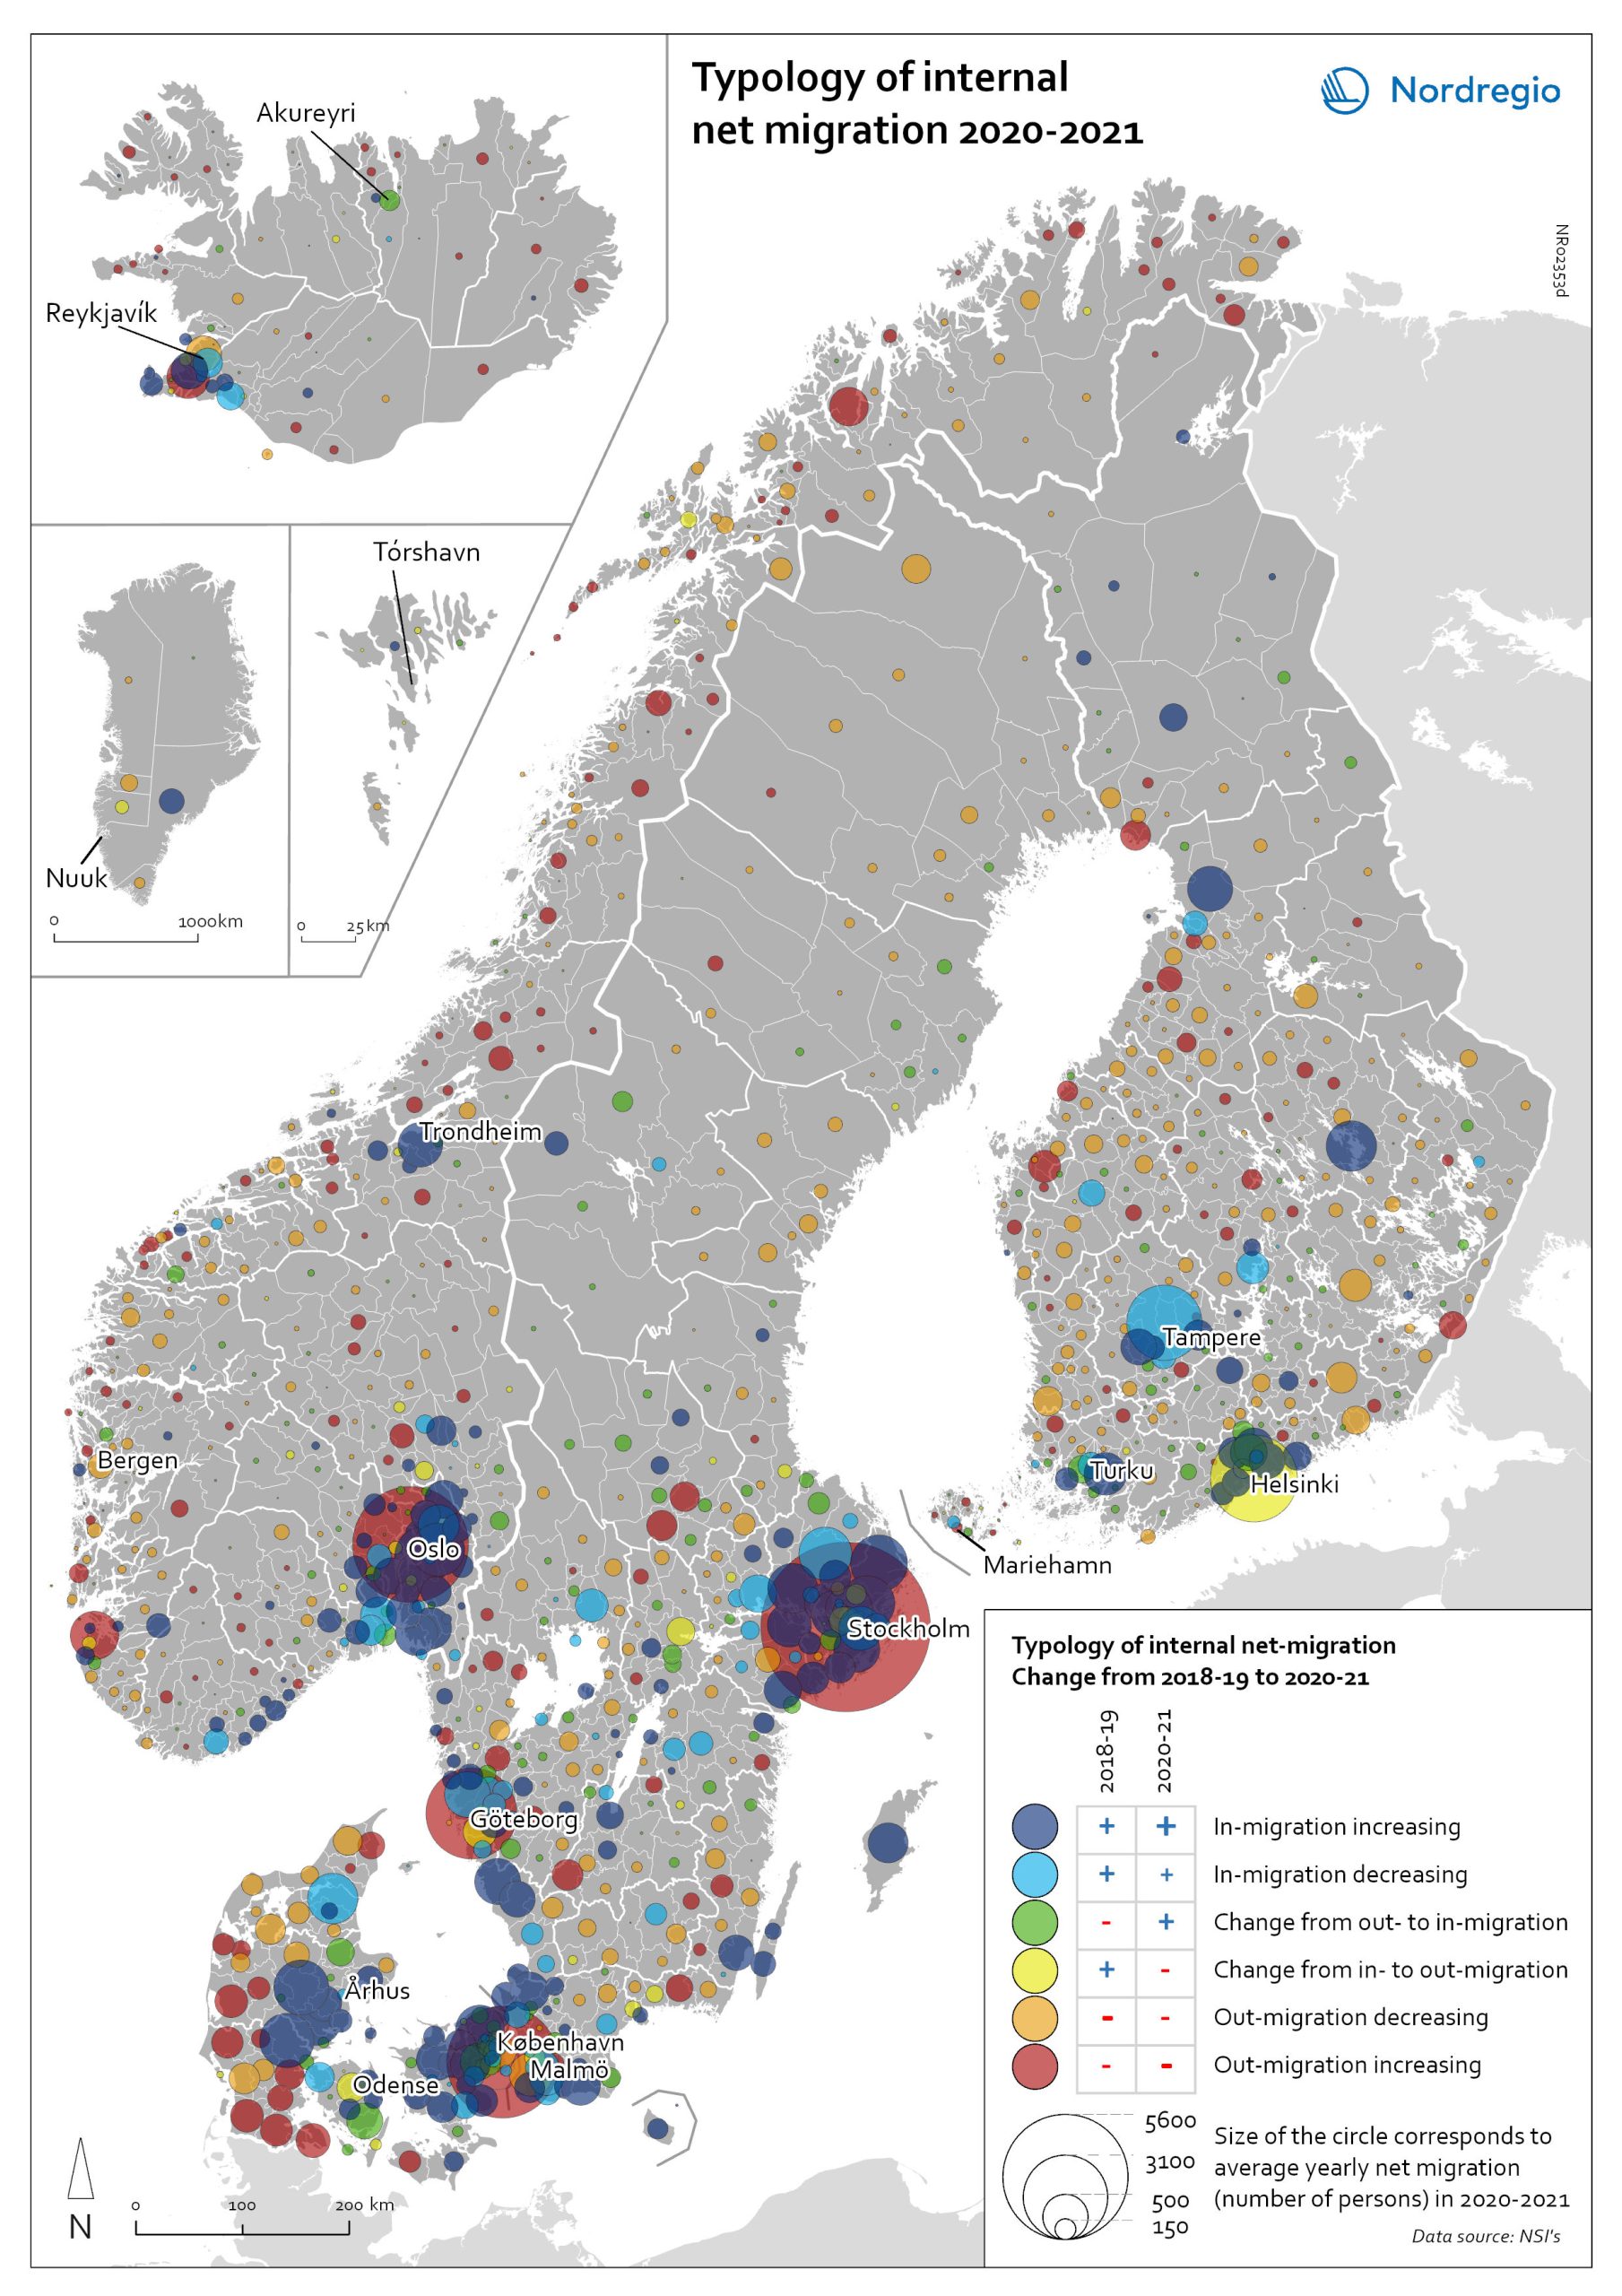
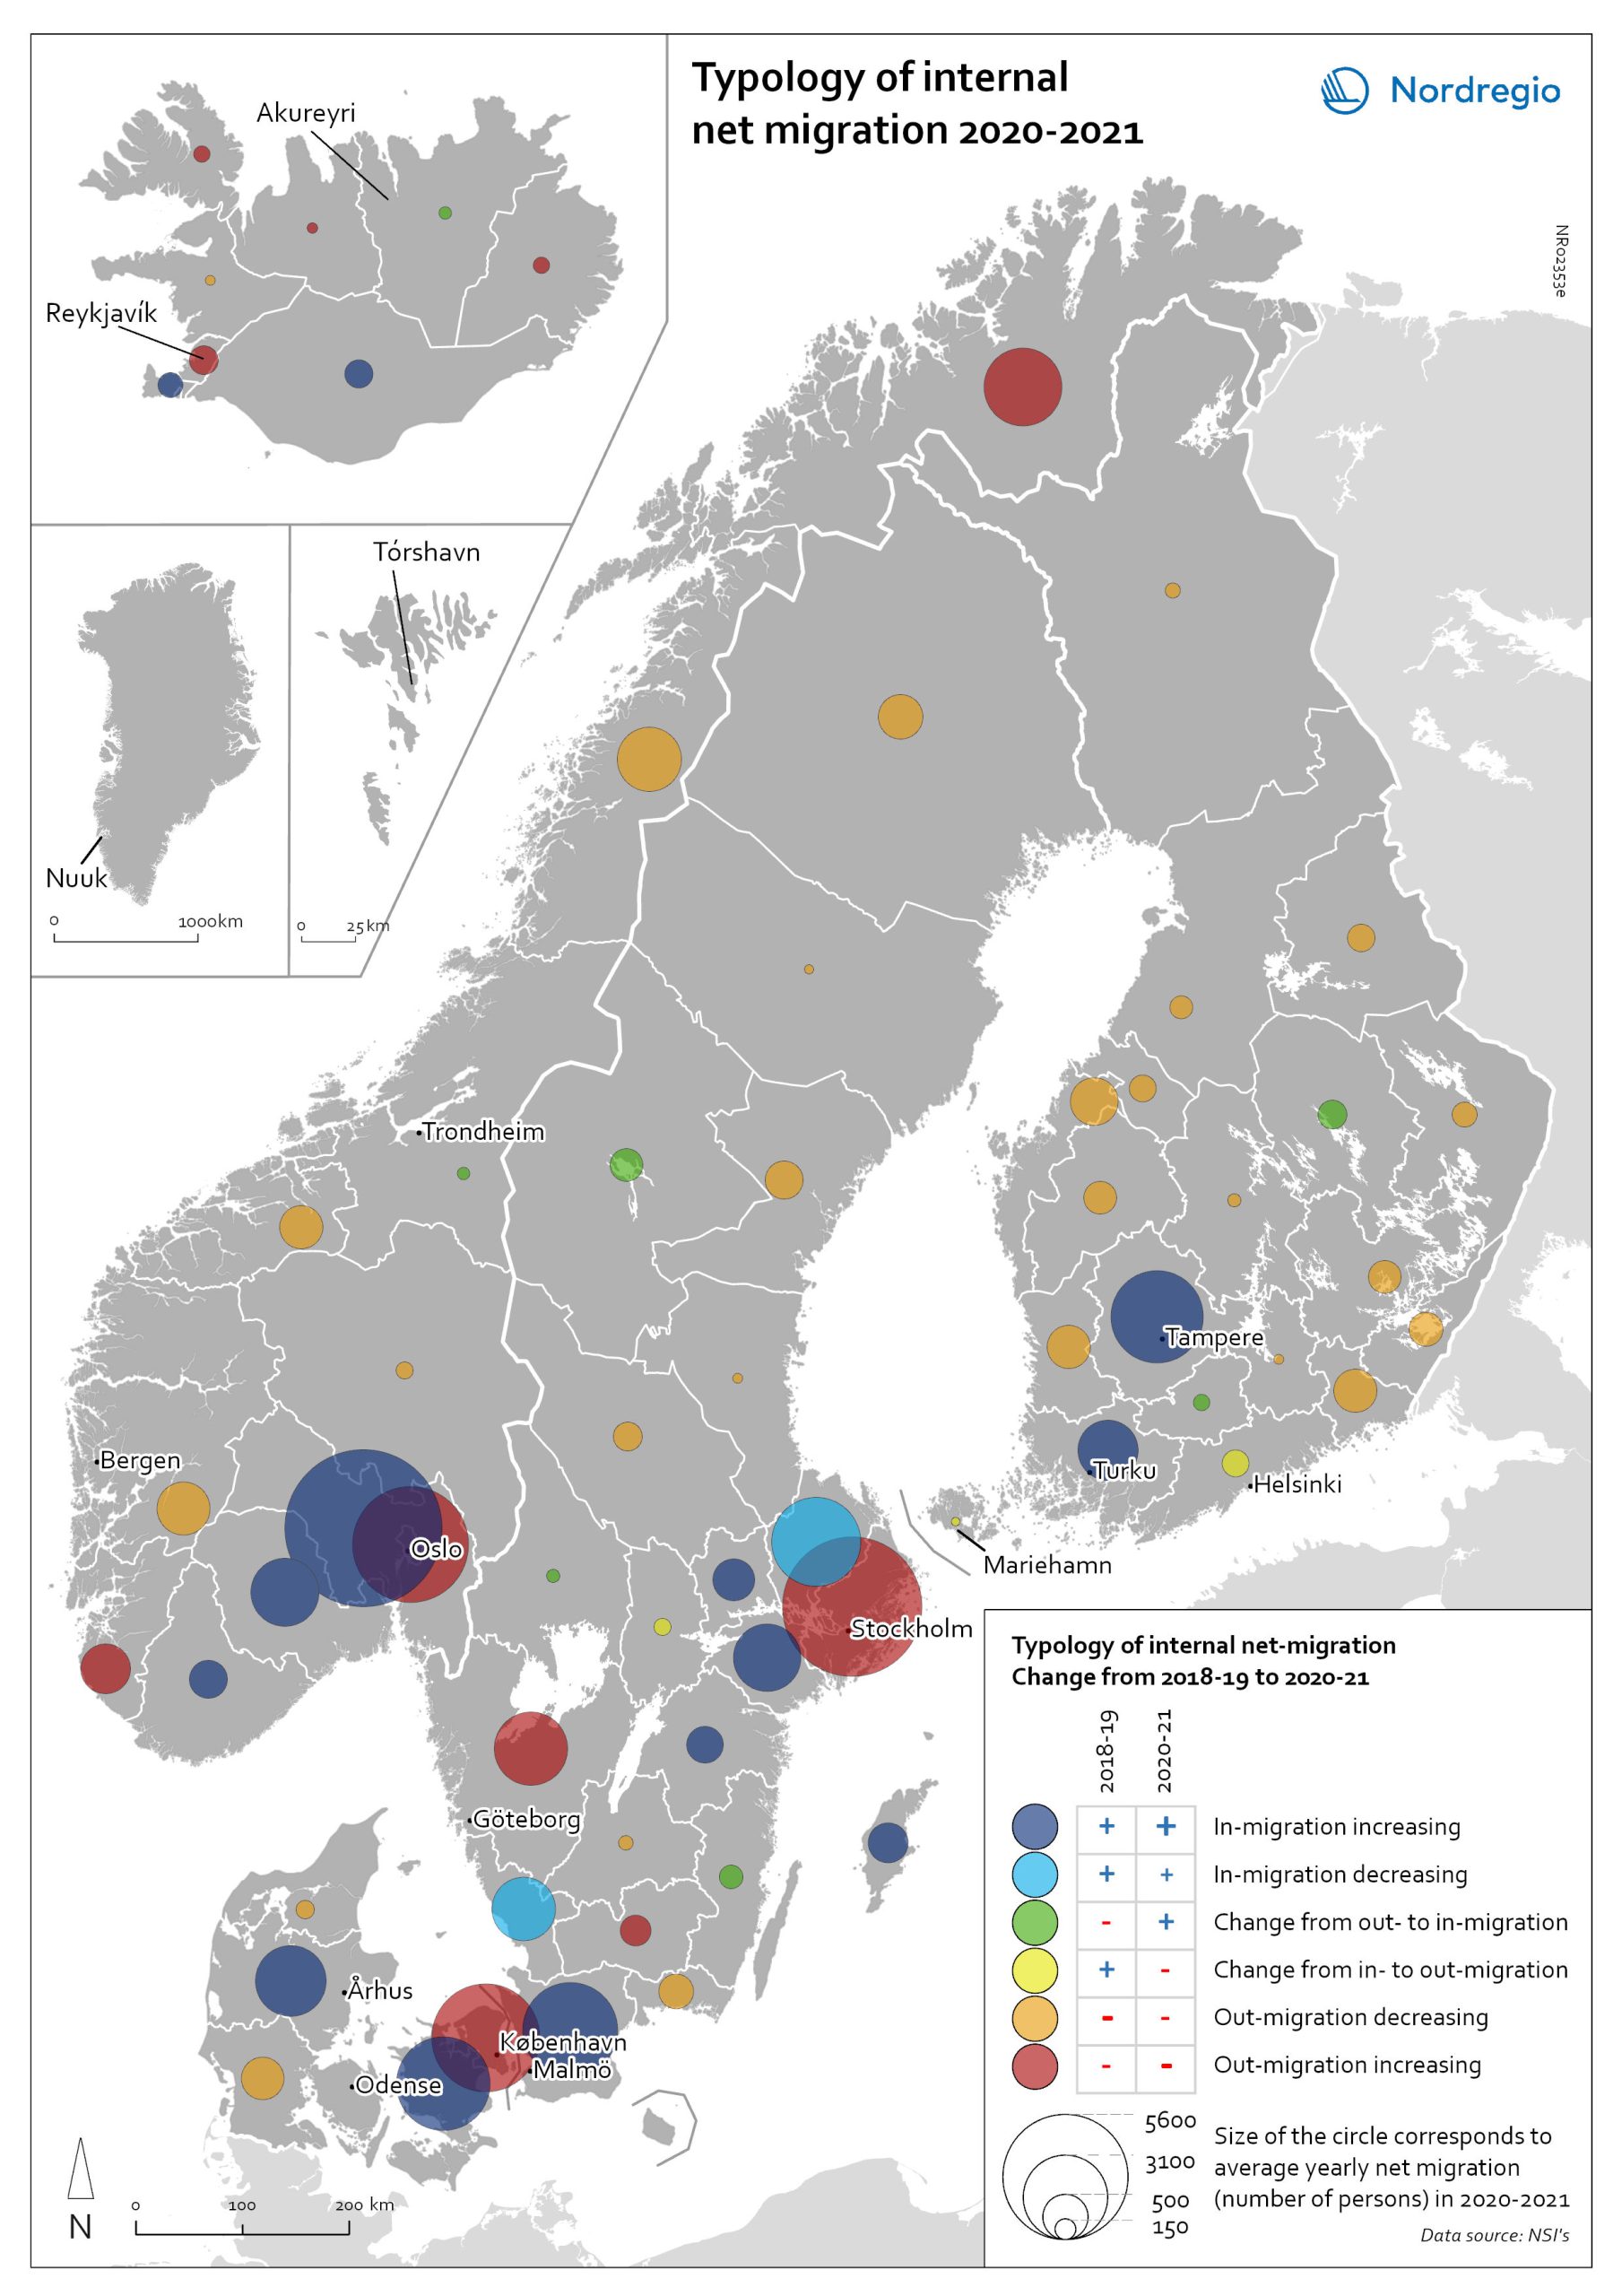
Typology of internal net migration 2020-2021
The map presents a typology of internal net migration by considering average annual internal net migration in 2020-2021 alongside the same figure for 2018-2019. The colours on the map correspond to six possible migration trajectories: Dark blue: Internal net in migration as an acceleration of an existing trend (net in-migration in 2020-2021 + increase compared to 2018-2019) Light blue: Internal net in migration but at a slower rate than previously (net in-migration in 2020-2021 + decrease compared to 2018-2019) Green: Internal net in migration as a new trend (net in-migration in 2020-2021 + change from net out-migration compared to 2018-2019) Yellow: Internal net out migration as a new trend (net out-migration in 2020-2021 + change from net in-migration compared to 2018-2019) Orange: Internal net out migration but at a slower rate than previously (net out-migration in 2020-2021 + decrease compared to 2018-2019) Red: Internal net out migration as a continuation of an existing trend (net out-migration in 2020-2021 + increase compared to 2018-2019) The patterns shown around the larger cities reinforces the message of increased suburbanisation as well as growth in smaller cities in proximity to large ones. In addition, the map shows that this is in many cases an accelerated (dark blue circles), or even new development (green circles). Interestingly, although accelerated by the pandemic, internal out migration from the capitals and other large cities was an existing trend. Helsinki stands out as an exception in this regard, having gone from positive to negative internal net migration (yellow circles). Similarly, slower rates of in migration are evident in the two next largest Finnish cities, Tampere and Turku (light blue circles). Akureyri (Iceland) provides an interesting example of an intermediate city which began to attract residents during the pandemic despite experiencing internal outmigration prior. From a rural perspective there are…
- 2022 May
- Demography
- Migration
- Nordic Region
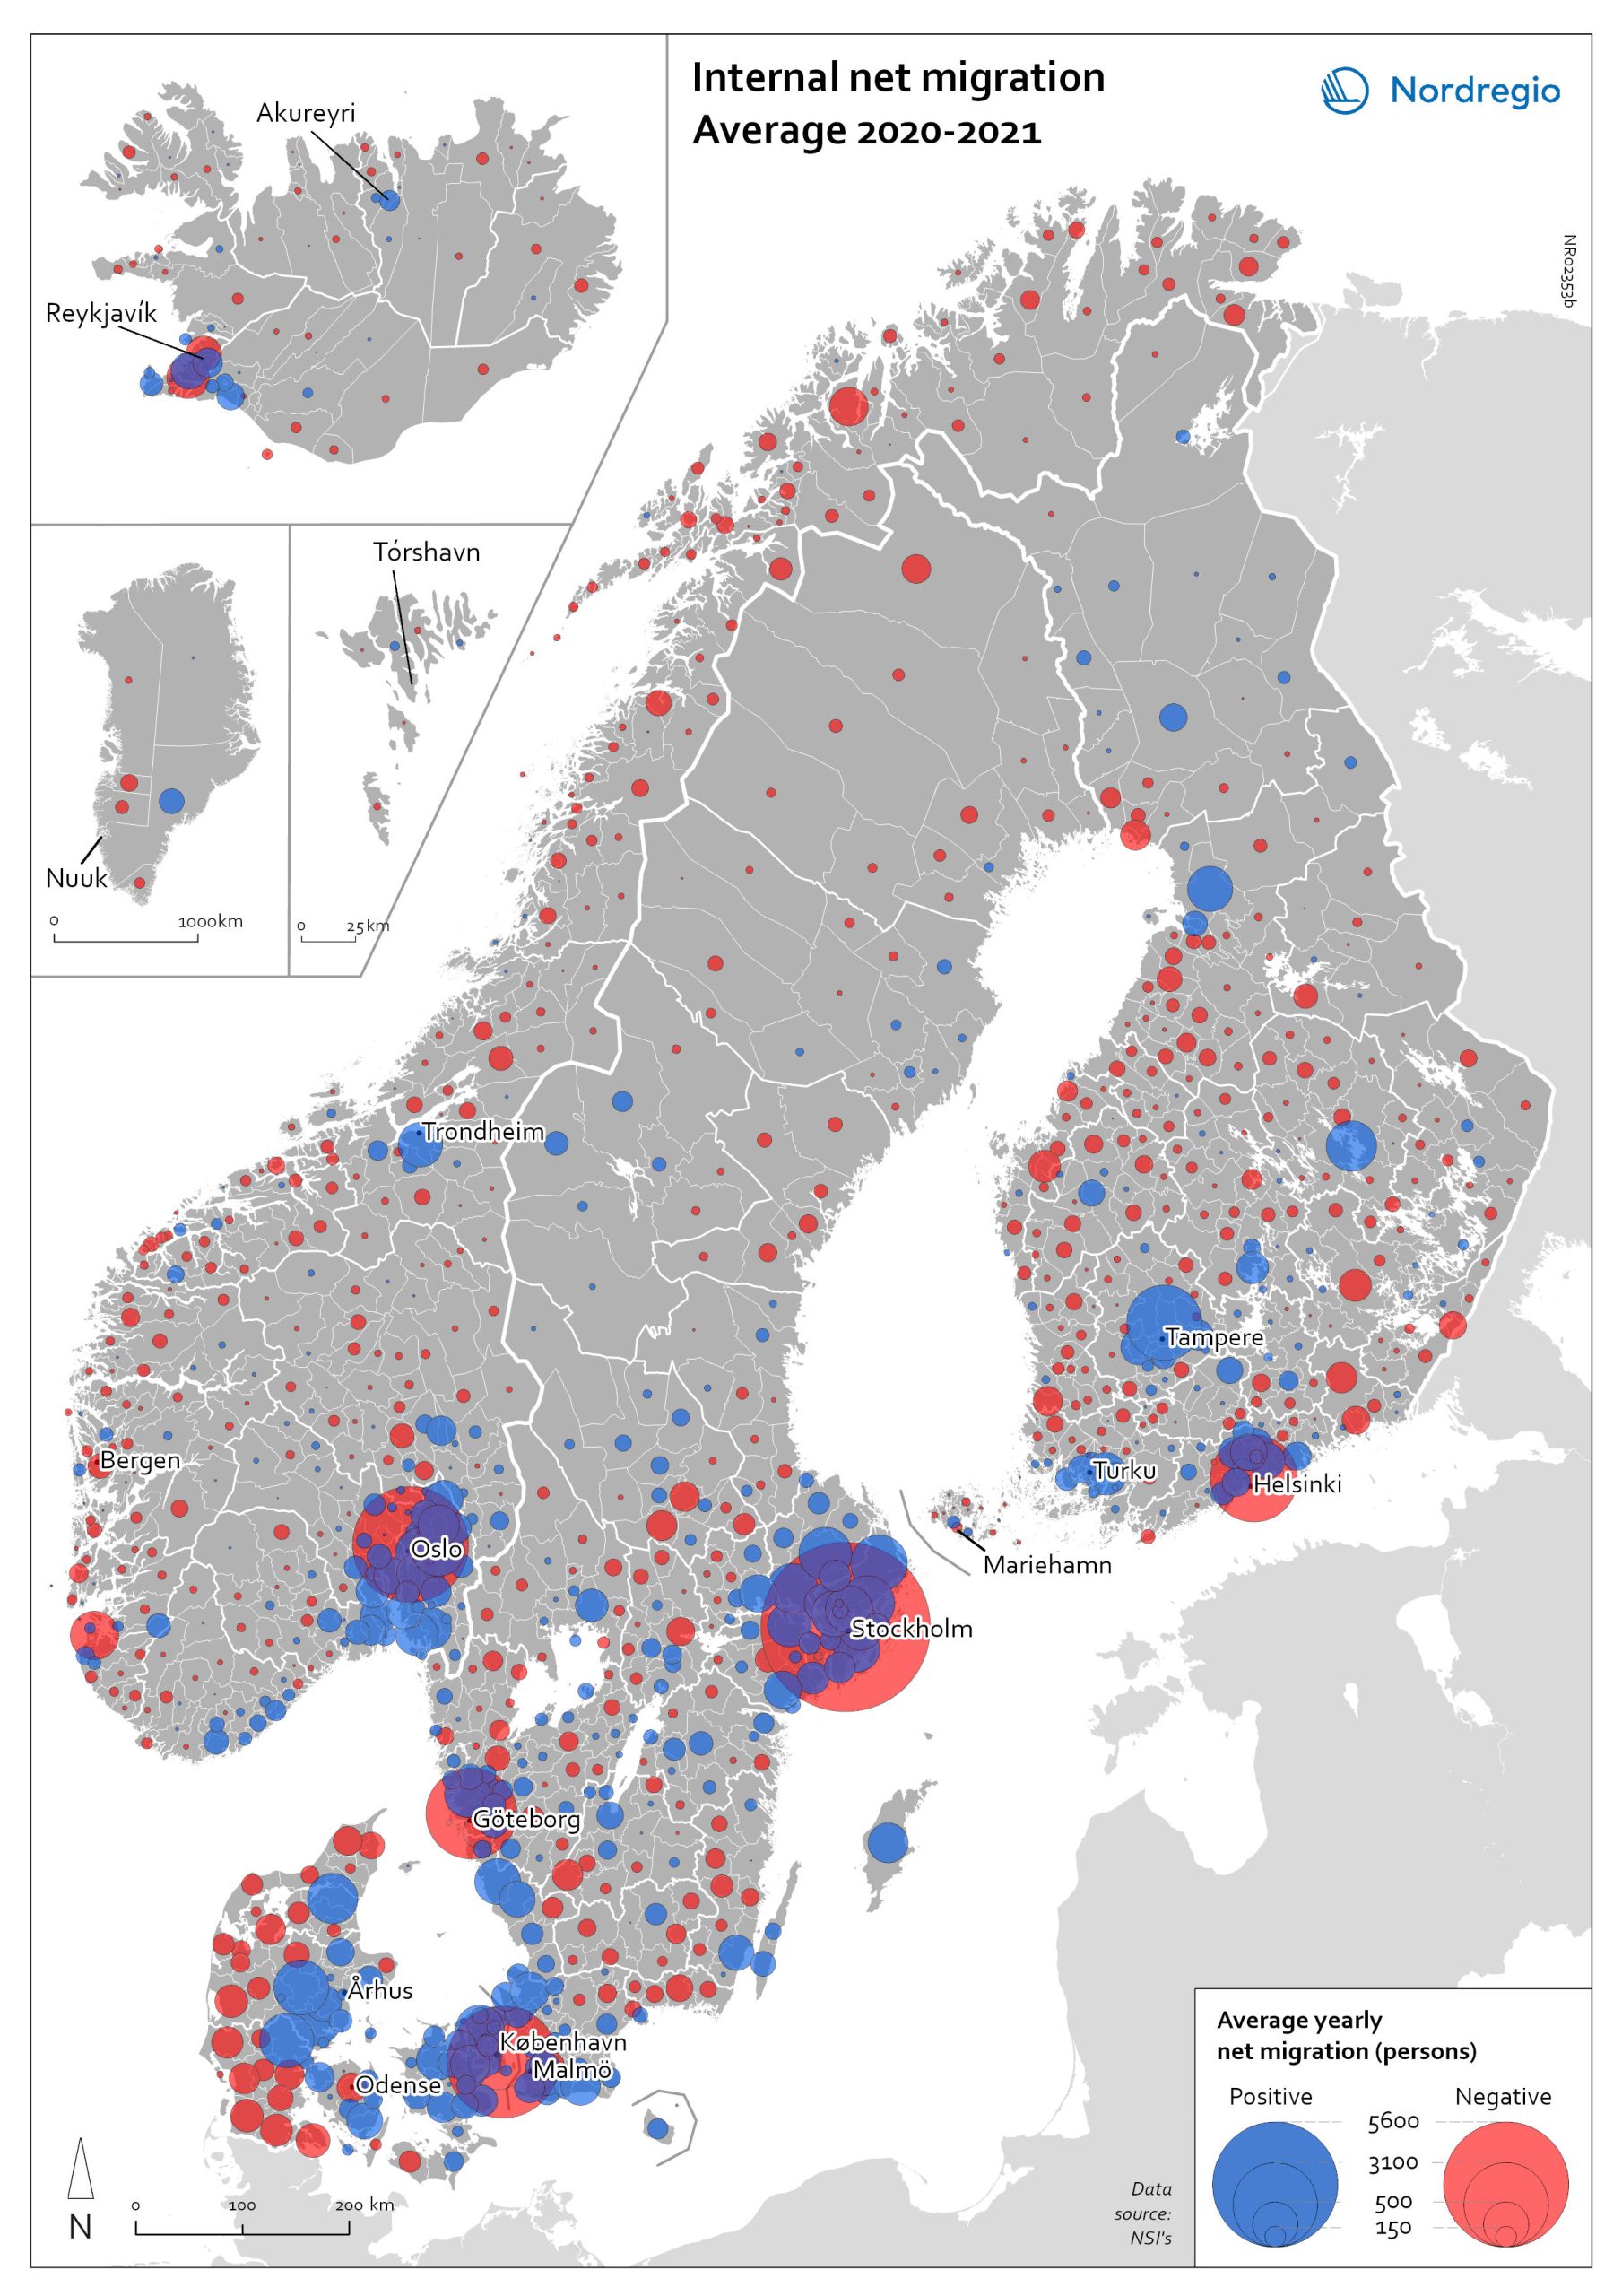
Internal net migration 2020-2021
The map shows the average internal net migration in 2020 and 2021 for Nordic municipalities. Blue dots indicate positive internal net migration (more people moving in than out) and red dots indicate negative internal net migration (more people moving out than in), while the size of the dots represents the extent of the positive or negative trend. Internal migration refers to a change of address within the same country. The map shows substantial outmigration from the Nordic capitals, as well as from Gothenburg and Malmö in Sweden. Alongside increased suburbanisation, the map also provides some evidence of growth in medium-sized cities and smaller cities within commuting distance of larger cities.
- 2022 May
- Demography
- Migration
- Nordic Region
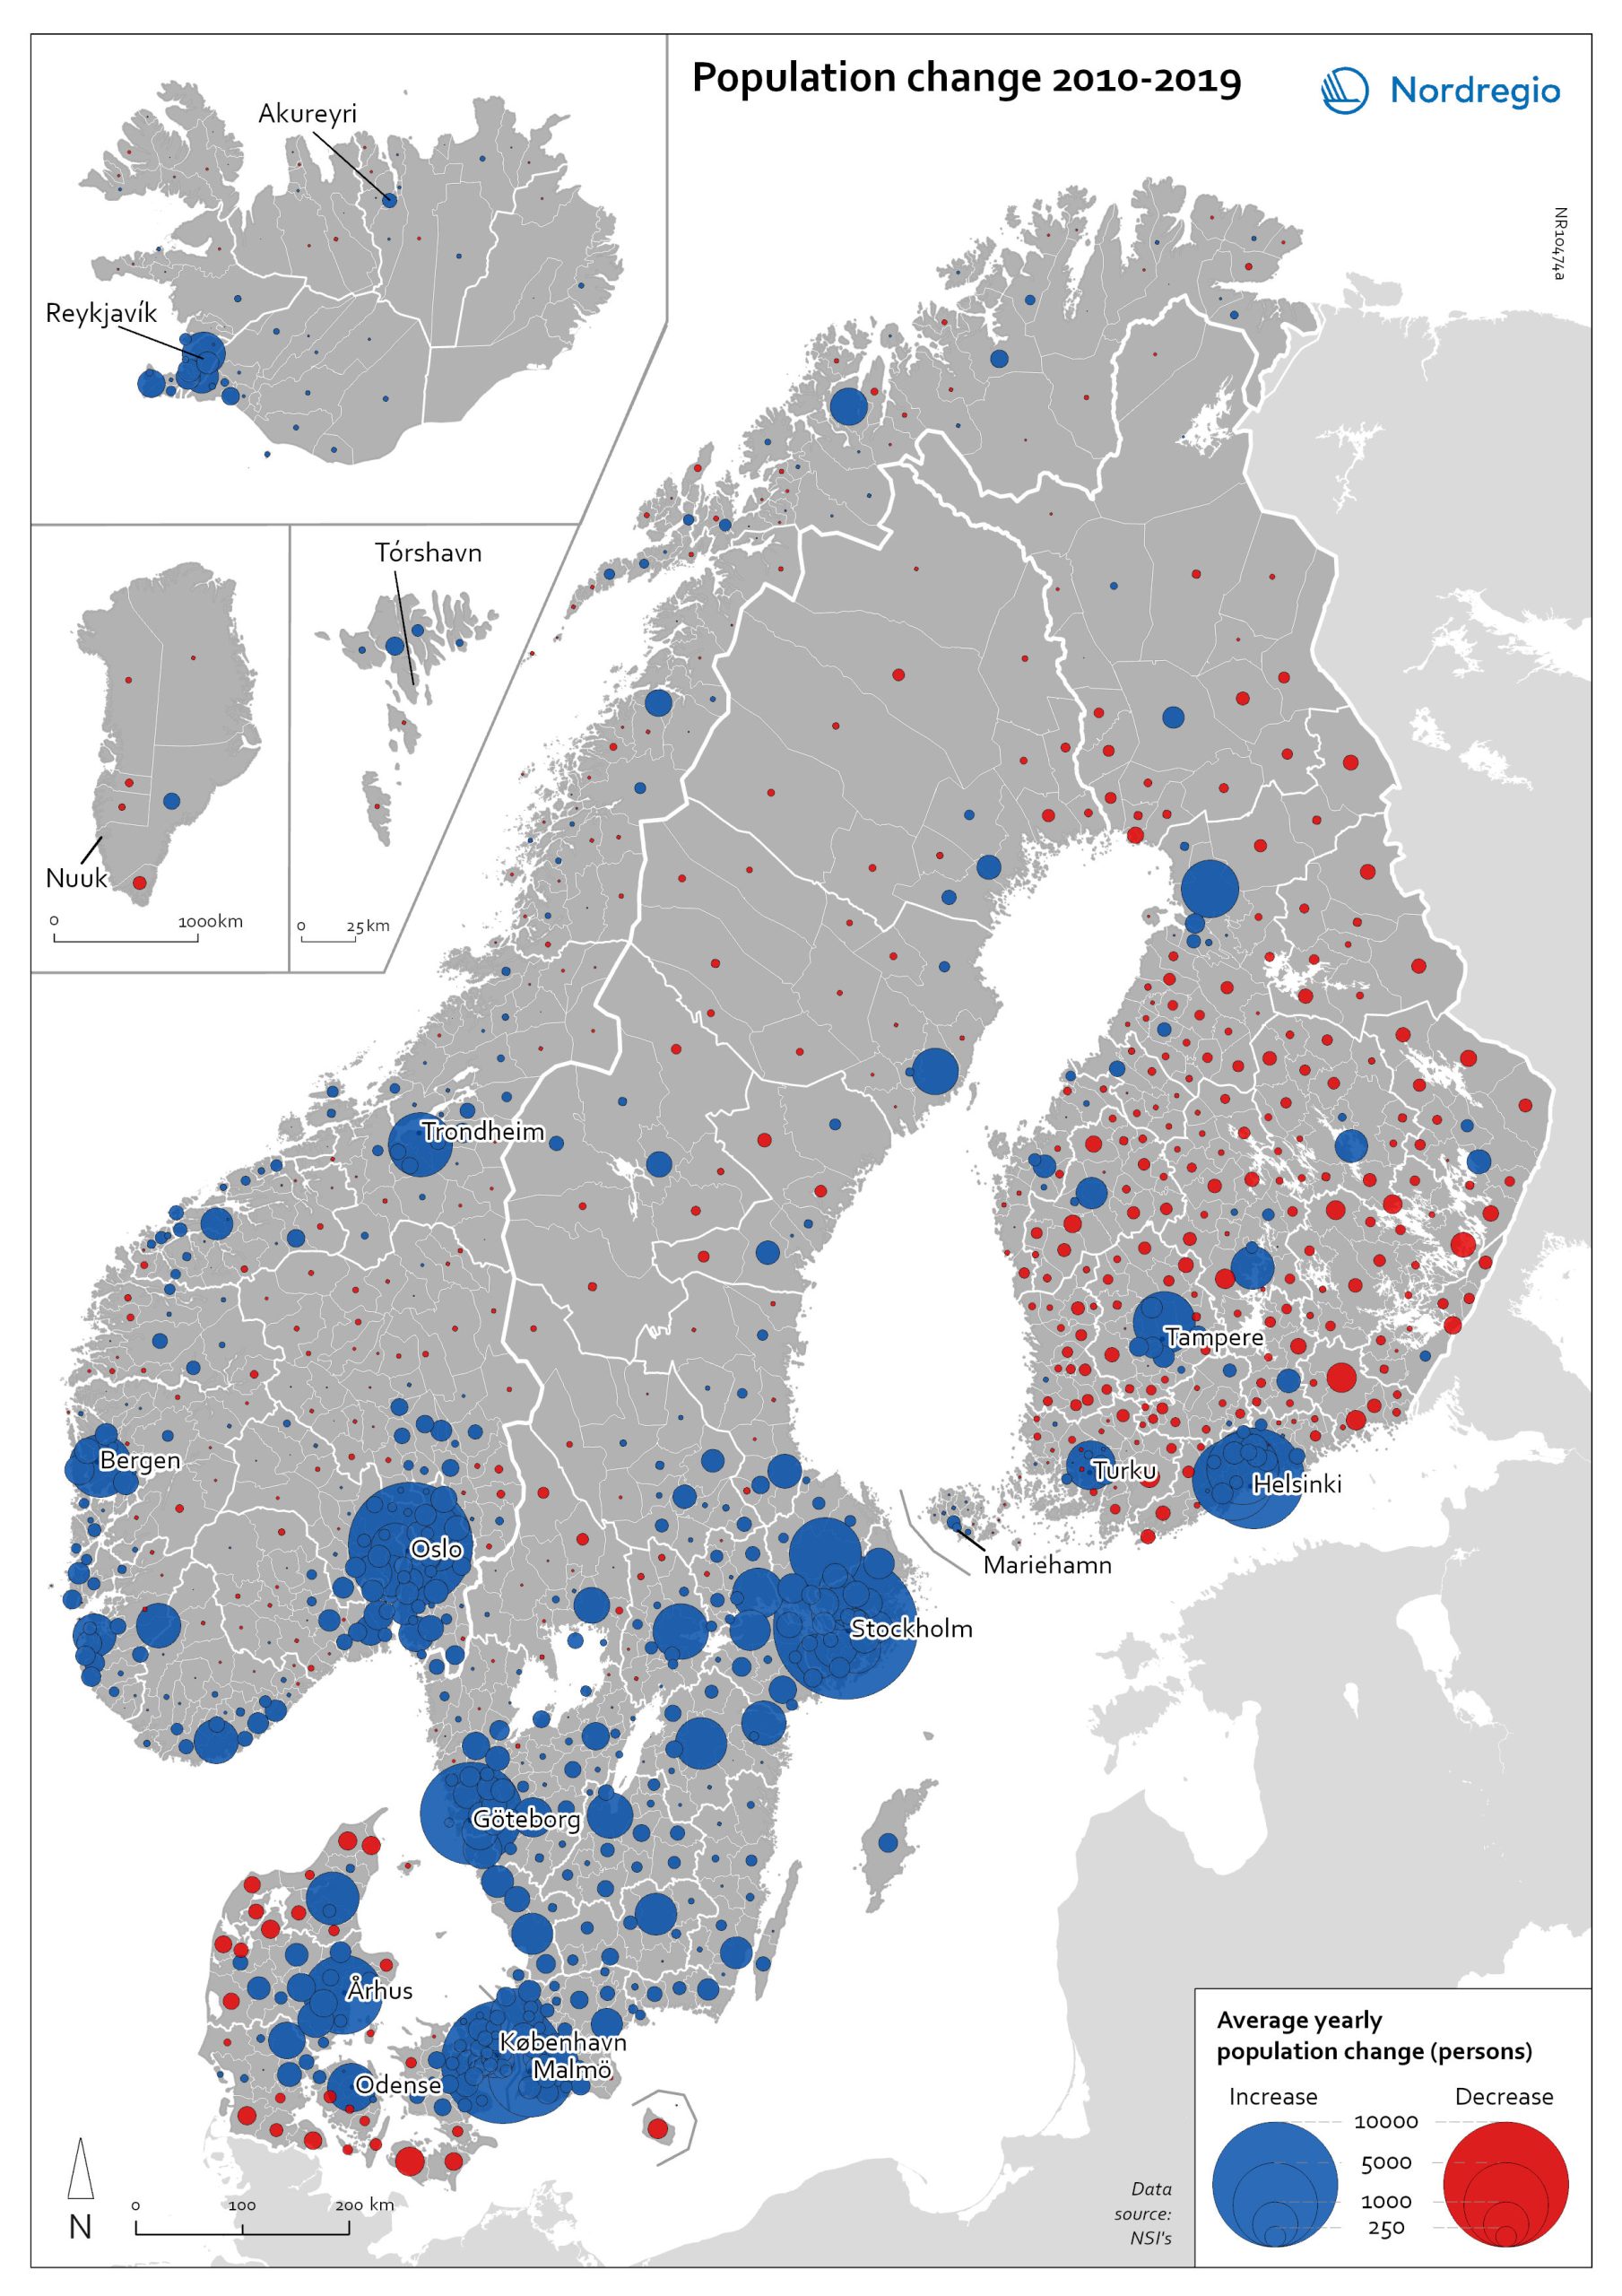
Population change 2010-2019
The map shows the type (positive or negative) and size of population change from 2010 to 2019 in all nordic municipalities. In Finland, Denmark, and Greenland there is a clear pattern of population growth in and around the larger cities and population decline in rural areas. Geographical and administrative differences mean that a much larger number of rural municipalities in Finland are dealing with population decline. Sweden experienced substantial population growth between 2010 and 2019, primarily due to high levels of international immigration. As a result, many rural areas also experienced population growth, particularly in the south of Sweden. However, in the more sparsely populated municipalities in the north of Sweden, the pattern is somewhat similar to that observed in Denmark and Finland, albeit with population decline in lower absolute numbers. Both Iceland and the Faroe Islands experienced substantial growth of their tourism industries within the period. This enabled some rural areas to maintain or even grow their populations. Norway exhibits more balanced population development in general, with a mix of population growth and decline in rural areas throughout the country.
- 2022 May
- Demography
- Migration
- Nordic Region
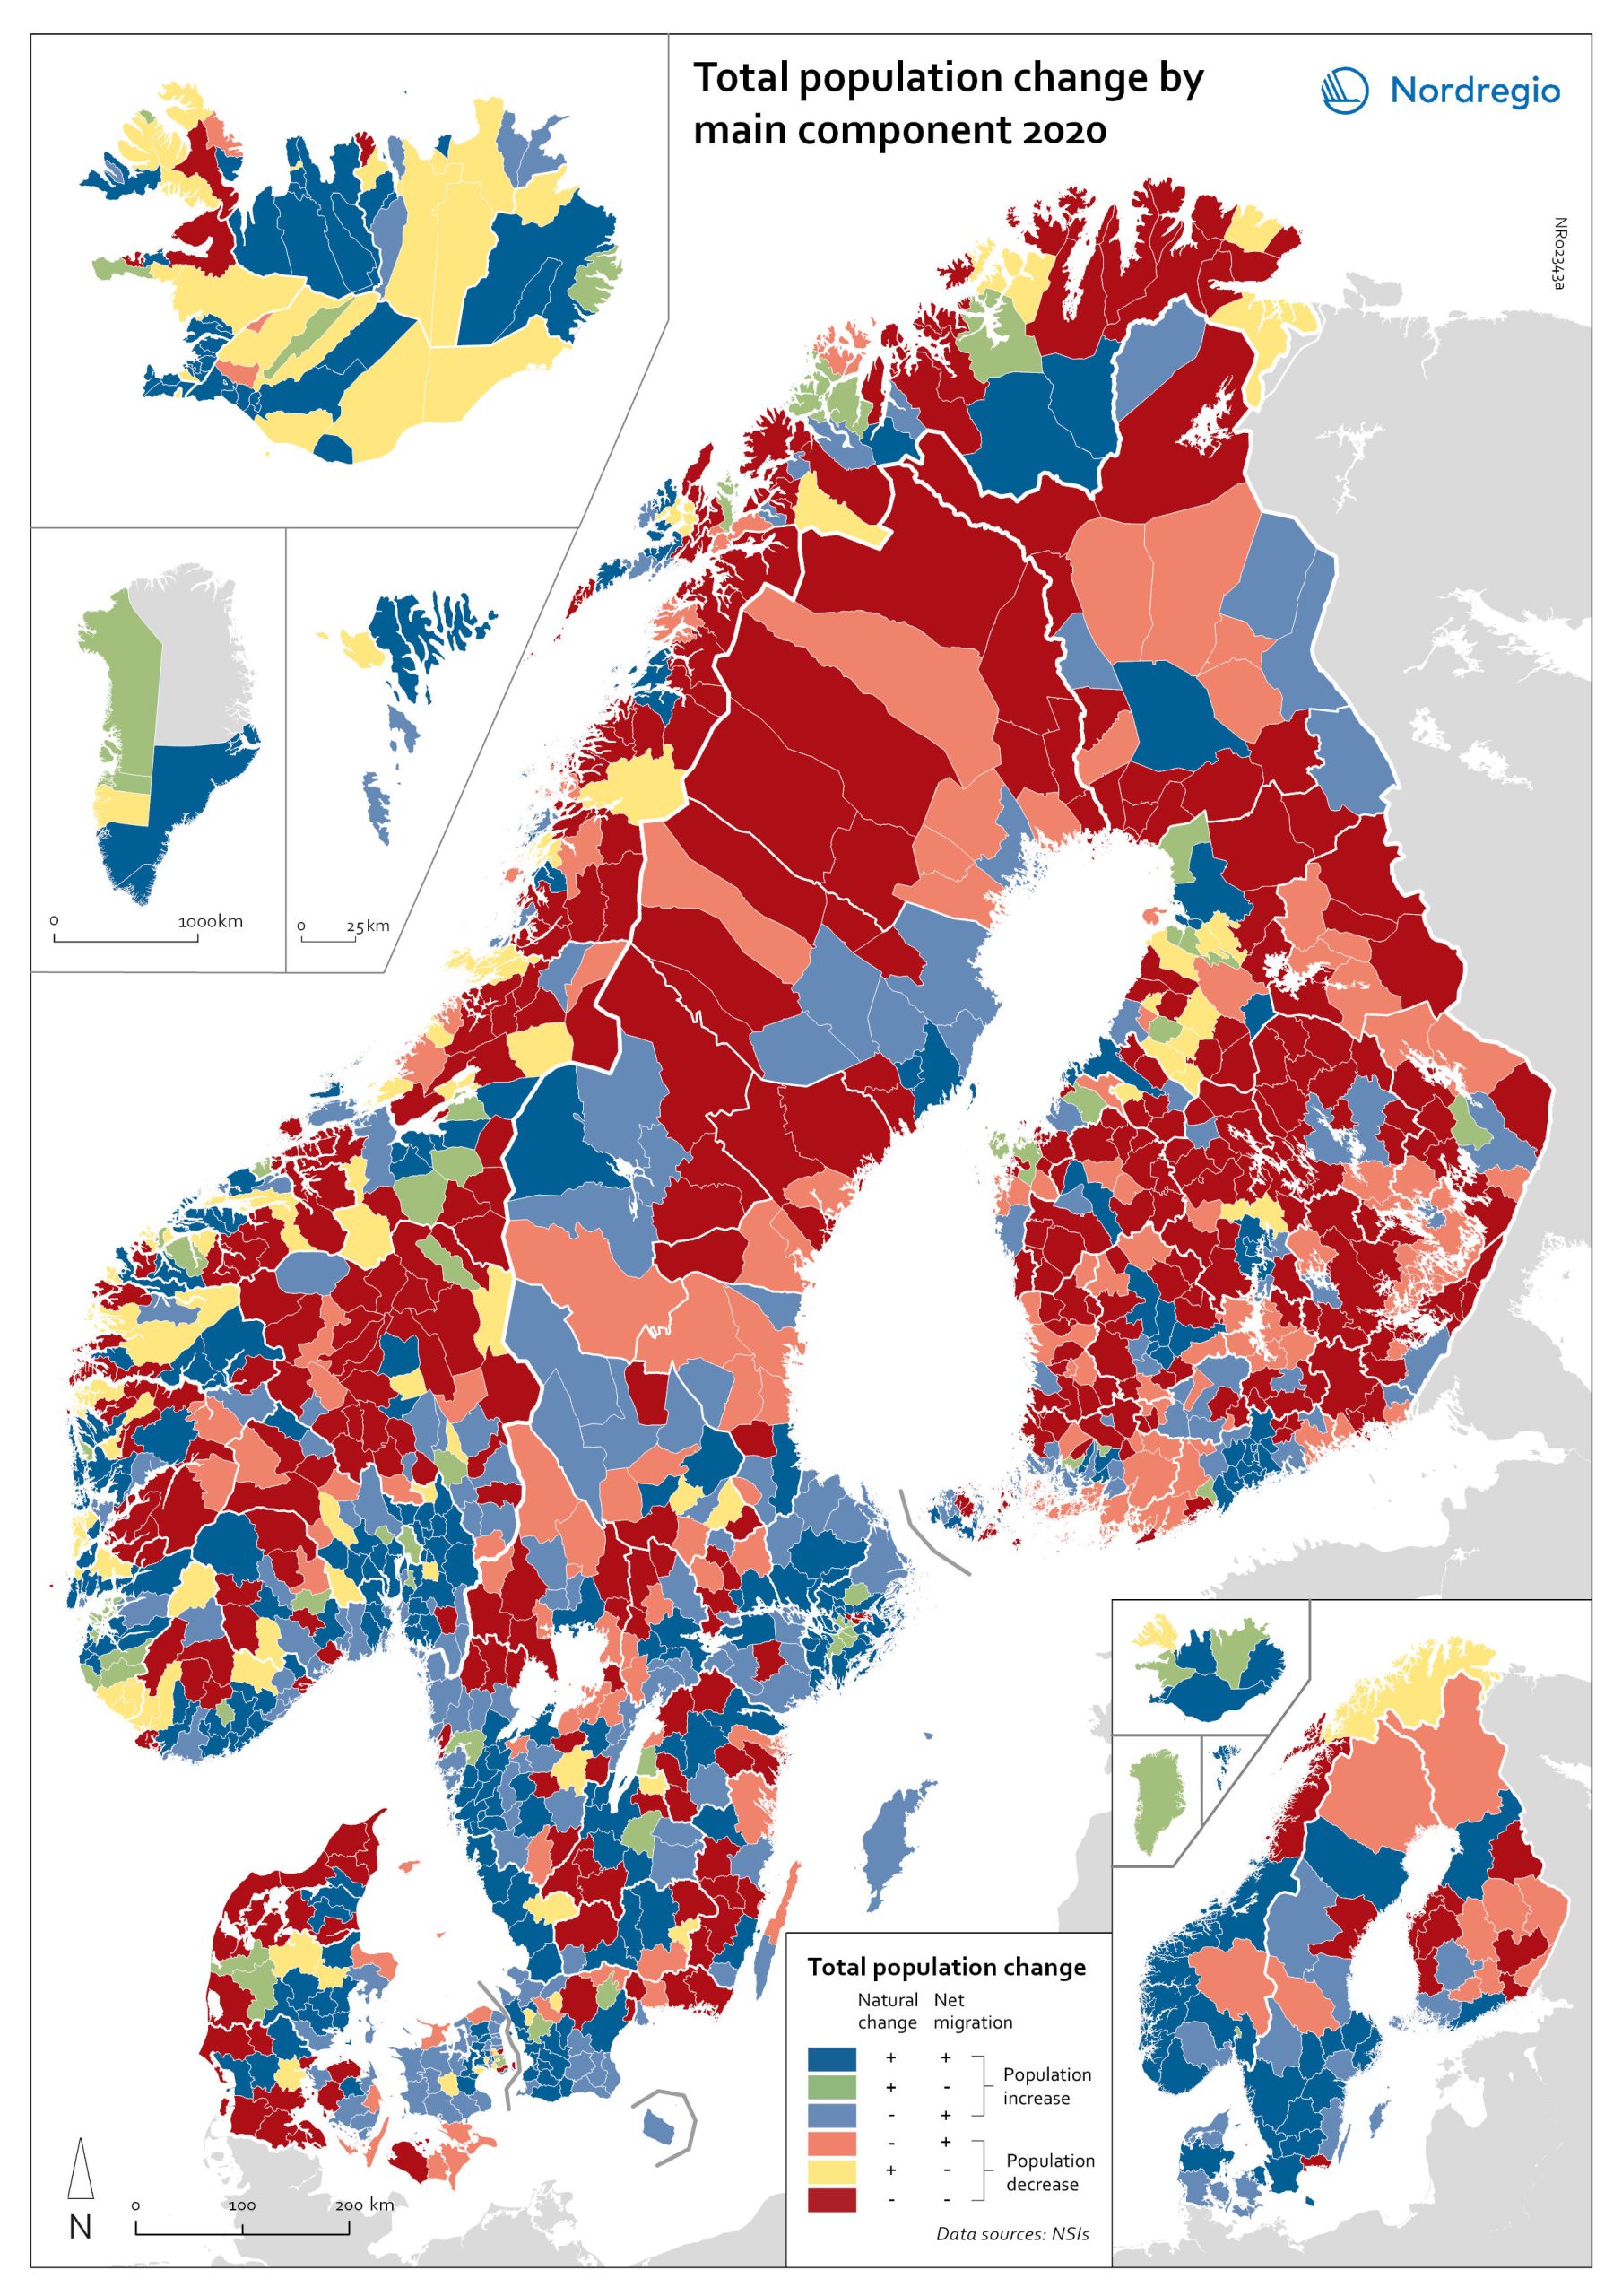
Population change by component 2020
The map shows the population change by component 2020. The map is related to the same map showing regional and municipal patterns in population change by component in 2010-2019. Regions are divided into six classes of population change. Those in shades of blue or green are where the population has increased, and those in shades of red or yellow are where the population has declined. At the regional level (see small inset map), all in Denmark, all in the Faroes, most in southern Norway, southern Sweden, all but one in Iceland, all of Greenland, and a few around the capital in Helsinki had population increases in 2010-2019. Most regions in the north of Norway, Sweden, and Finland had population declines in 2010-2019. Many other regions in southern and eastern Finland also had population declines in 2010-2019, mainly because the country had more deaths than births, a trend that pre-dated the pandemic. In 2020, there were many more regions in red where populations were declining due to both natural decrease and net out-migration. At the municipal level, a more varied pattern emerges, with municipalities having quite different trends than the regions of which they form part. Many regions in western Denmark are declining because of negative natural change and outmigration. Many smaller municipalities in Norway and Sweden saw population decline from both negative natural increase and out-migration despite their regions increasing their populations. Many smaller municipalities in Finland outside the three big cities of Helsinki, Turku, and Tampere also saw population decline from both components. A similar pattern took place at the municipal level in 2020 of there being many more regions in red than in the previous decade.
- 2022 March
- Demography
- Migration
- Nordic Region
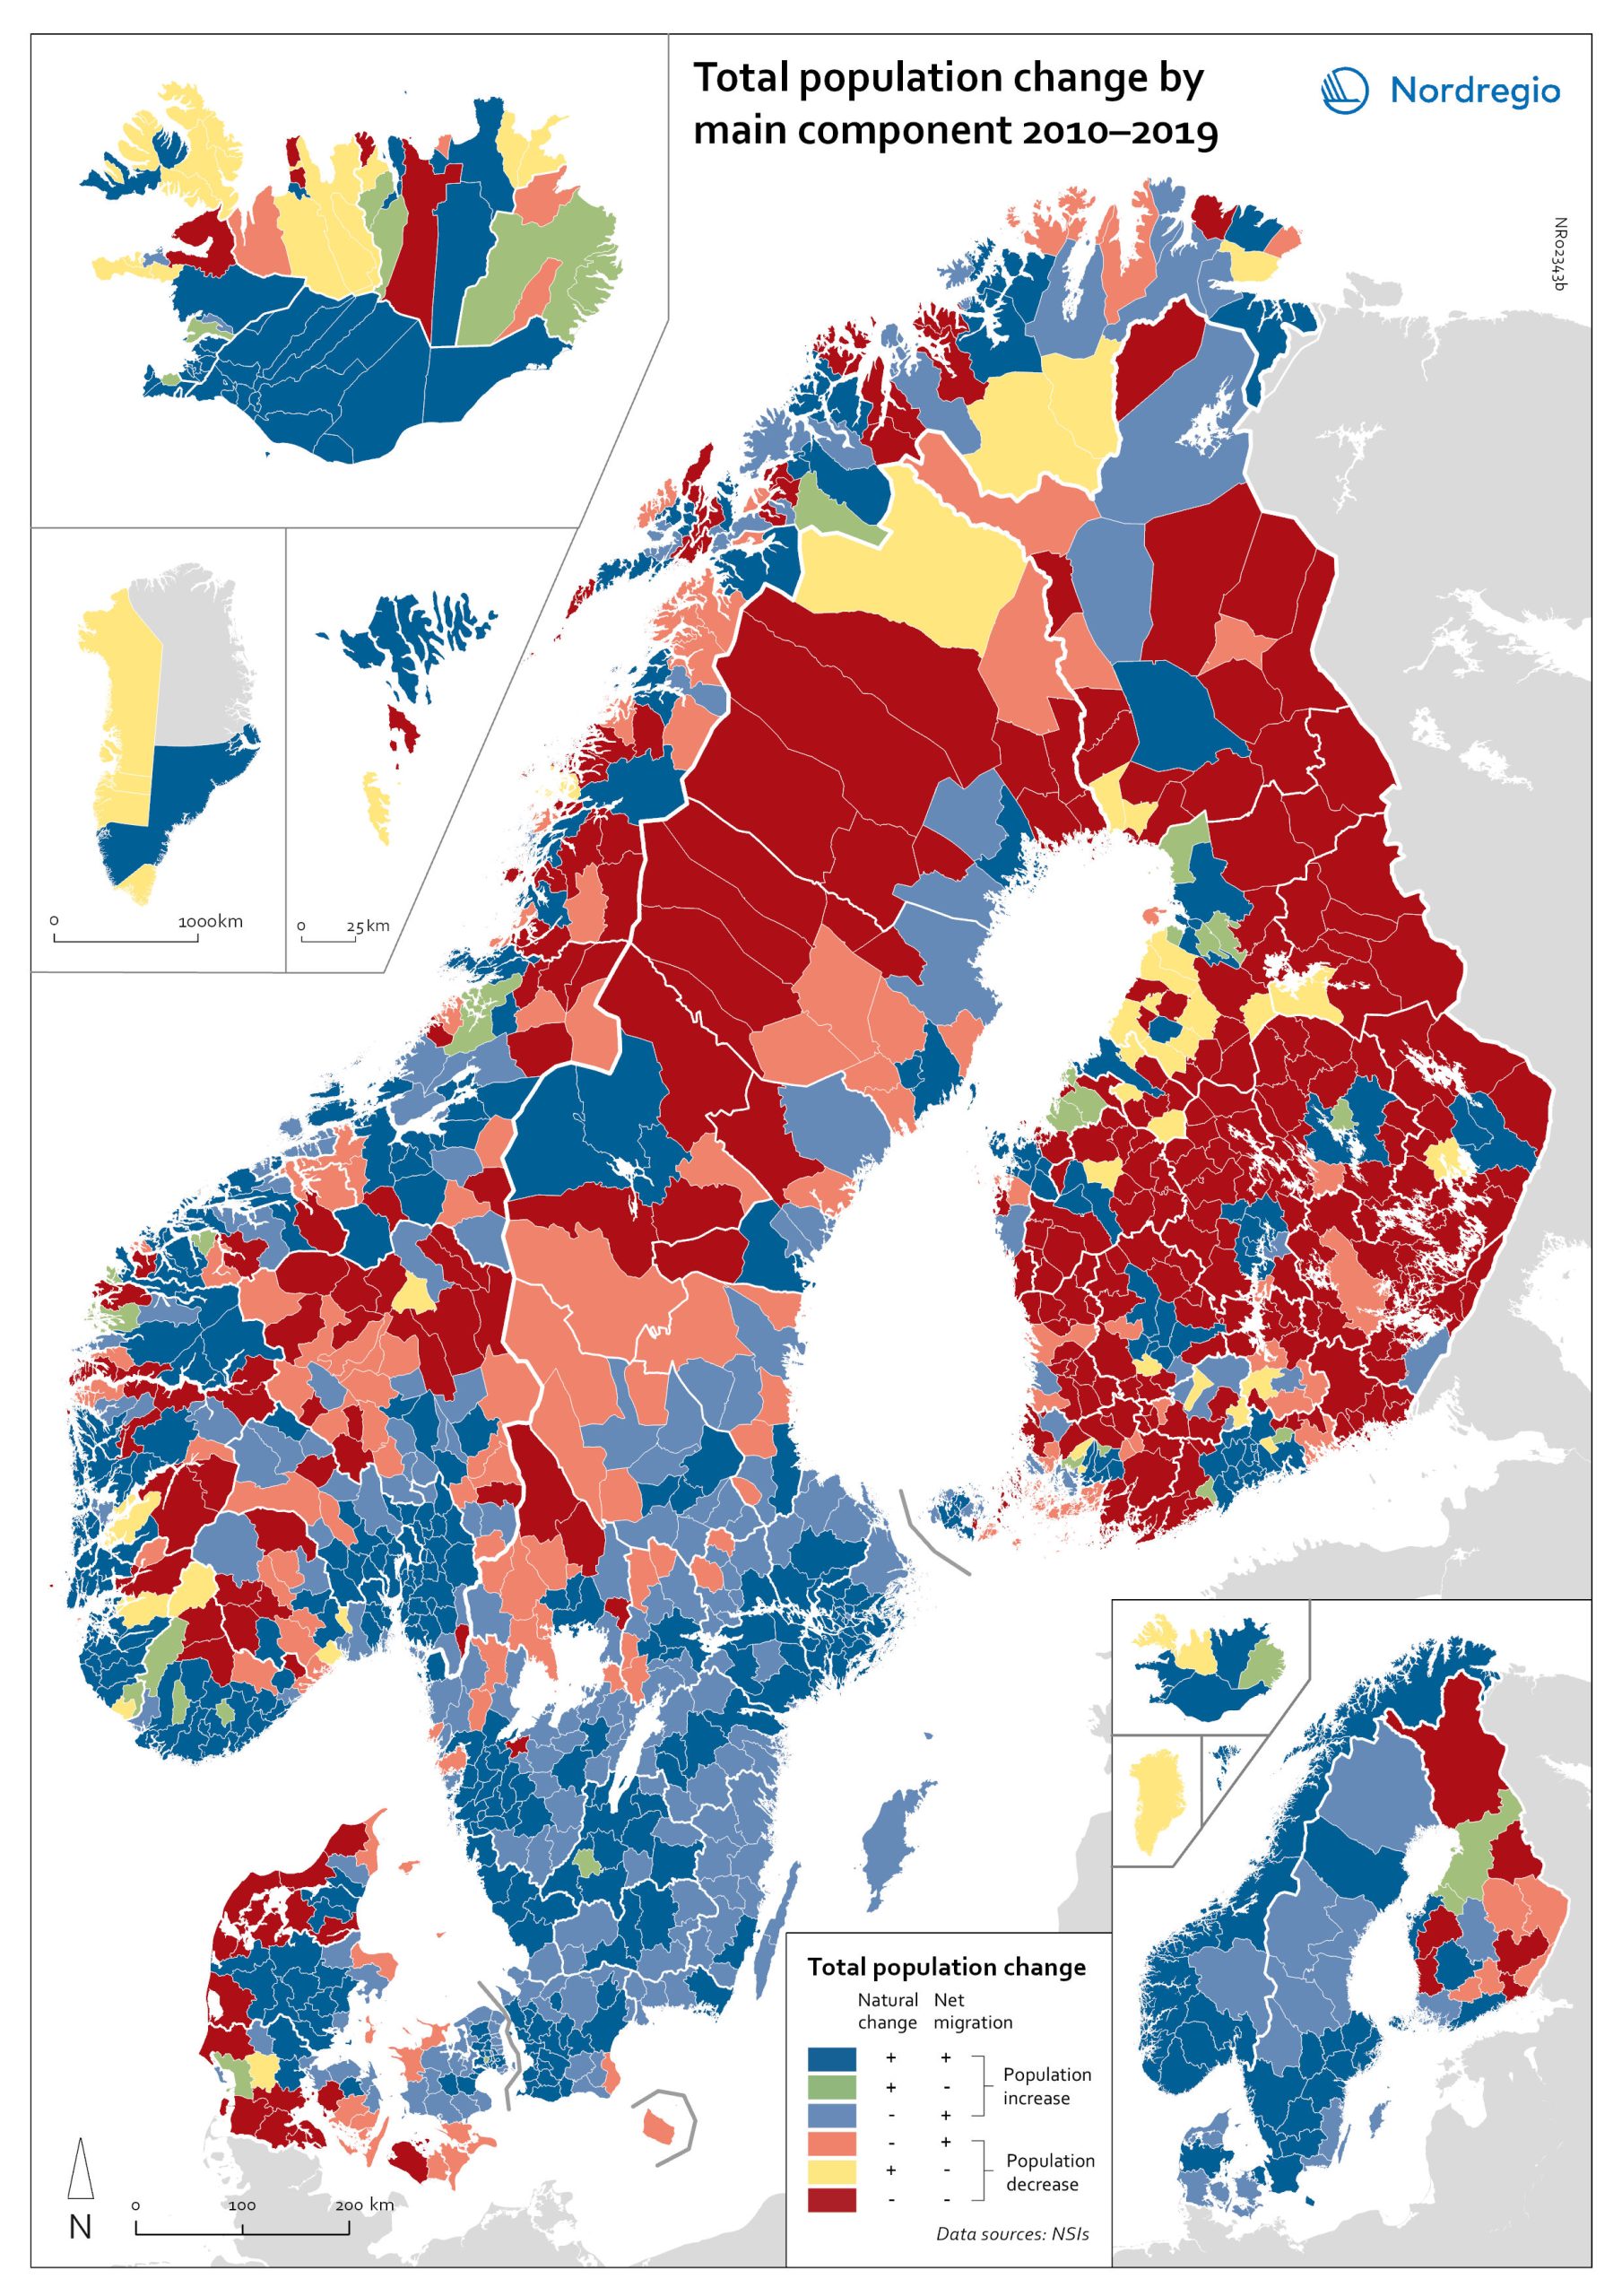
Population change by component 2010-2019
The map shows the population change by component 2010-2019. The map is related to the same map showing regional and municipal patterns in population change by component in 2020. Regions are divided into six classes of population change. Those in shades of blue or green are where the population has increased, and those in shades of red or yellow are where the population has declined. At the regional level (see small inset map), all in Denmark, all in the Faroes, most in southern Norway, southern Sweden, all but one in Iceland, all of Greenland, and a few around the capital in Helsinki had population increases in 2010-2019. Most regions in the north of Norway, Sweden, and Finland had population declines in 2010-2019. Many other regions in southern and eastern Finland also had population declines in 2010-2019, mainly because the country had more deaths than births, a trend that pre-dated the pandemic. In 2020, there were many more regions in red where populations were declining due to both natural decrease and net out-migration. At the municipal level, a more varied pattern emerges, with municipalities having quite different trends than the regions of which they form part. Many regions in western Denmark are declining because of negative natural change and outmigration. Many smaller municipalities in Norway and Sweden saw population decline from both negative natural increase and out-migration despite their regions increasing their populations. Many smaller municipalities in Finland outside the three big cities of Helsinki, Turku, and Tampere also saw population decline from both components. A similar pattern took place at the municipal level in 2020 of there being many more regions in red than in the previous decade.
- 2022 March
- Demography
- Migration
- Nordic Region
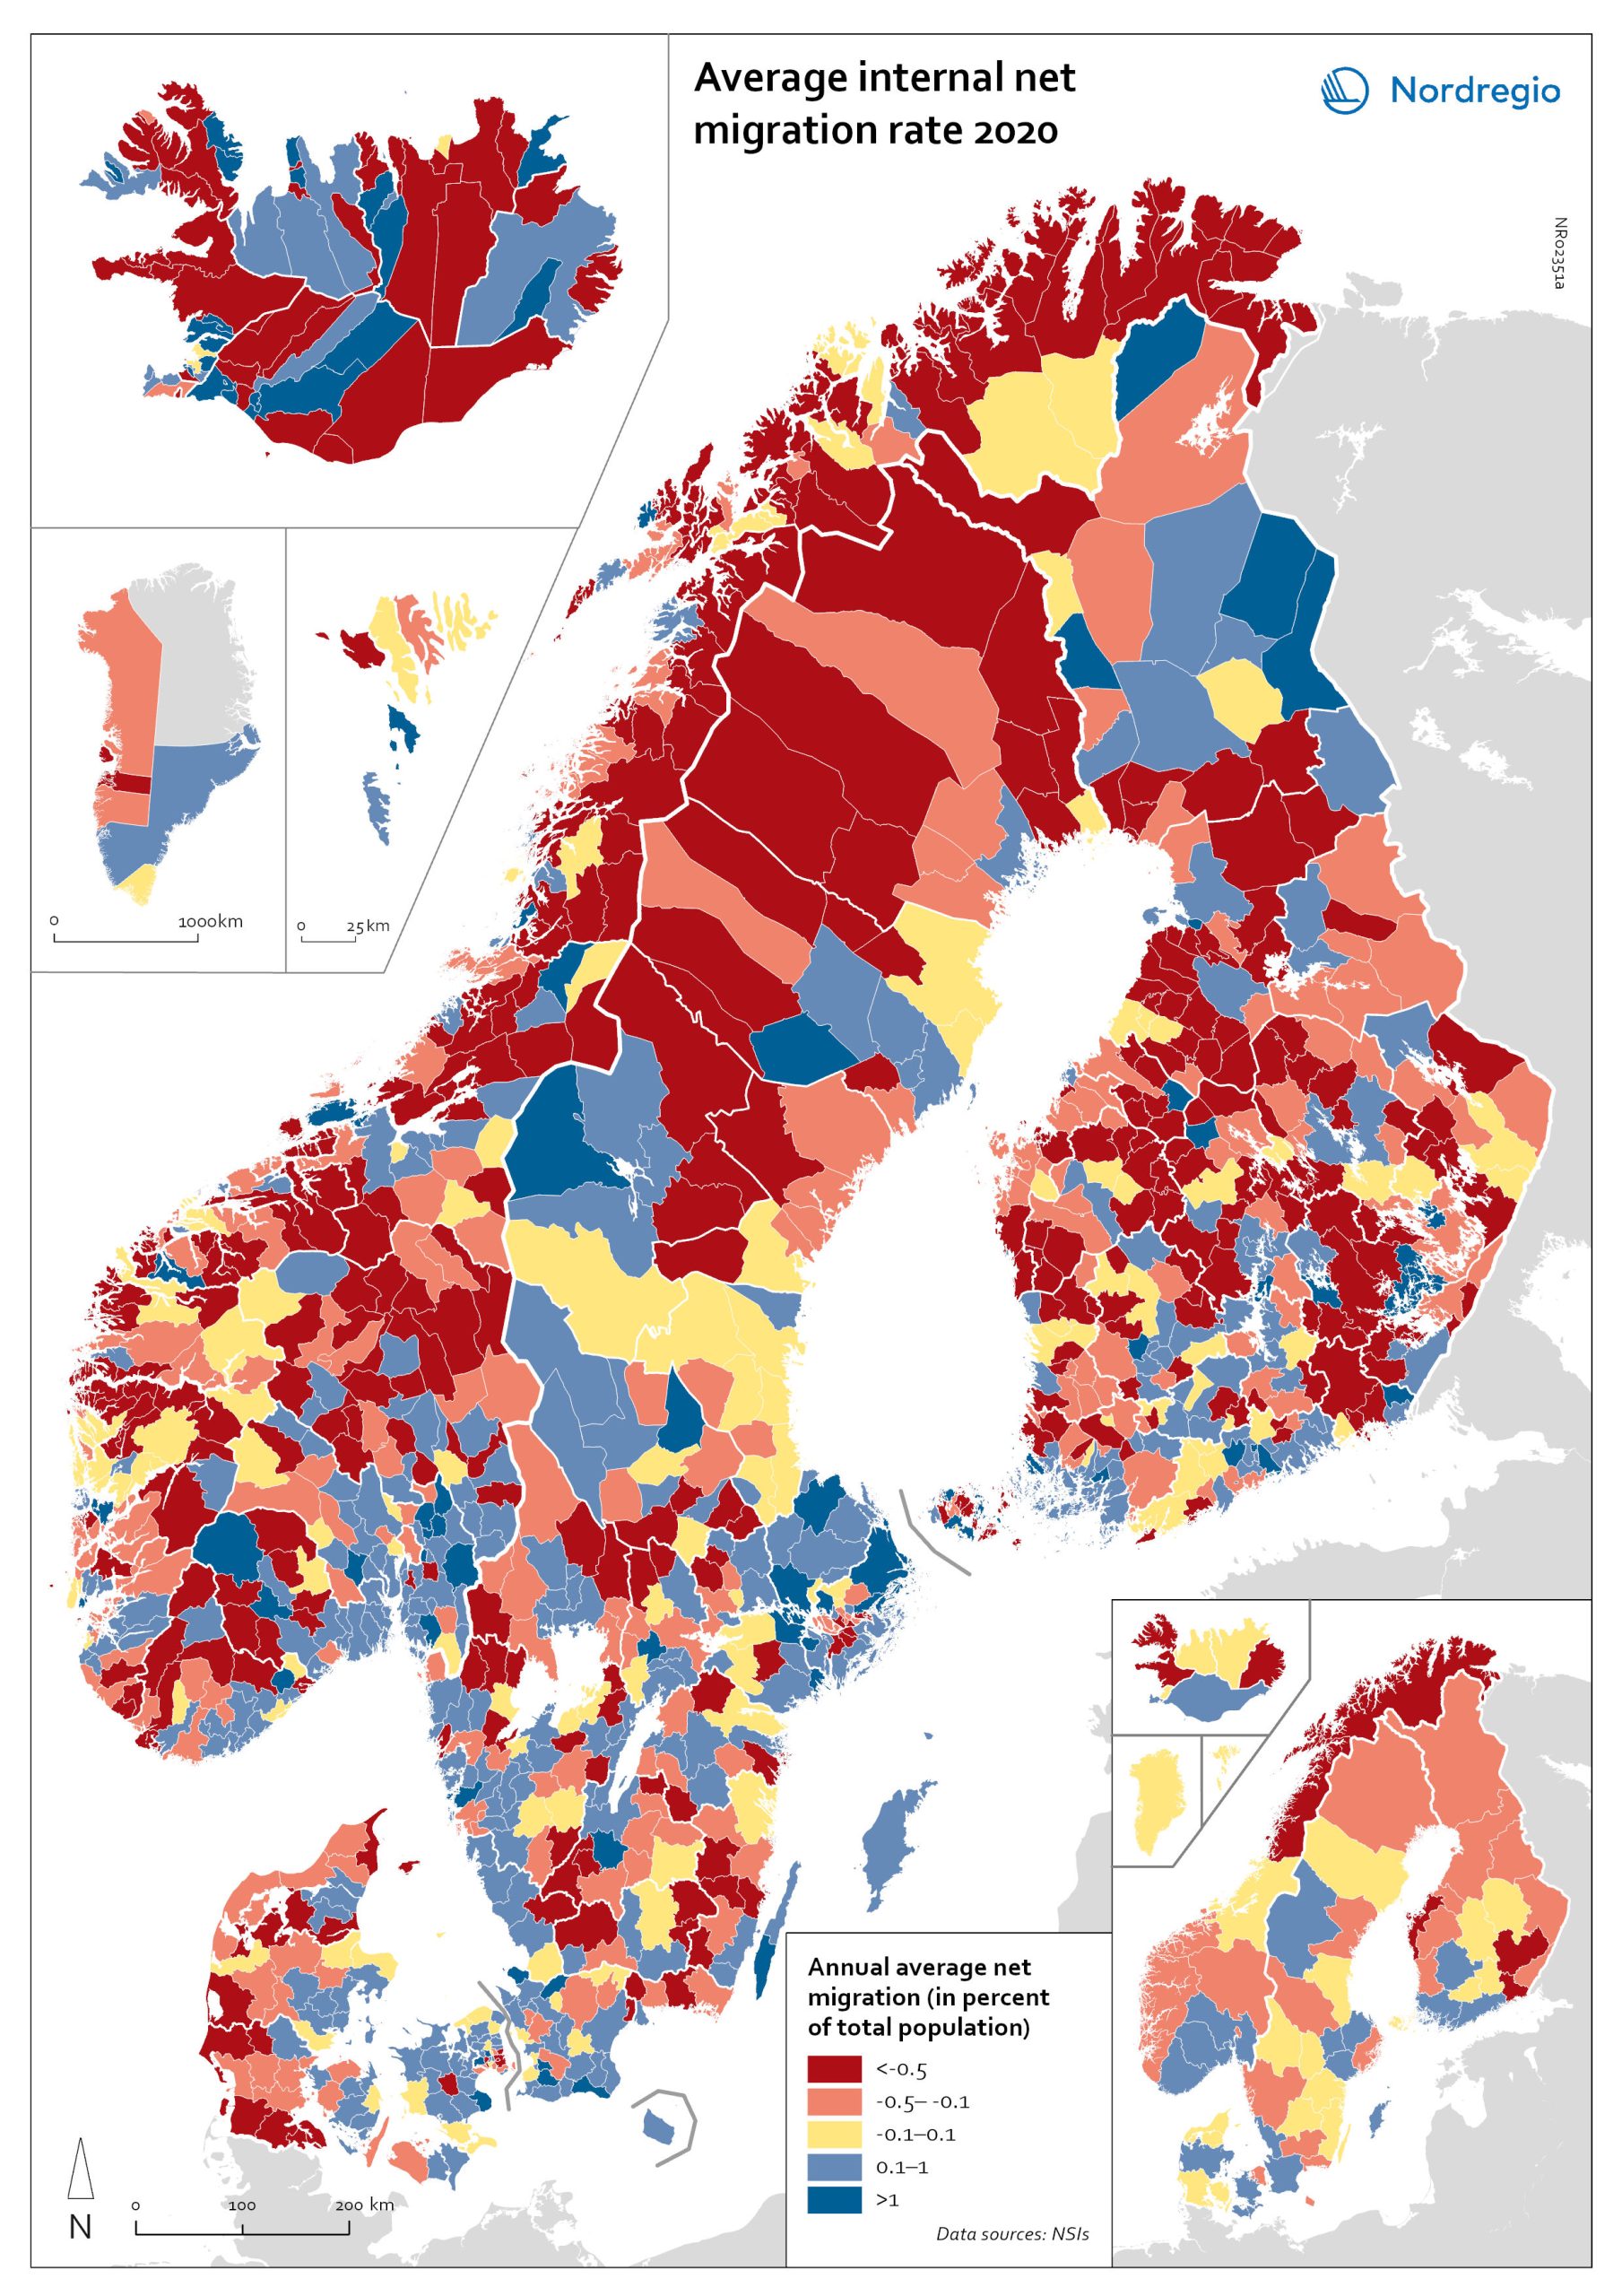
Net internal migration rate 2020
The map shows the internal net migration in 2020. The map is related to the same map showing net internal migration in 2010-2019. The maps show several interesting patterns, suggesting that there may be an increasing trend towards urban-to-rural countermigration in all the five Nordic countries because of the pandemic. In other words, there are several rural municipalities – both in sparsely populated areas and areas close to major cities – that have experienced considerable increases in internal net migration. In Finland, for instance, there are several municipalities in Lapland that attracted return migrants to a considerable degree in 2020 (e.g., Kolari, Salla, and Savukoski). Swedish municipalities with increasing internal net migration include municipalities in both remote rural regions (e.g., Åre) and municipalities in the vicinity of major cities (e.g., Trosa, Upplands-Bro, Lekeberg, and Österåker). In Iceland, there are several remote municipalities that have experienced a rapid transformation from a strong outflow to an inflow of internal migration (e.g., Ásahreppur, Tálknafjarðarhreppurand, and Fljótsdalshreppur). In Denmark and Norway, there are also several rural municipalities with increasing internal net migration (e.g., Christiansø in Denmark), even if the patterns are somewhat more restrained compared to the other Nordic countries. Interestingly, several municipalities in capital regions are experiencing a steep decrease in internal migration (e.g., Helsinki, Espoo, Copenhagen and Stockholm). At regional level, such decreases are noted in the capital regions of Copenhagen, Reykjavík and Stockholm. At the same time, the rural regions of Jämtland, Kalmar, Sjælland, Nordjylland, Norðurland vestra, Norðurland eystra and Kainuu recorded increases in internal net migration. While some of the evolving patterns of counterurbanisation were noted before 2020 for the 30–40 age group, these trends seem to have been strengthened by the pandemic. In addition to return migration, there may be a larger share of young adults who decide to…
- 2022 March
- Demography
- Migration
- Nordic Region
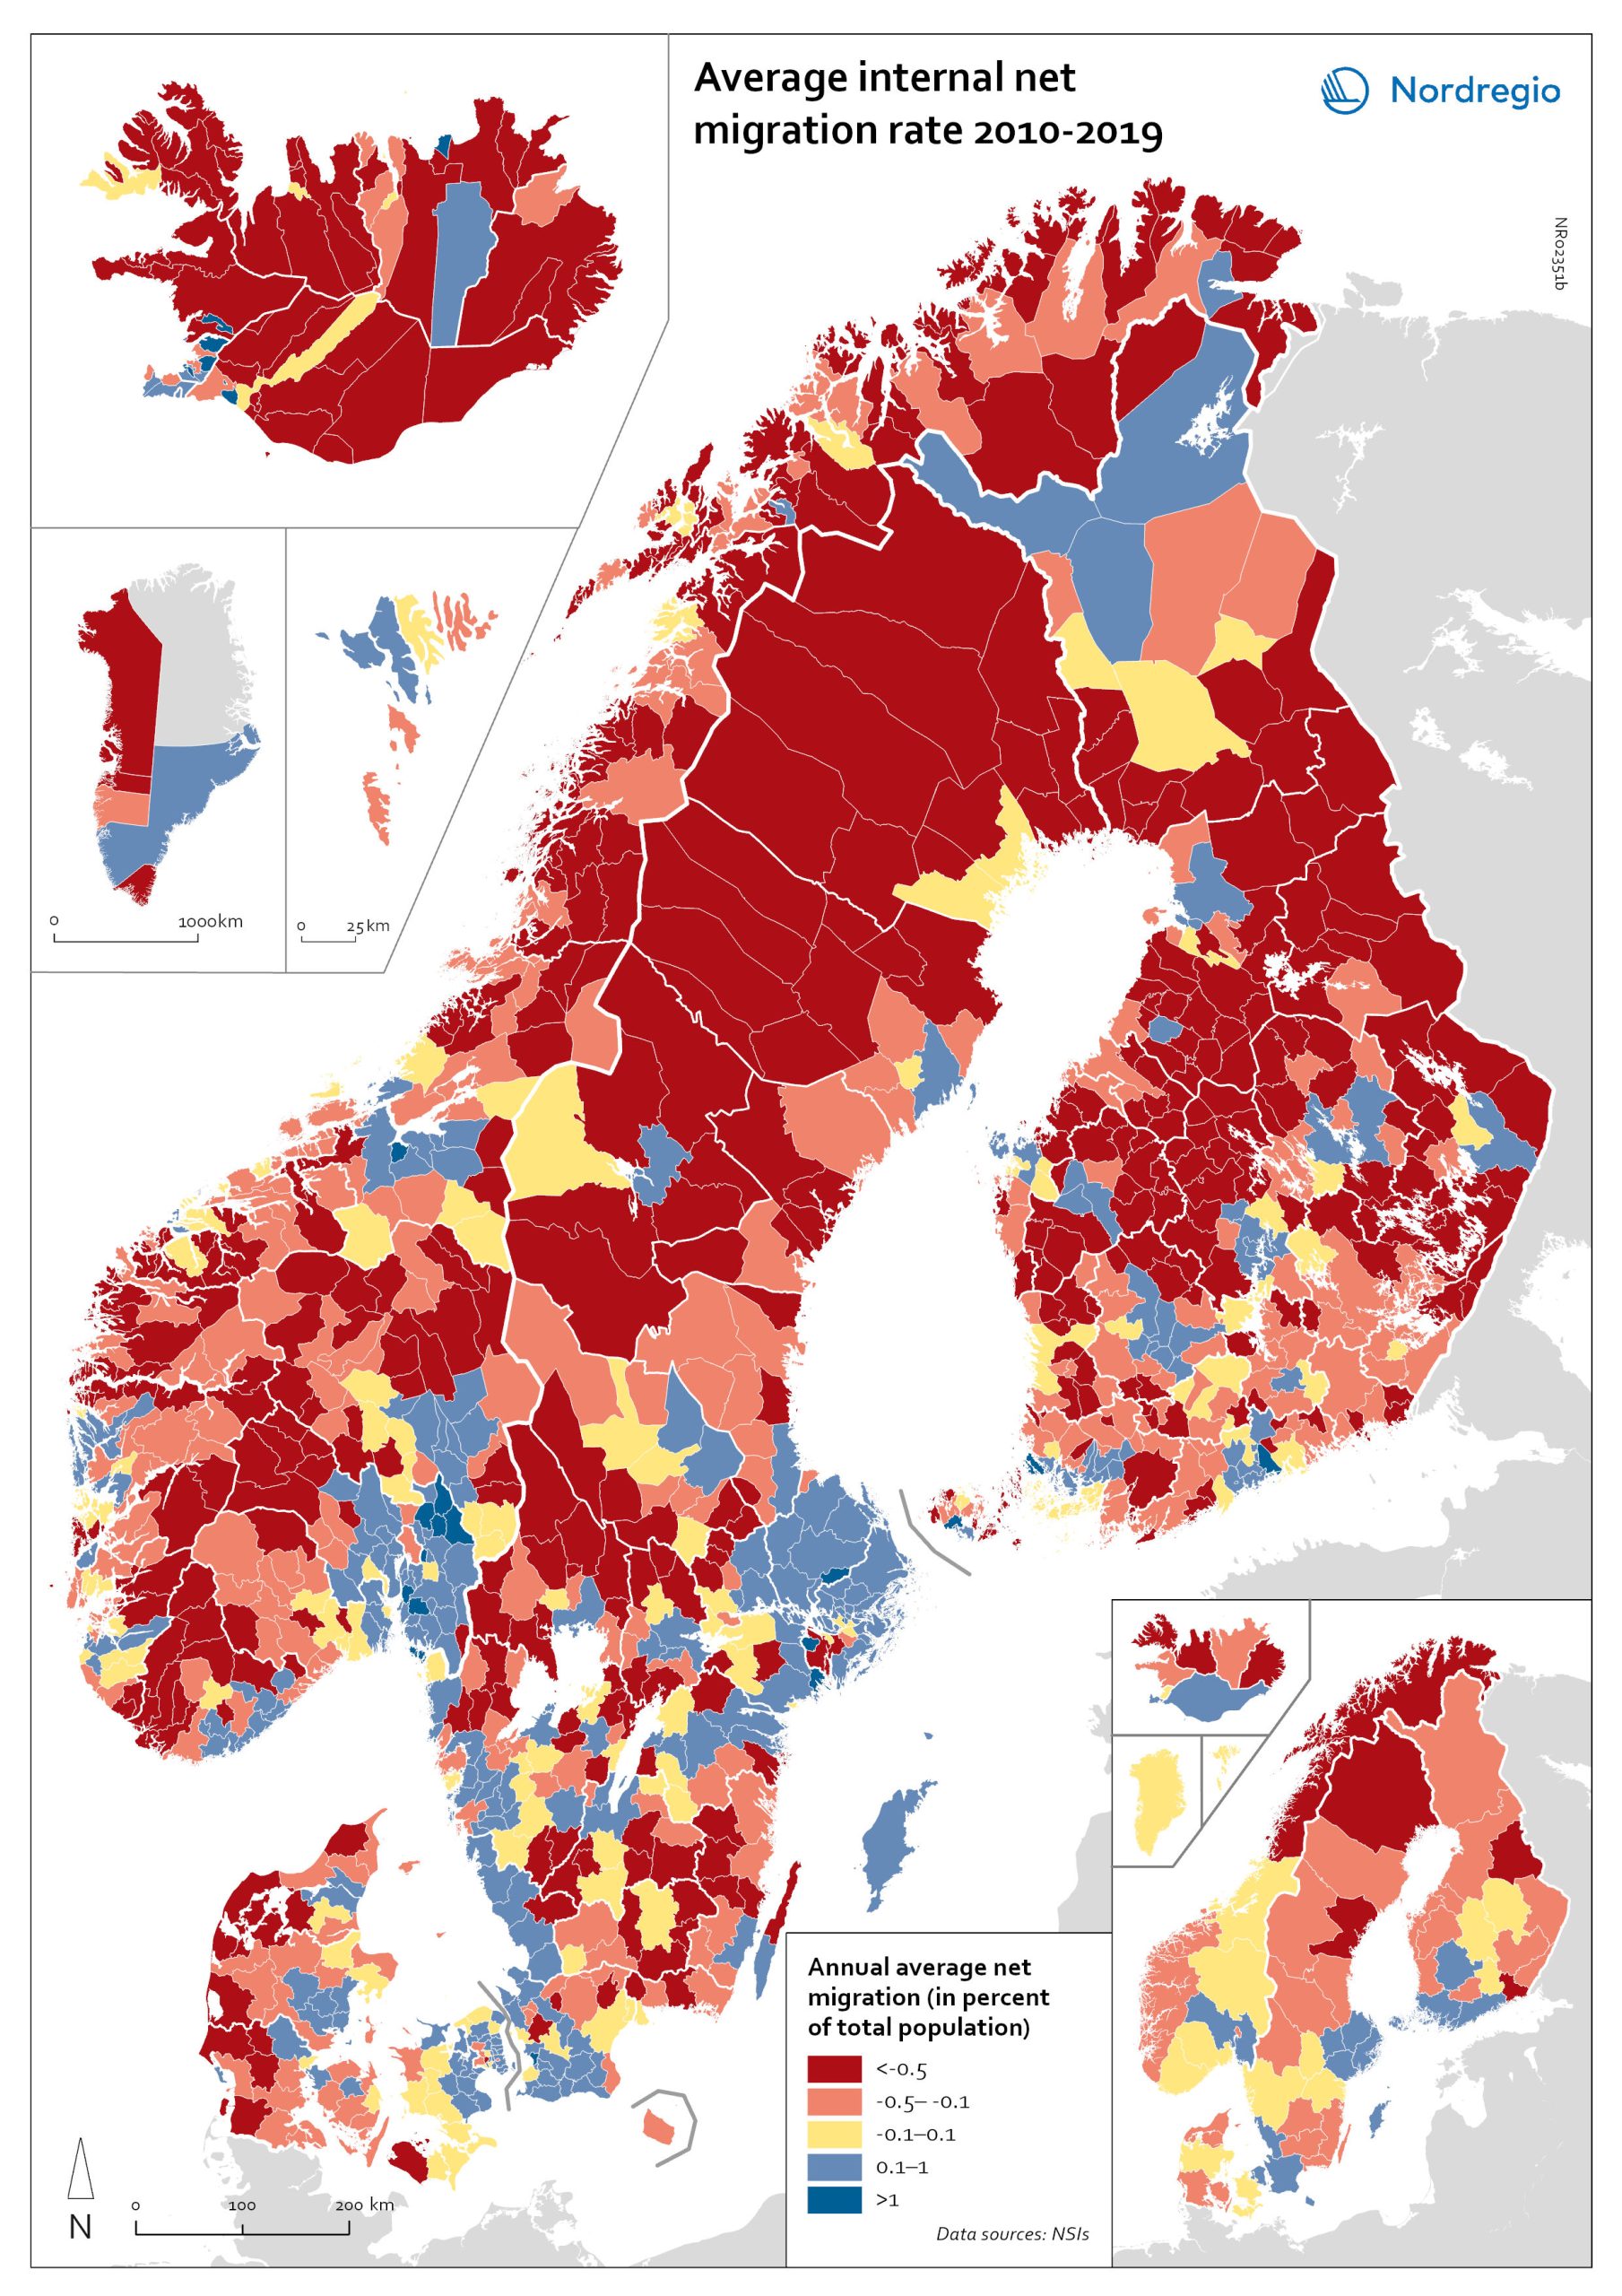
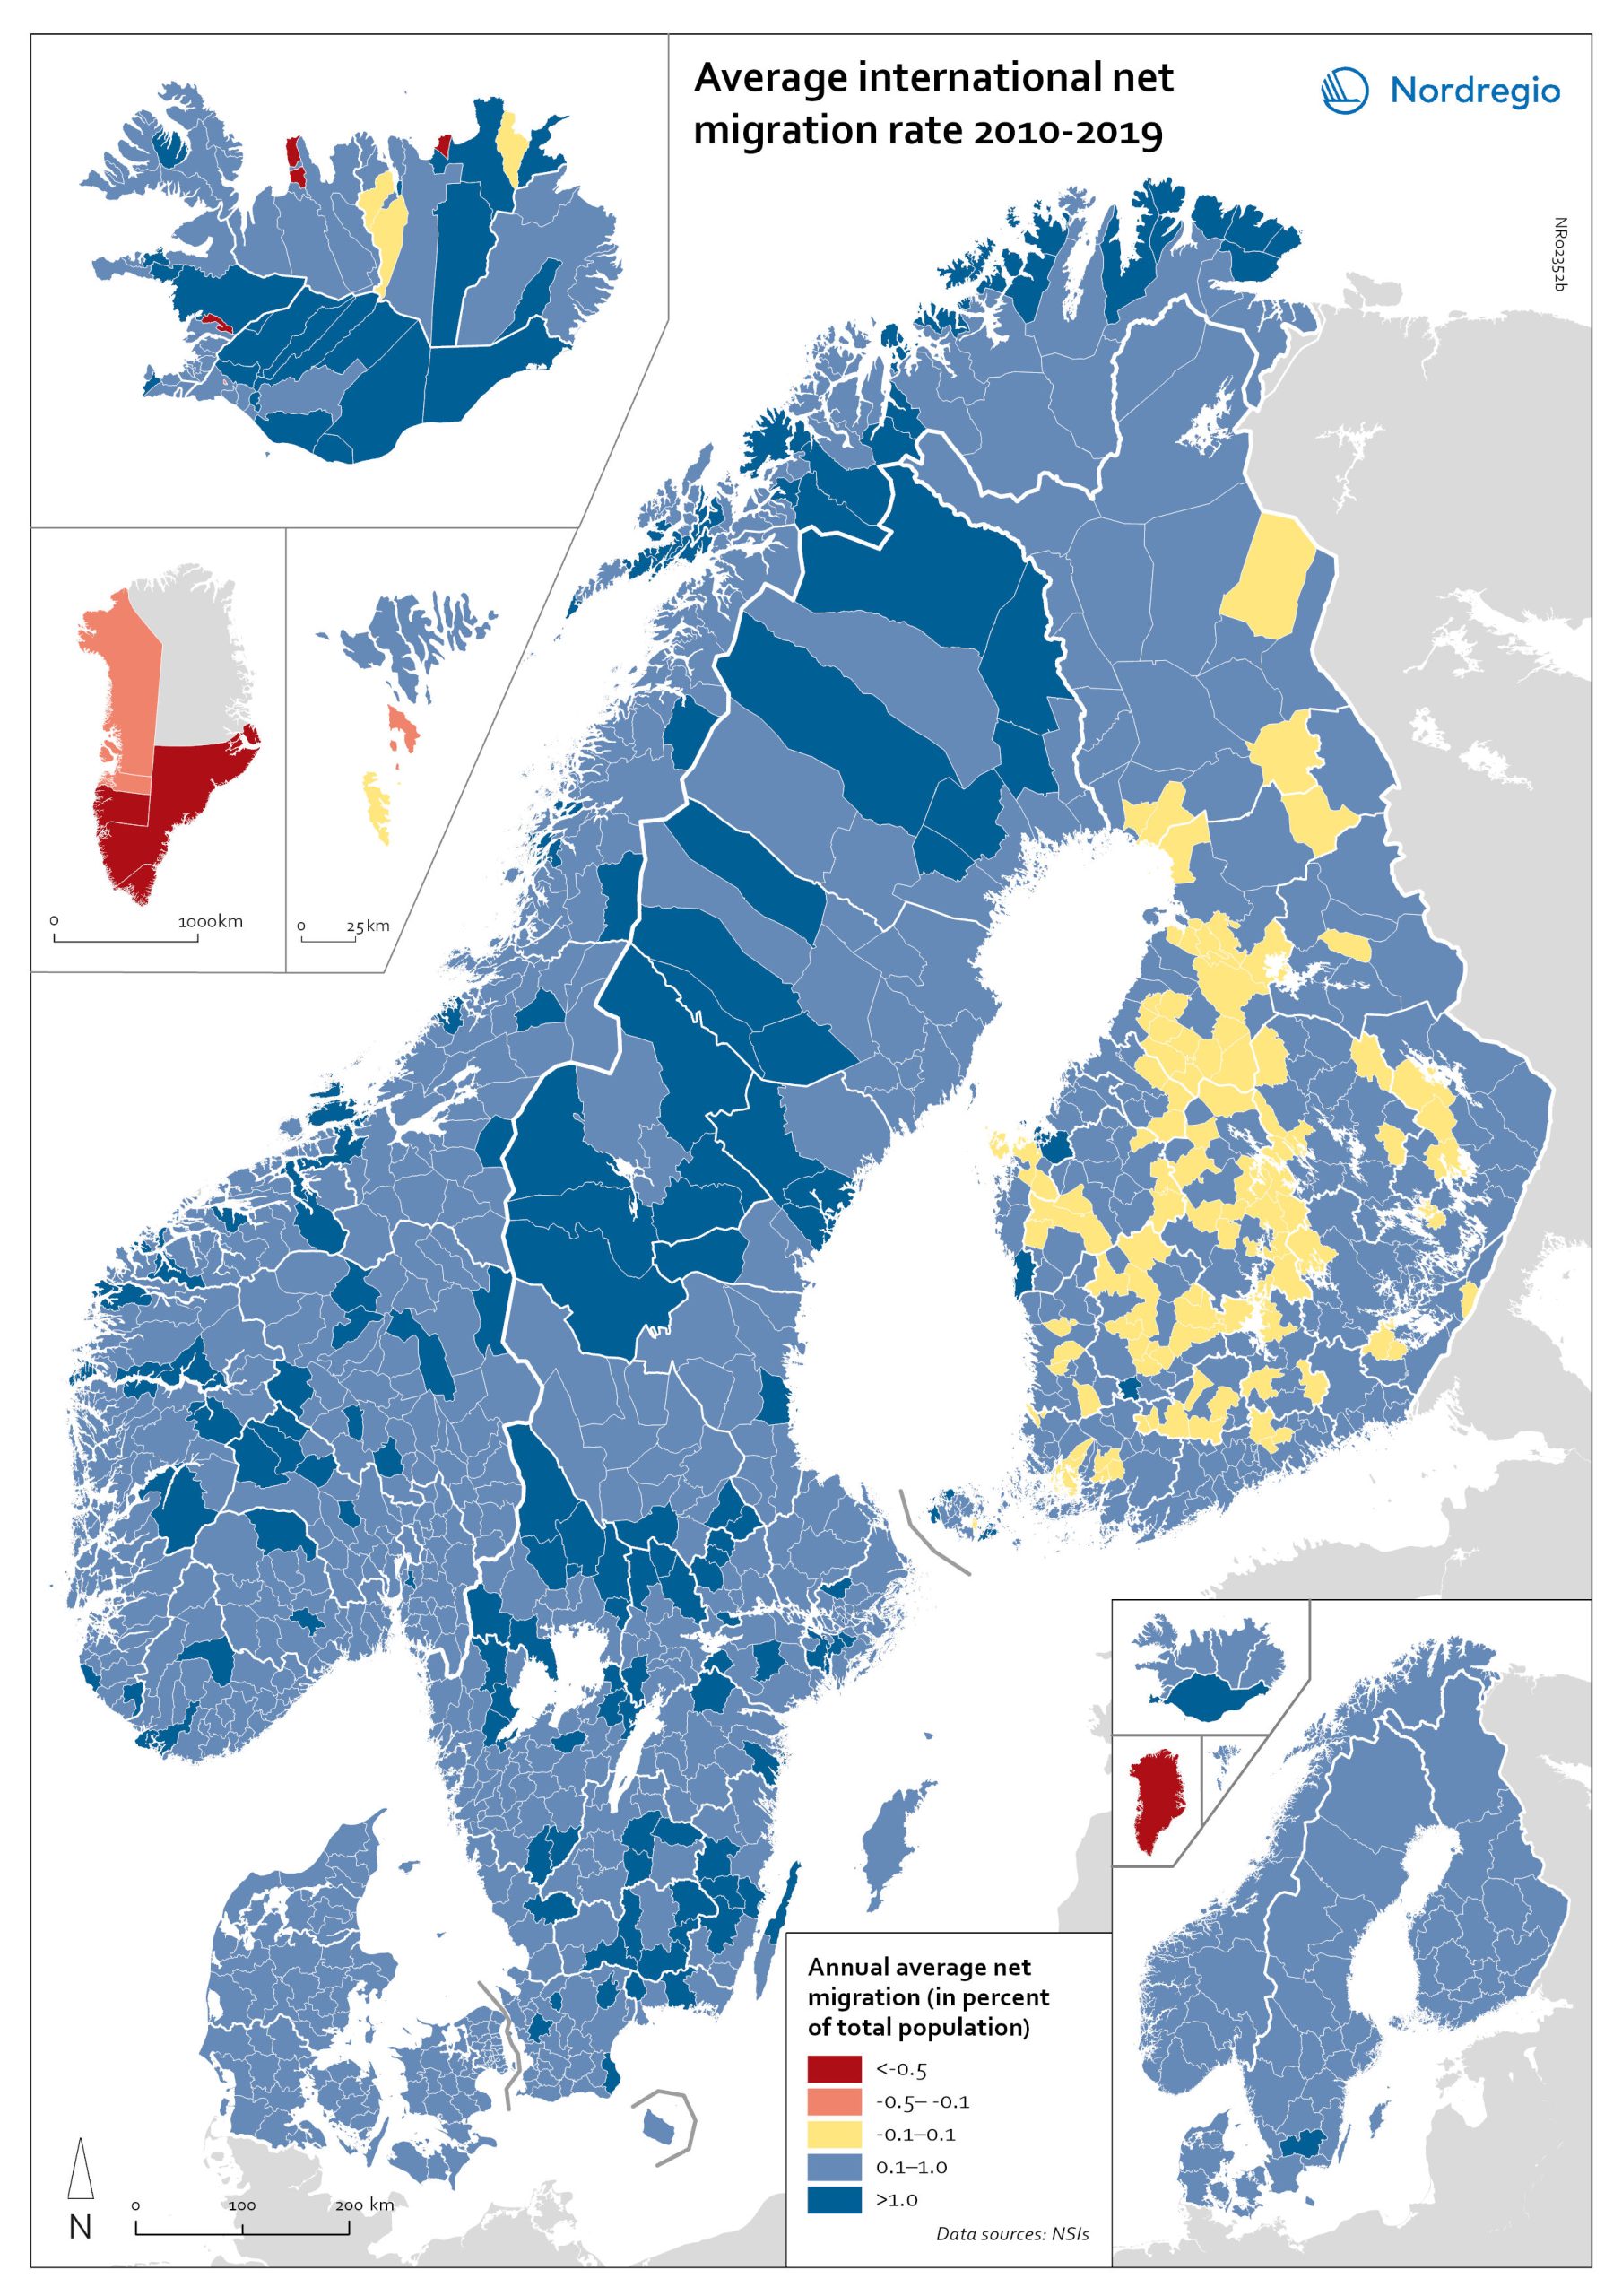
Net internal migration rate, 2010-2019
The map shows the annual average internal net migration in 2010-2019. The map is related to the same map showing net internal migration in 2020. The maps show several interesting patterns, suggesting that there may be an increasing trend towards urban-to-rural countermigration in all the five Nordic countries because of the pandemic. In other words, there are several rural municipalities – both in sparsely populated areas and areas close to major cities – that have experienced considerable increases in internal net migration. In Finland, for instance, there are several municipalities in Lapland that attracted return migrants to a considerable degree in 2020 (e.g., Kolari, Salla, and Savukoski). Swedish municipalities with increasing internal net migration include municipalities in both remote rural regions (e.g., Åre) and municipalities in the vicinity of major cities (e.g., Trosa, Upplands-Bro, Lekeberg, and Österåker). In Iceland, there are several remote municipalities that have experienced a rapid transformation from a strong outflow to an inflow of internal migration (e.g., Ásahreppur, Tálknafjarðarhreppurand, and Fljótsdalshreppur). In Denmark and Norway, there are also several rural municipalities with increasing internal net migration (e.g., Christiansø in Denmark), even if the patterns are somewhat more restrained compared to the other Nordic countries. Interestingly, several municipalities in capital regions are experiencing a steep decrease in internal migration (e.g., Helsinki, Espoo, Copenhagen and Stockholm). At regional level, such decreases are noted in the capital regions of Copenhagen, Reykjavík and Stockholm. At the same time, the rural regions of Jämtland, Kalmar, Sjælland, Nordjylland, Norðurland vestra, Norðurland eystra and Kainuu recorded increases in internal net migration. While some of the evolving patterns of counterurbanisation were noted before 2020 for the 30–40 age group, these trends seem to have been strengthened by the pandemic. In addition to return migration, there may be a larger share of young adults who…
- 2022 March
- Demography
- Migration
- Nordic Region
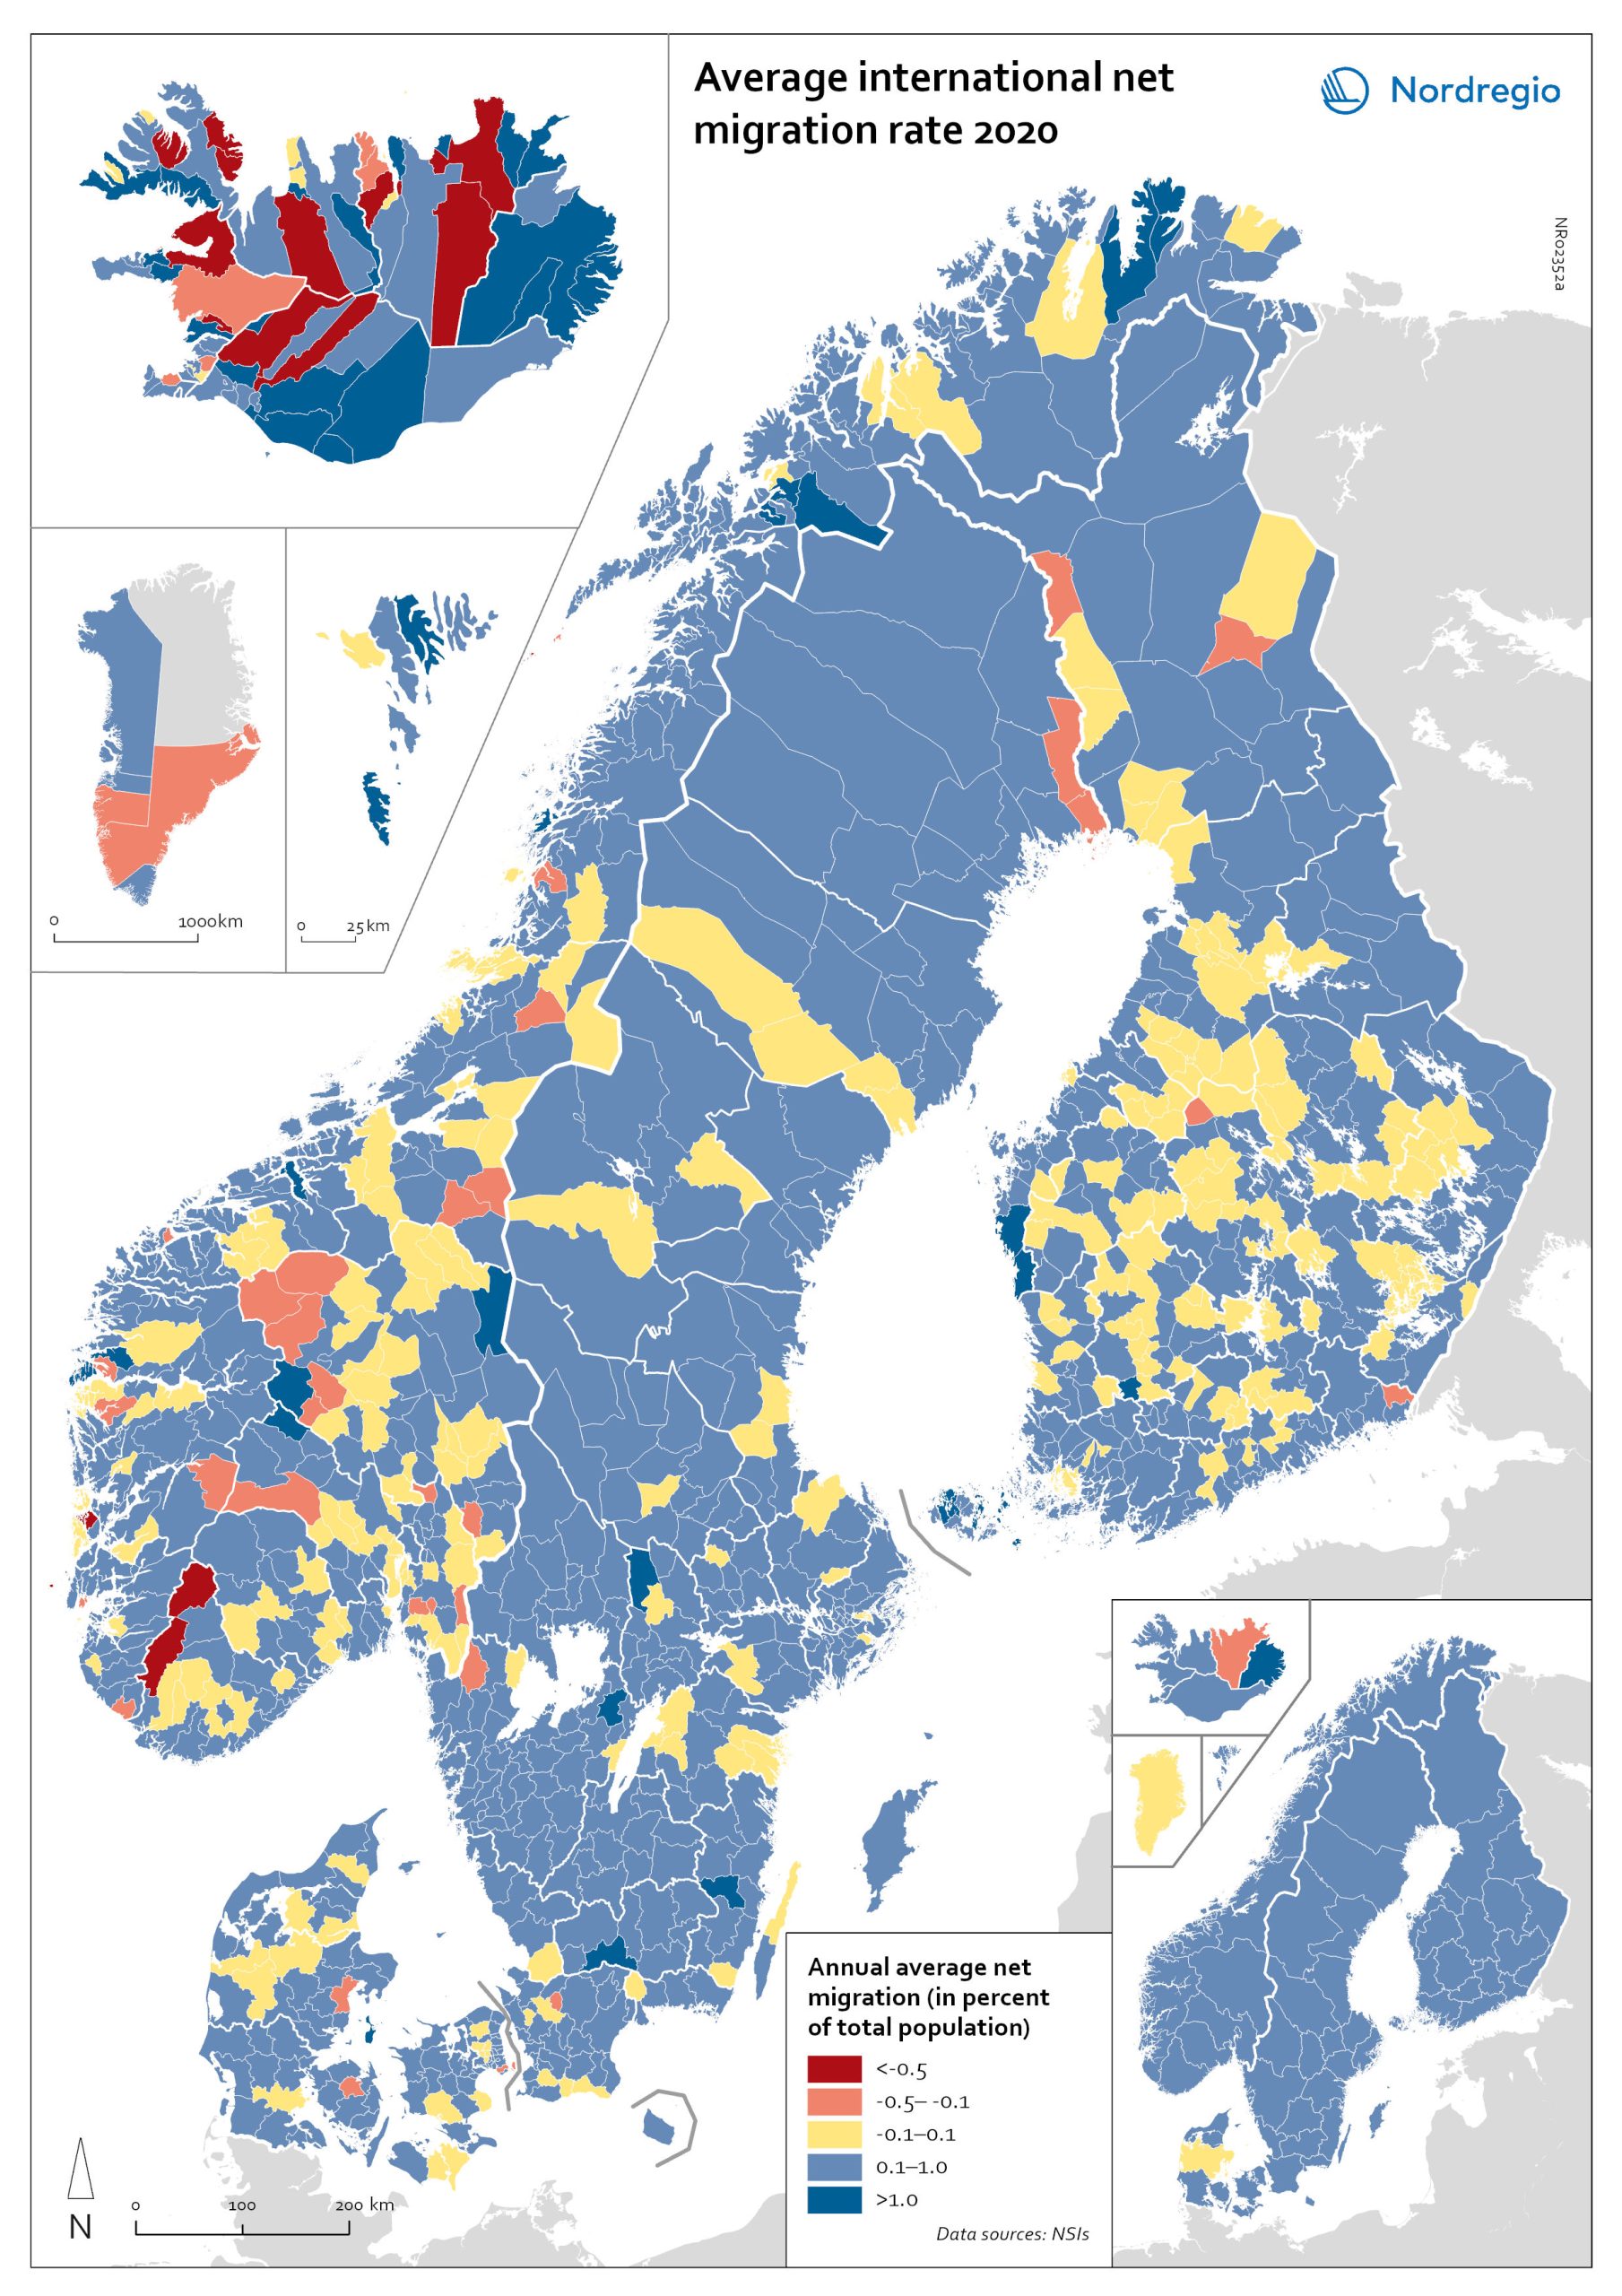
Net international migration rate, 2020
The map shows the international net migration in 2020. The map is related to the same map showing net migration in 2010-2019. At regional level, there are only minor changes between the net migration in 2010-2019 and 2020. All regions of Norway, all regions of Sweden except Gotland and Uppsala, and the regions of Österbotten in Finland, Midtjylland in Denmark and Norðurland eystra in Iceland experienced a slight decrease in international net migration I 2020 compared to 2010-2019. There is a more marked increase in net migration in the Faroe Islands, Greenland and the region of Norðurland vestra in Iceland, and a slight increase in the region of Austurland in Iceland. At municipal level, the maps show more changing patterns. In Denmark, Norway and Sweden, several municipalities – both in the capital, intermediate, and rural regions – had lower levels of international net migration in 2020 compared to 2010-2019. In Iceland and Finland, the picture is more balanced, with some municipalities showing a decrease, others an increase. In the Faroe Islands and Greenland, several municipalities/regions had an increase in international net migration.
- 2022 March
- Demography
- Migration
- Nordic Region
Net international migration rate, 2010–2019
The map shows the annual average international net migration from 2010 to 2019. The map is related to the same map showing net migration in 2020. At regional level, there are only minor changes between the net migration in 2010-2019 and 2020. All regions of Norway, all regions of Sweden except Gotland and Uppsala, and the regions of Österbotten in Finland, Midtjylland in Denmark and Norðurland eystra in Iceland experienced a slight decrease in international net migration I 2020 compared to 2010-2019. There is a more marked increase in net migration in the Faroe Islands, Greenland and the region of Norðurland vestra in Iceland, and a slight increase in the region of Austurland in Iceland. At municipal level, the maps show more changing patterns. In Denmark, Norway and Sweden, several municipalities – both in the capital, intermediate, and rural regions – had lower levels of international net migration in 2020 compared to 2010-2019. In Iceland and Finland, the picture is more balanced, with some municipalities showing a decrease, others an increase. In the Faroe Islands and Greenland, several municipalities/regions had an increase in international net migration.
- 2022 March
- Demography
- Migration
- Nordic Region
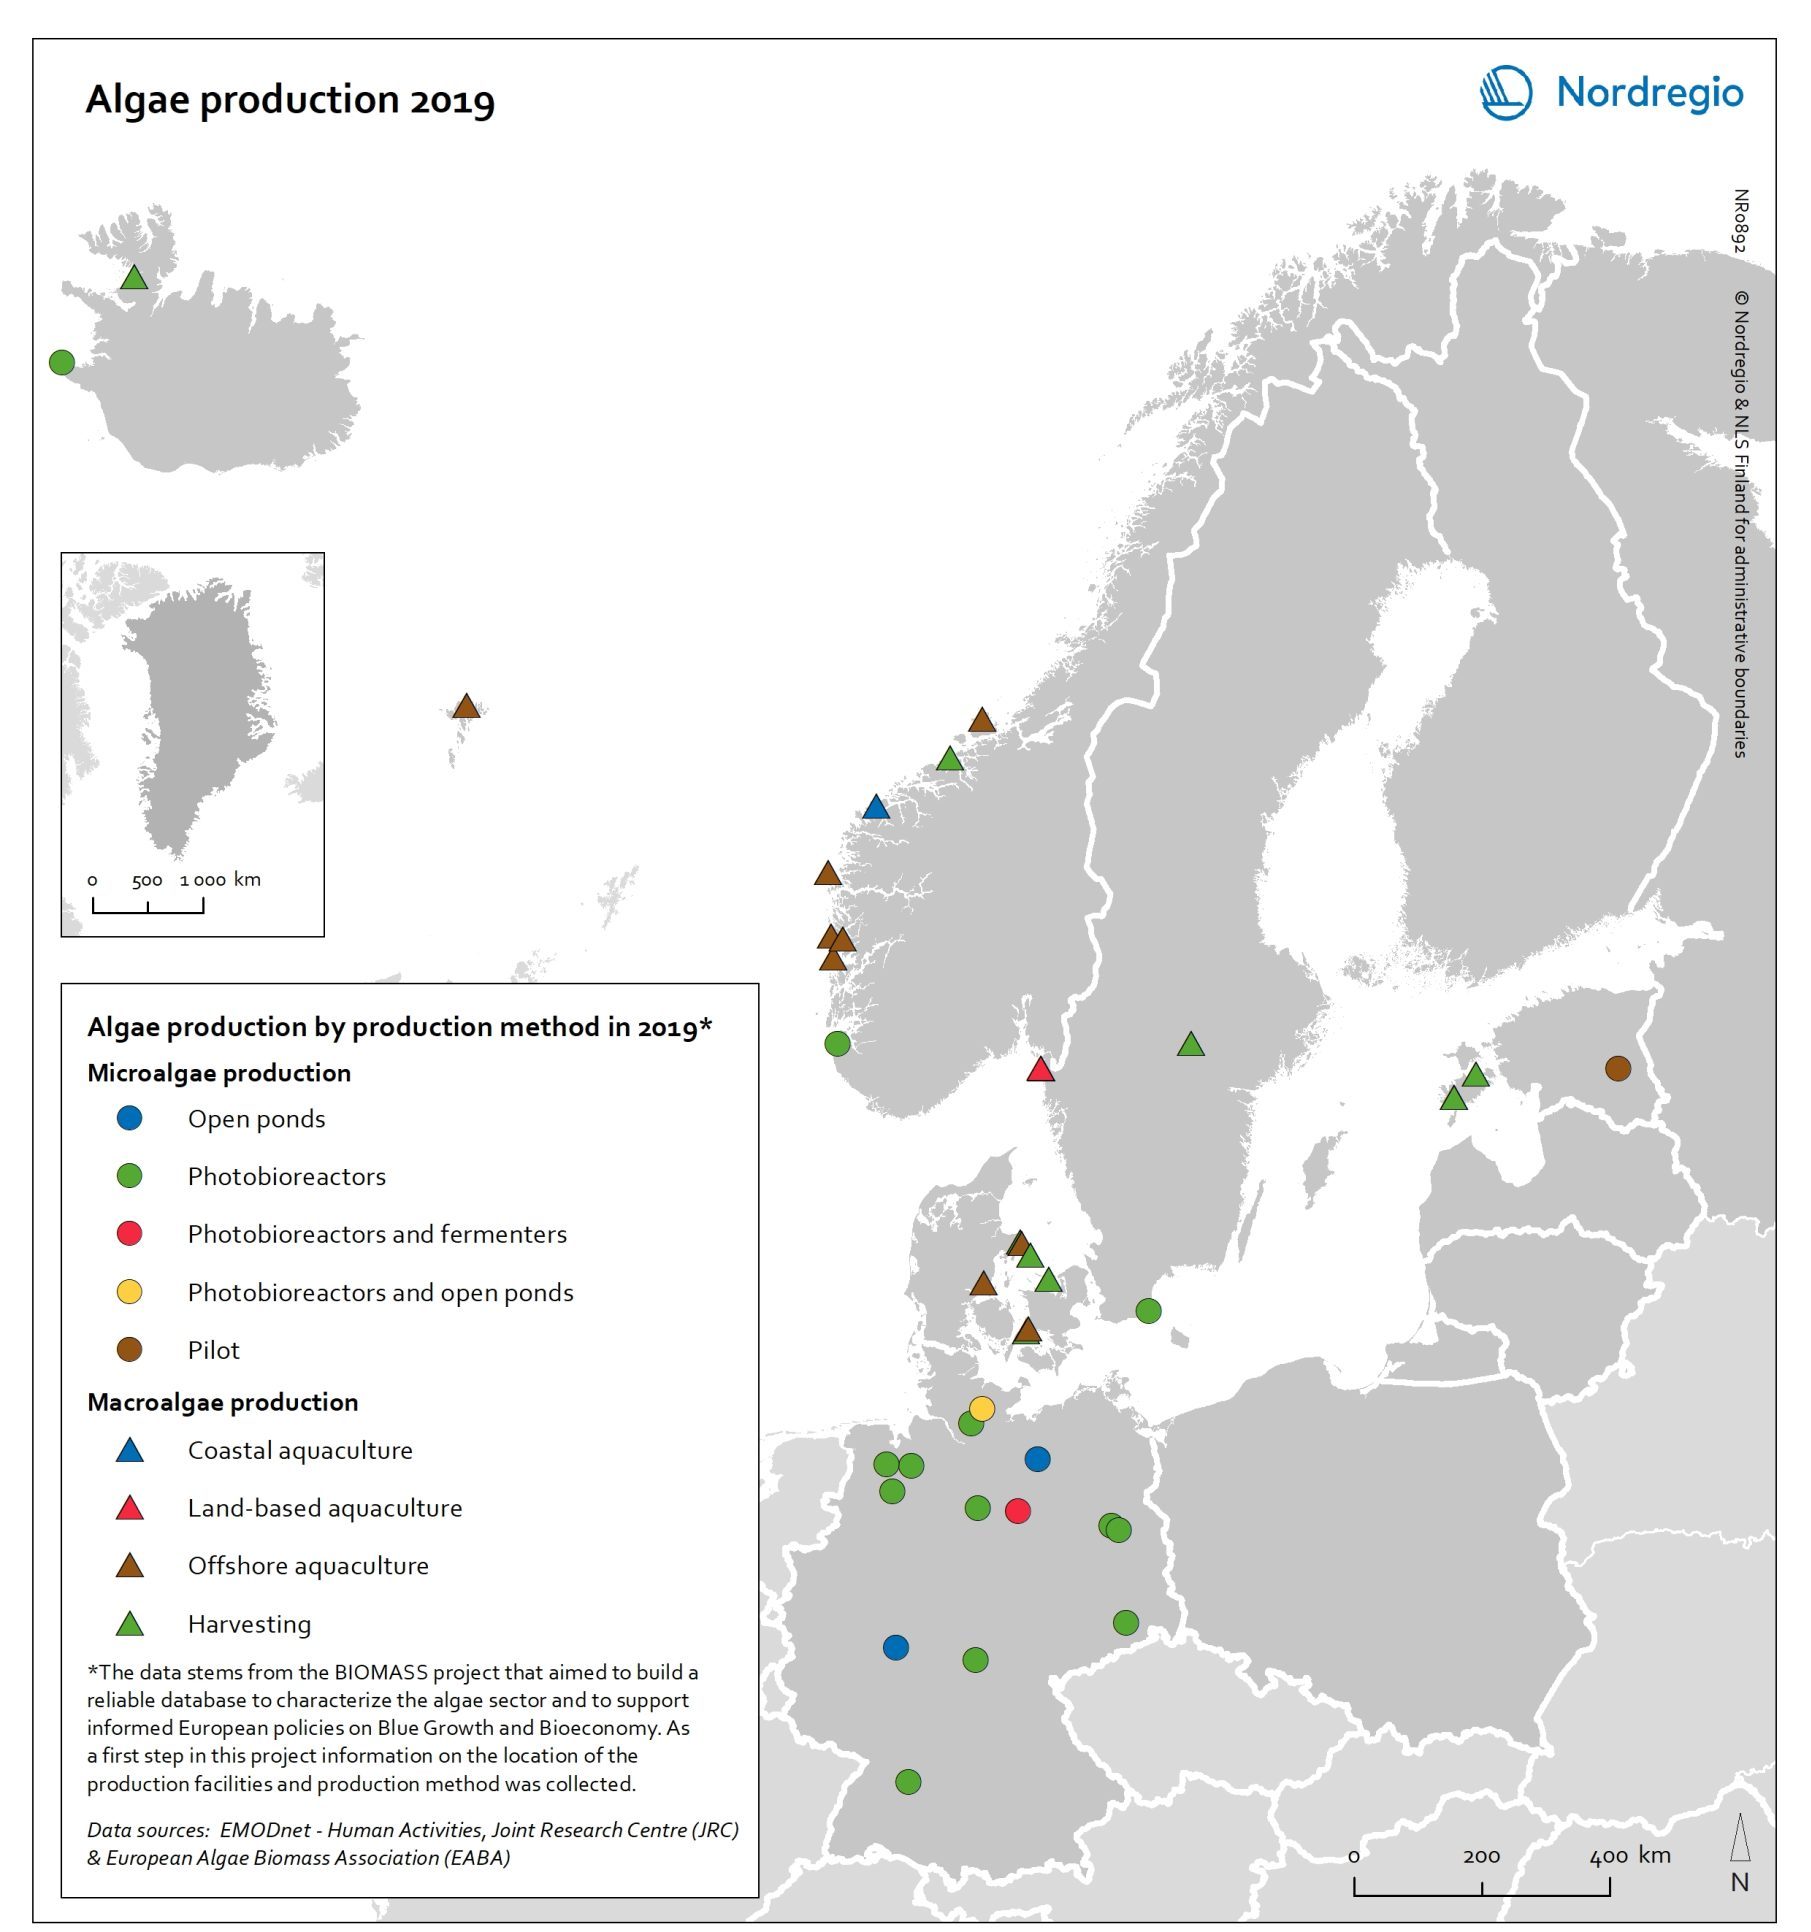
Algae production in 2019
This map shows location of algae production by production method in the Nordic Arctic and Baltic Sea Region in 2019 Algae and seaweeds are gaining attention as useful inputs for industries as diverse as energy and human food production. Aquatic vegetation – both in the seas and in freshwater – can grow at several times the pace of terrestrial plants, and the high natural oil content of some algae makes them ideal for producing a variety of products, from cosmetic oils to biofuels. At the same time, algae farming has added value in potential synergies with farming on land, as algae farms utilise nutrient run-off and reduce eutrophication. In addition, aquatic vegetation is a highly versatile feedstock. Algae and seaweed thrive in challenging and varied conditions and can be transformed into products ranging from fuel, feeds, fertiliser, and chemicals, to third-generation sugar and biomass. These benefits are the basis for seaweed and algae emerging as one of the most important bioeconomy trends in the Nordic Arctic and Baltic Sea region. The production of algae for food and industrial uses has hence significant potential, particularly in terms of environmental impact, but it is still at an early stage. The production of algae (both micro- and macroalgae) can take numerous forms, as shown by this map. At least nine different production methods were identified in the region covered in this analysis. A total of 41 production sites were operating in Denmark, Estonia, the Faroe Islands, Iceland, Norway, Germany, and Sweden. Germany has by far the most sites for microalgae production, whereas Denmark and Norway have the most macroalgae sites.
- 2021 December
- Arctic
- Baltic Sea Region
- Nordic Region
- Others
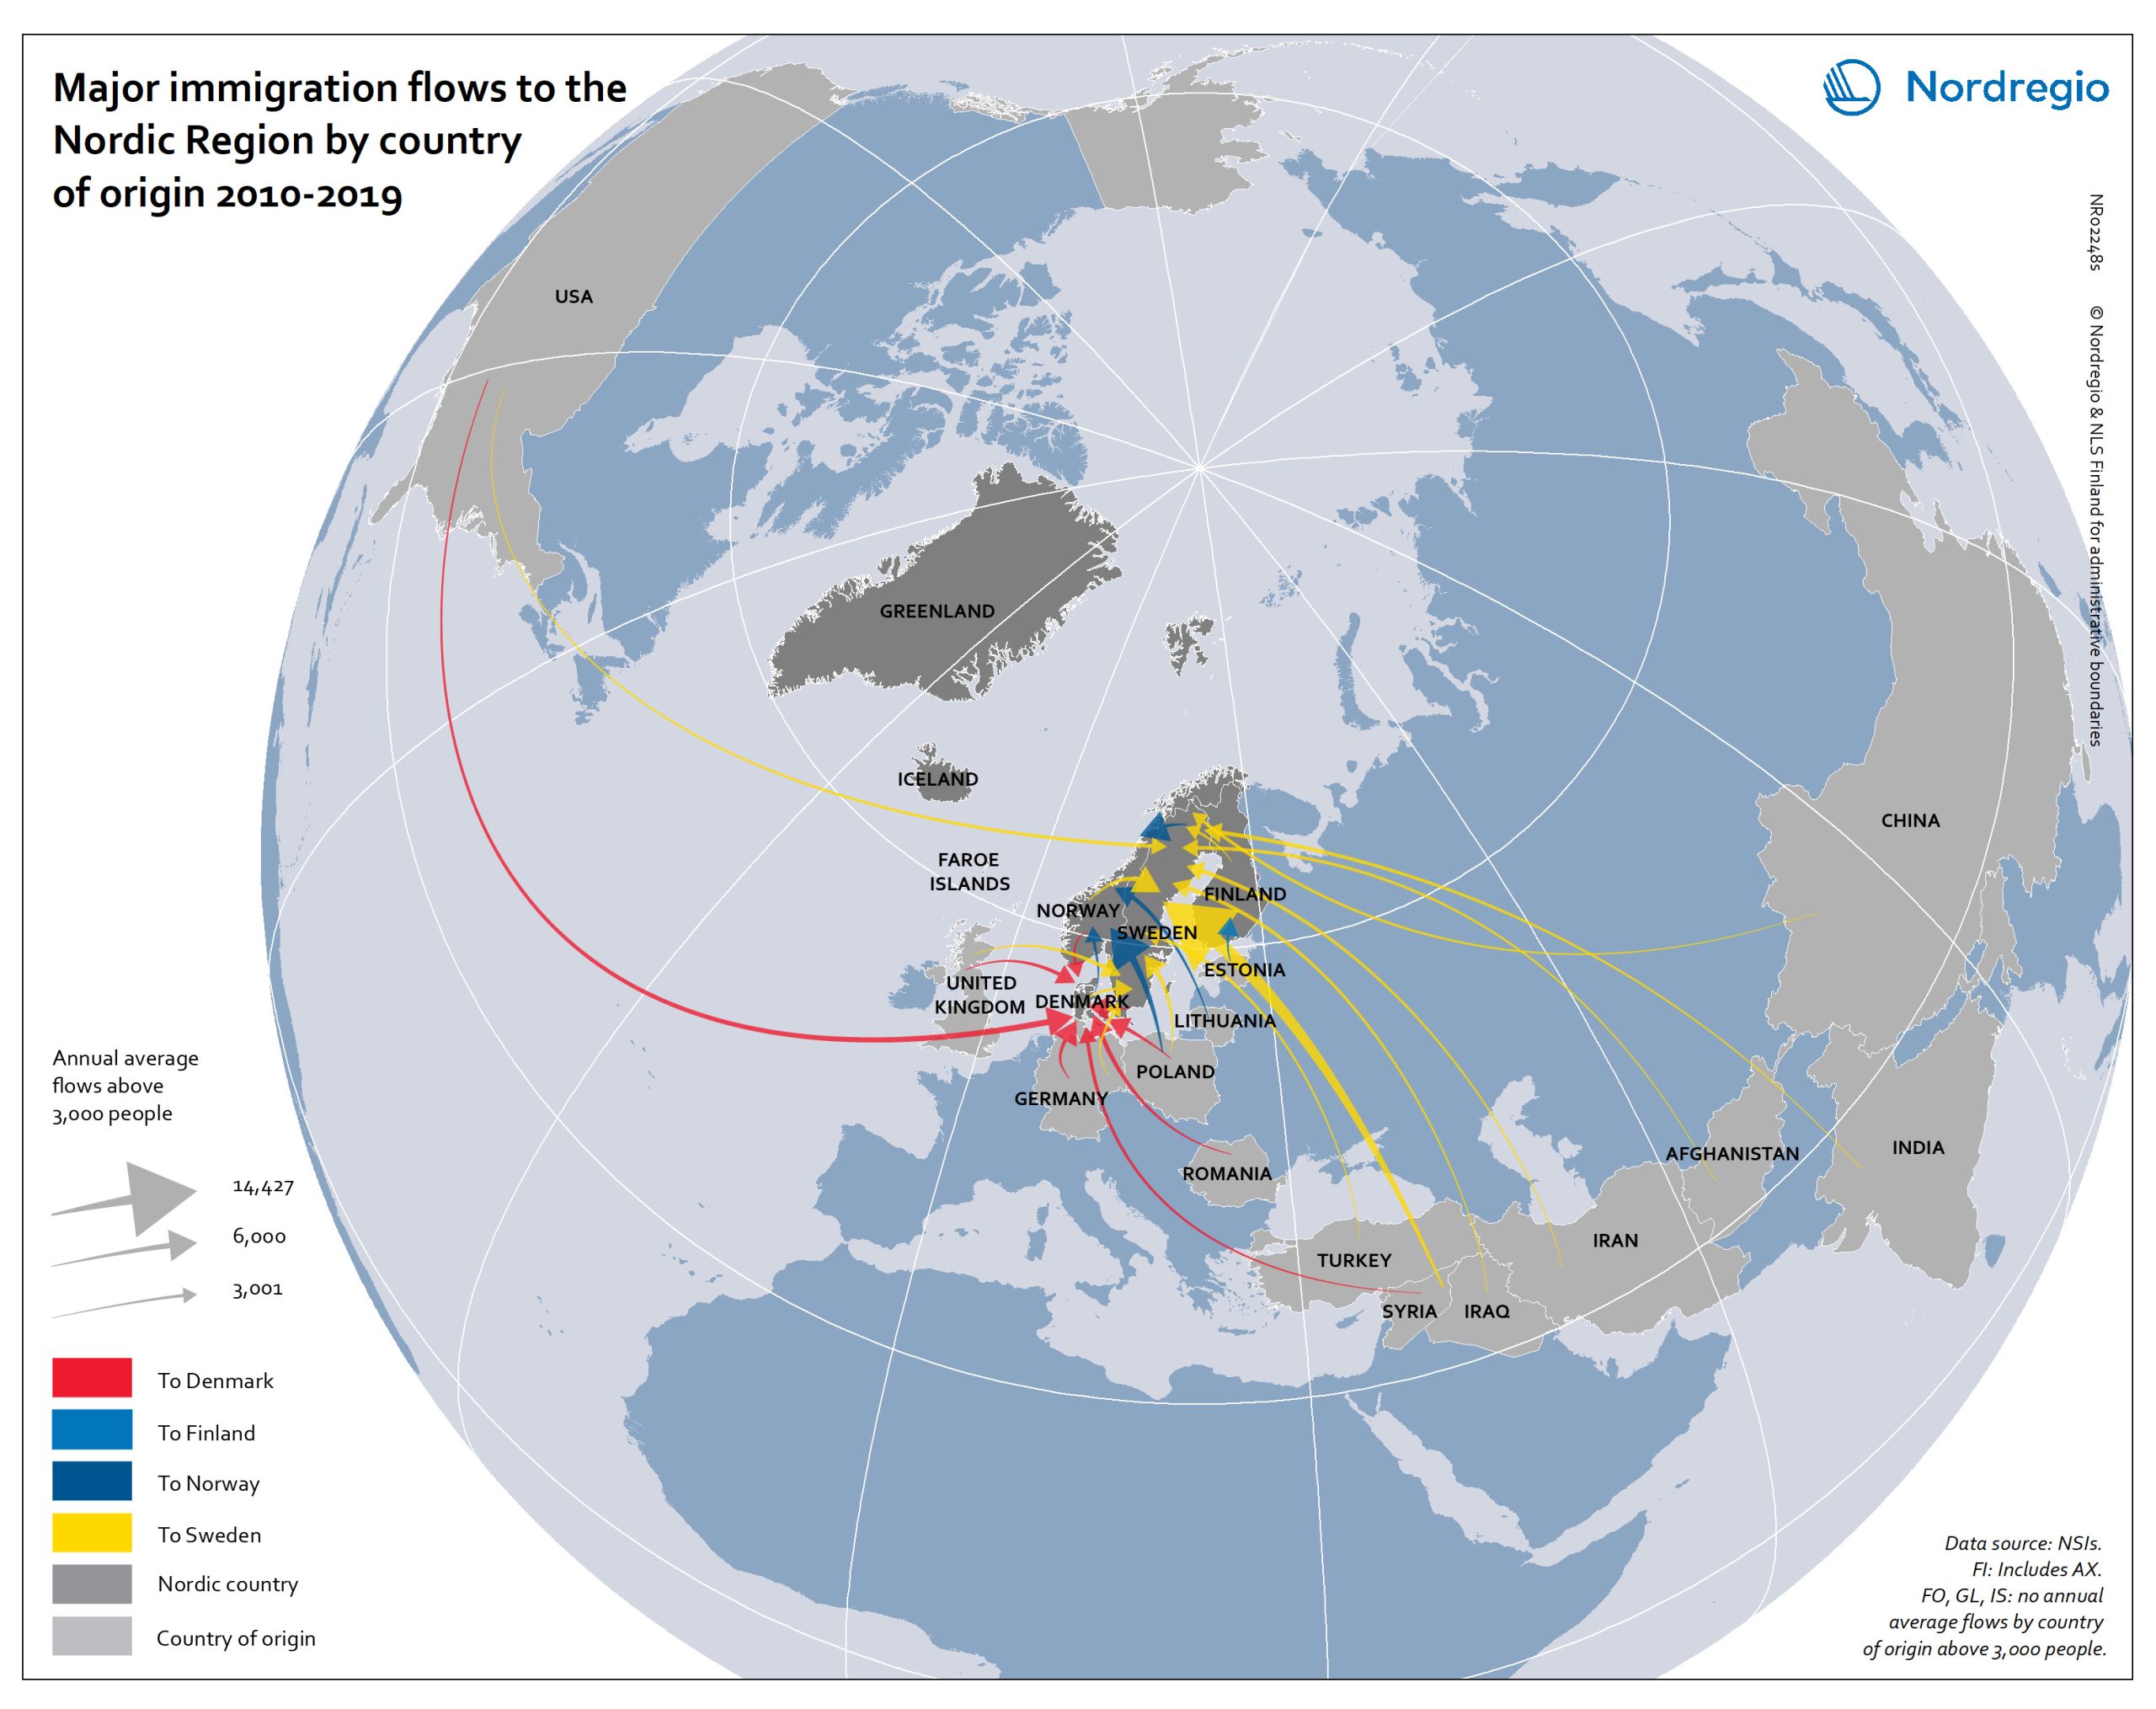
Major immigration flows to the Nordic Region from 2010 to 2019
The map shows annual average immigration flows above 3,000 people, and the growing diversity in their countries of origin Sweden and Denmark, in particular, experienced large inflows from non-Nordic countries during the period 2010-2019, with Sweden standing out as the Nordic country with by far the largest immigrant in-flows. A large portion of these arrivals were from war-torn Syria (an annual average of almost 15,000), followed by Poland (approximately 4,500), United Kingdom, Iraq, India and Iran (around 4,000 each). Denmark experienced a smaller number of inflows above 3,000 people, compared to Sweden. The largest non-Nordic inflows to Denmark were around 5,000 people (per sending country) and included migrants from the U.S., Germany, Romania and Poland. For Norway, large non-Nordic in-flows were limited to Lithuania and Poland. Similarly, Finland had only one major inflow, from Estonia.
- 2021 December
- Migration
- Nordic Region
Change in share of biofuels in transport from 2010 to 2018
This map shows change in share of biofuels in final energy consumption in transport in the Nordic Arctic and Baltic Sea Region from 2010 to 2018. Even though a target for greater use of biofuels has been EU policy since the Renewable Energy and Fuel Quality Directives of 2009, development has been slow. The darker shades of blue on the map represent higher increase, and the lighter shades of blue reflect lower increase. The lilac color represent decrease. The Baltic Sea represents a divide in the region, with countries to the north and west experiencing growth in the use of biofuels for transport in recent years. Sweden stands out (16 per cent growth), while the other Nordic countries has experienced more modest increase. In the southern and eastern parts of the region, the use of biofuels for transport has largely stagnated. Total biofuel consumption for transport has risen more than the figure indicates due to an increase in transport use over the period.
- 2021 December
- Arctic
- Baltic Sea Region
- Nordic Region
- Transport
Share of biofuels in transport in 2018
This map shows the share of biofuels in final energy consumption in transport in the Nordic Arctic and Baltic Sea Region in 2018. There has been considerable political support for biofuels and in the EU, this debate has been driven by the aim of reducing dependency on imported fuels. For instance, 10 per cent of transport fuel should be produced from renewable sources. The darker shades on the map represent higher proportions, and the lighter shades reflect lower proportions. As presented by the map, only Sweden (20.7%) had reached the 10 per cent target in the Nordic Arctic and Baltic Region in 2018. Both Finland (8.3%) and Norway (8.3%) were close by the target, while the other countries in the region were still lagging behind, particularly the Baltic countries.
- 2021 December
- Arctic
- Baltic Sea Region
- Nordic Region
- Transport
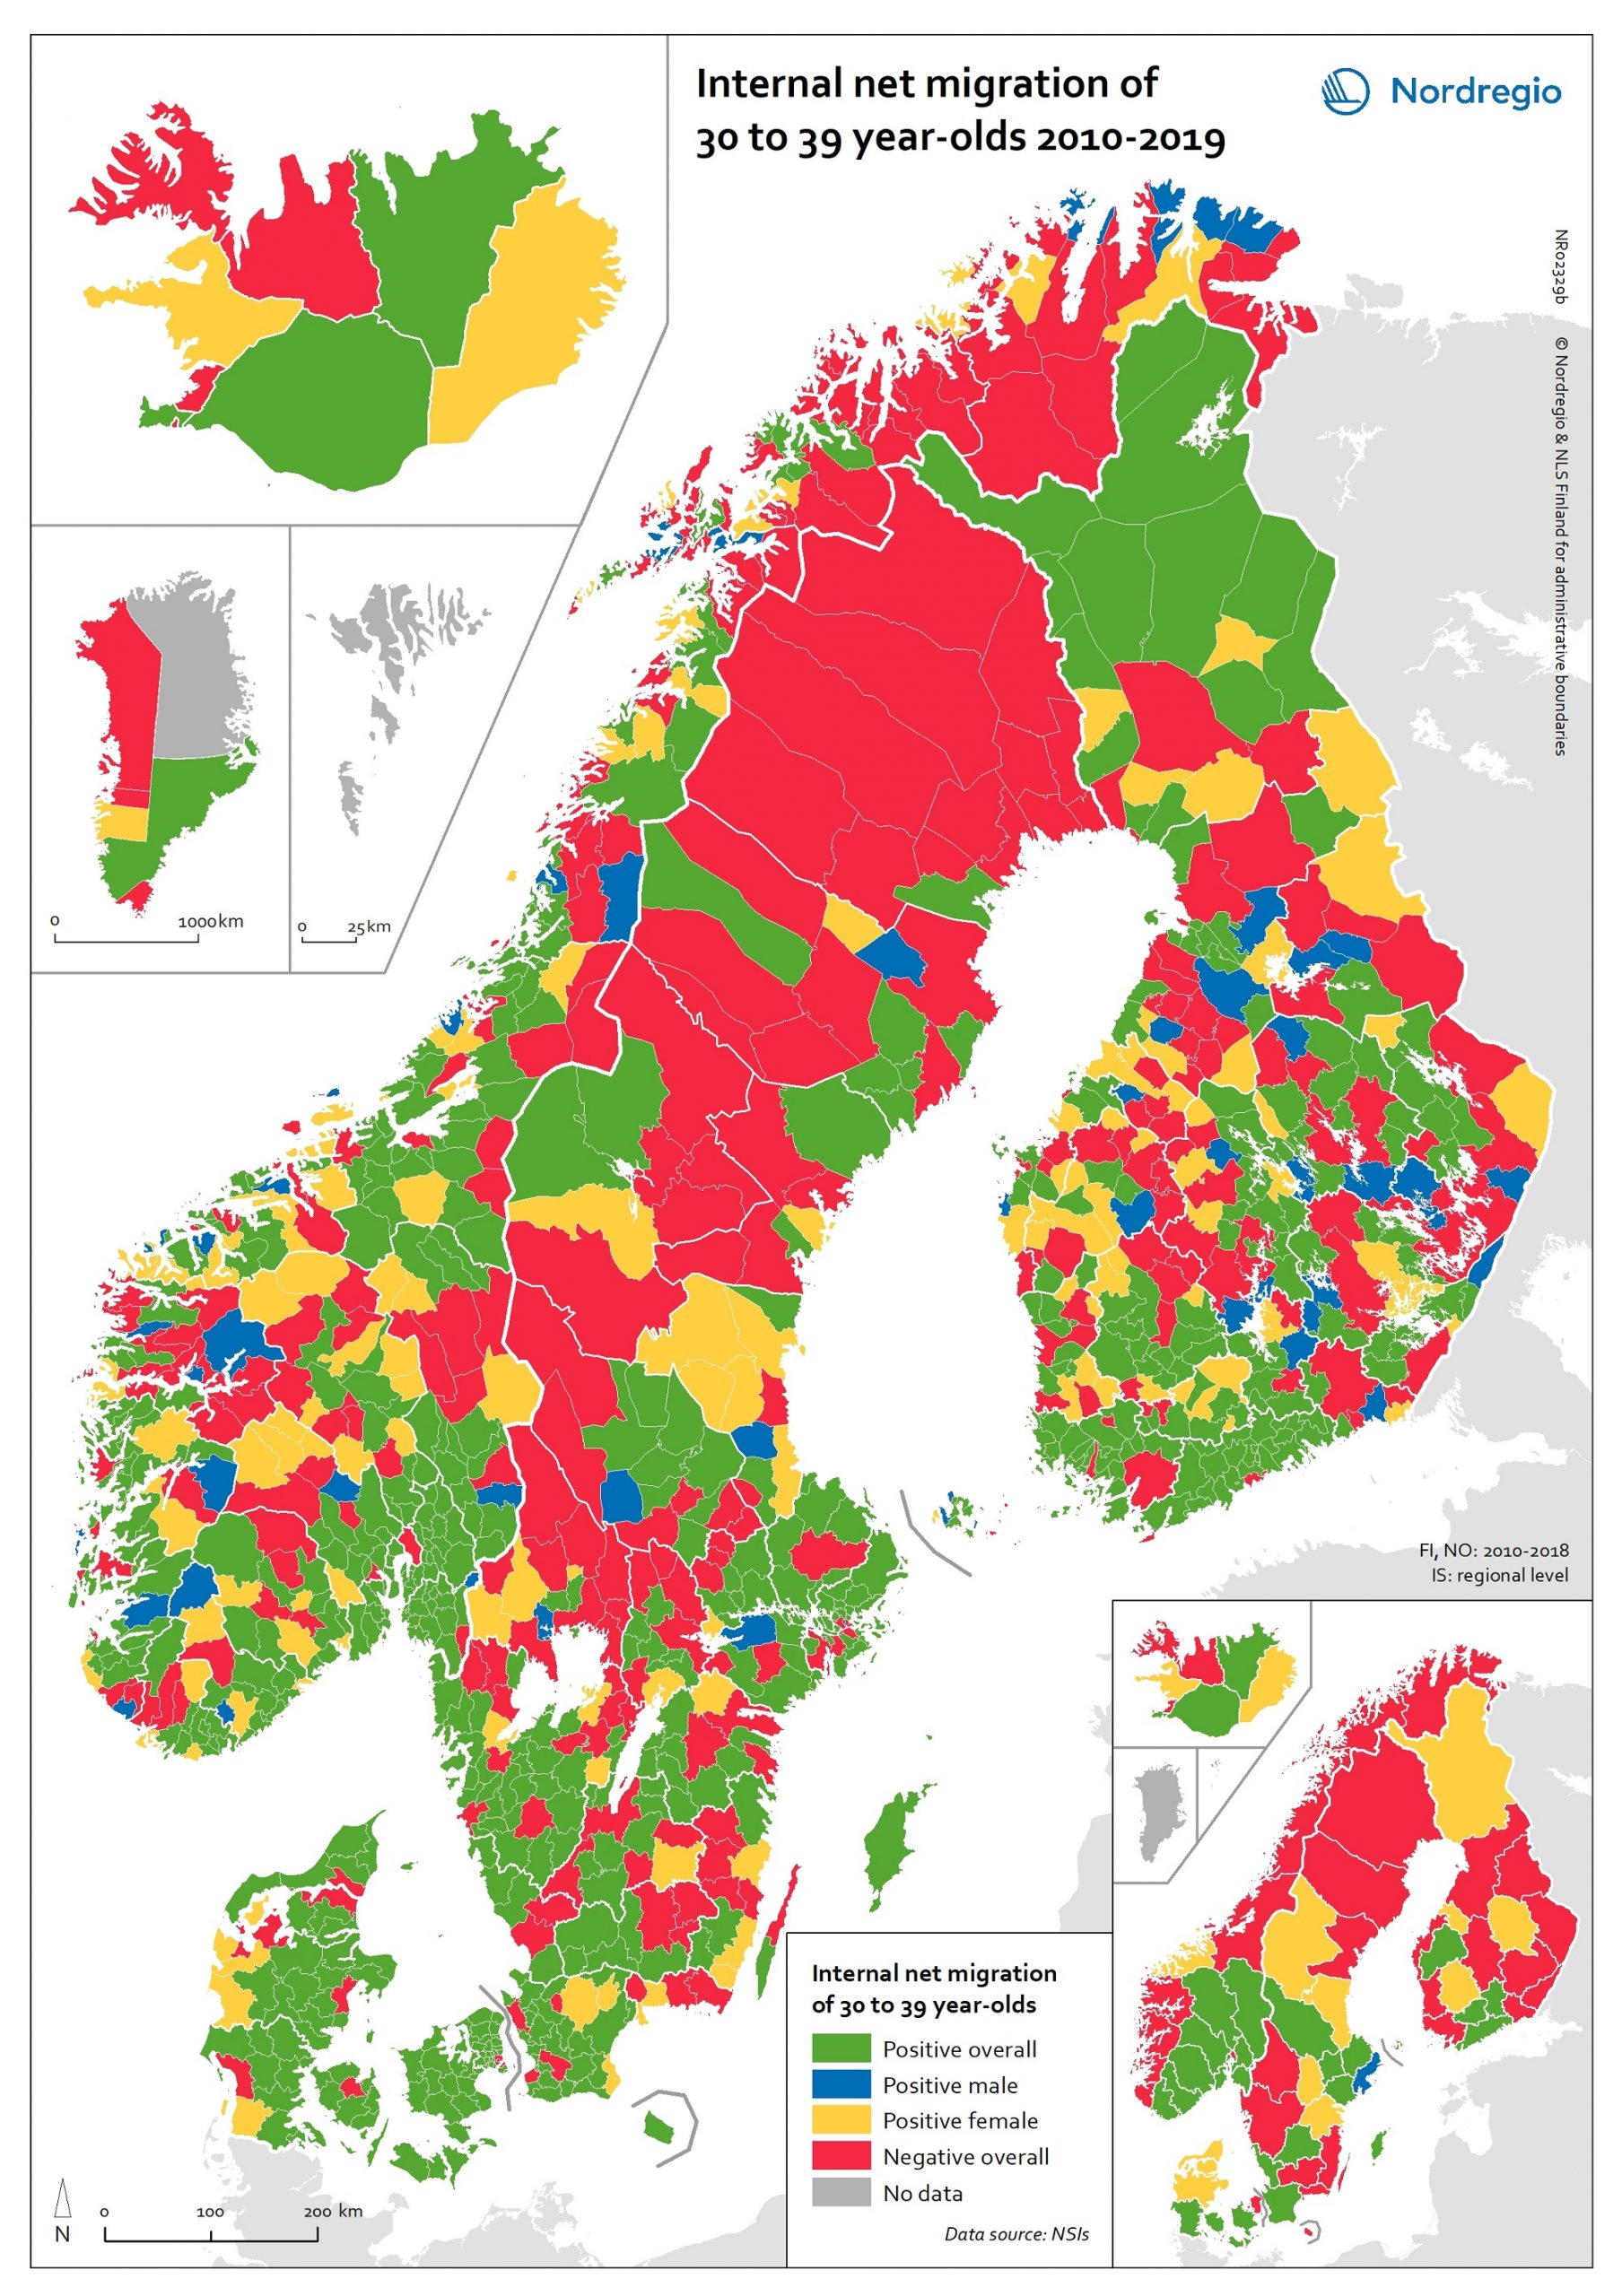
Internal net migration of 30 to 39 years-of-age, by gender, in 2010-2019
This map shows a typology that divides the Nordic municipalities and regions into four migration categories: positive net migration for both males and females (green on the map), positive male net migration (blue on the map), positive female net migration (yellow on the map), and negative net migration for both males and females (red on the map). These migration flows on 30 to 39-year-olds are of particular interest since it is often assumed that the future of rural regions is dependent upon their capability both to retain their populations and to attract newcomers, returning residents and second home owners. In this context, the map provides a rather positive picture, because a considerable proportion of rural municipalities have experienced positive net migration among females, males, or both sexes across all the Nordic countries. Even so, there is negative net migration among both females and males in many municipalities in northern Sweden, north-eastern Norway and eastern Finland, in addition to several inland municipalities within these countries. Interestingly, there is negative net migration among both sexes across all the capital city municipalities of the Nordic Region. According to the regional map, the capital city regions of Denmark, Iceland and Norway all experienced negative net migration of young people aged 30-39 years between 2010 and 2019. The capital city region of Sweden experienced positive net migration of males and negative net migration of females while the capital city region of Finland experienced positive net migration overall. Despite the majority of peripheral regions experiencing negative net migration of 30 to 39-year-olds during the time period studied, there are also several interesting examples of rural regions which experienced positive female net migration, for example Nordjylland (Denmark), Pohjois-Savo (Finland), Austurland (Iceland), Møre og Romsdal (Norway), and Jämtland (Sweden).
- 2020 October
- Demography
- Migration
- Nordic Region
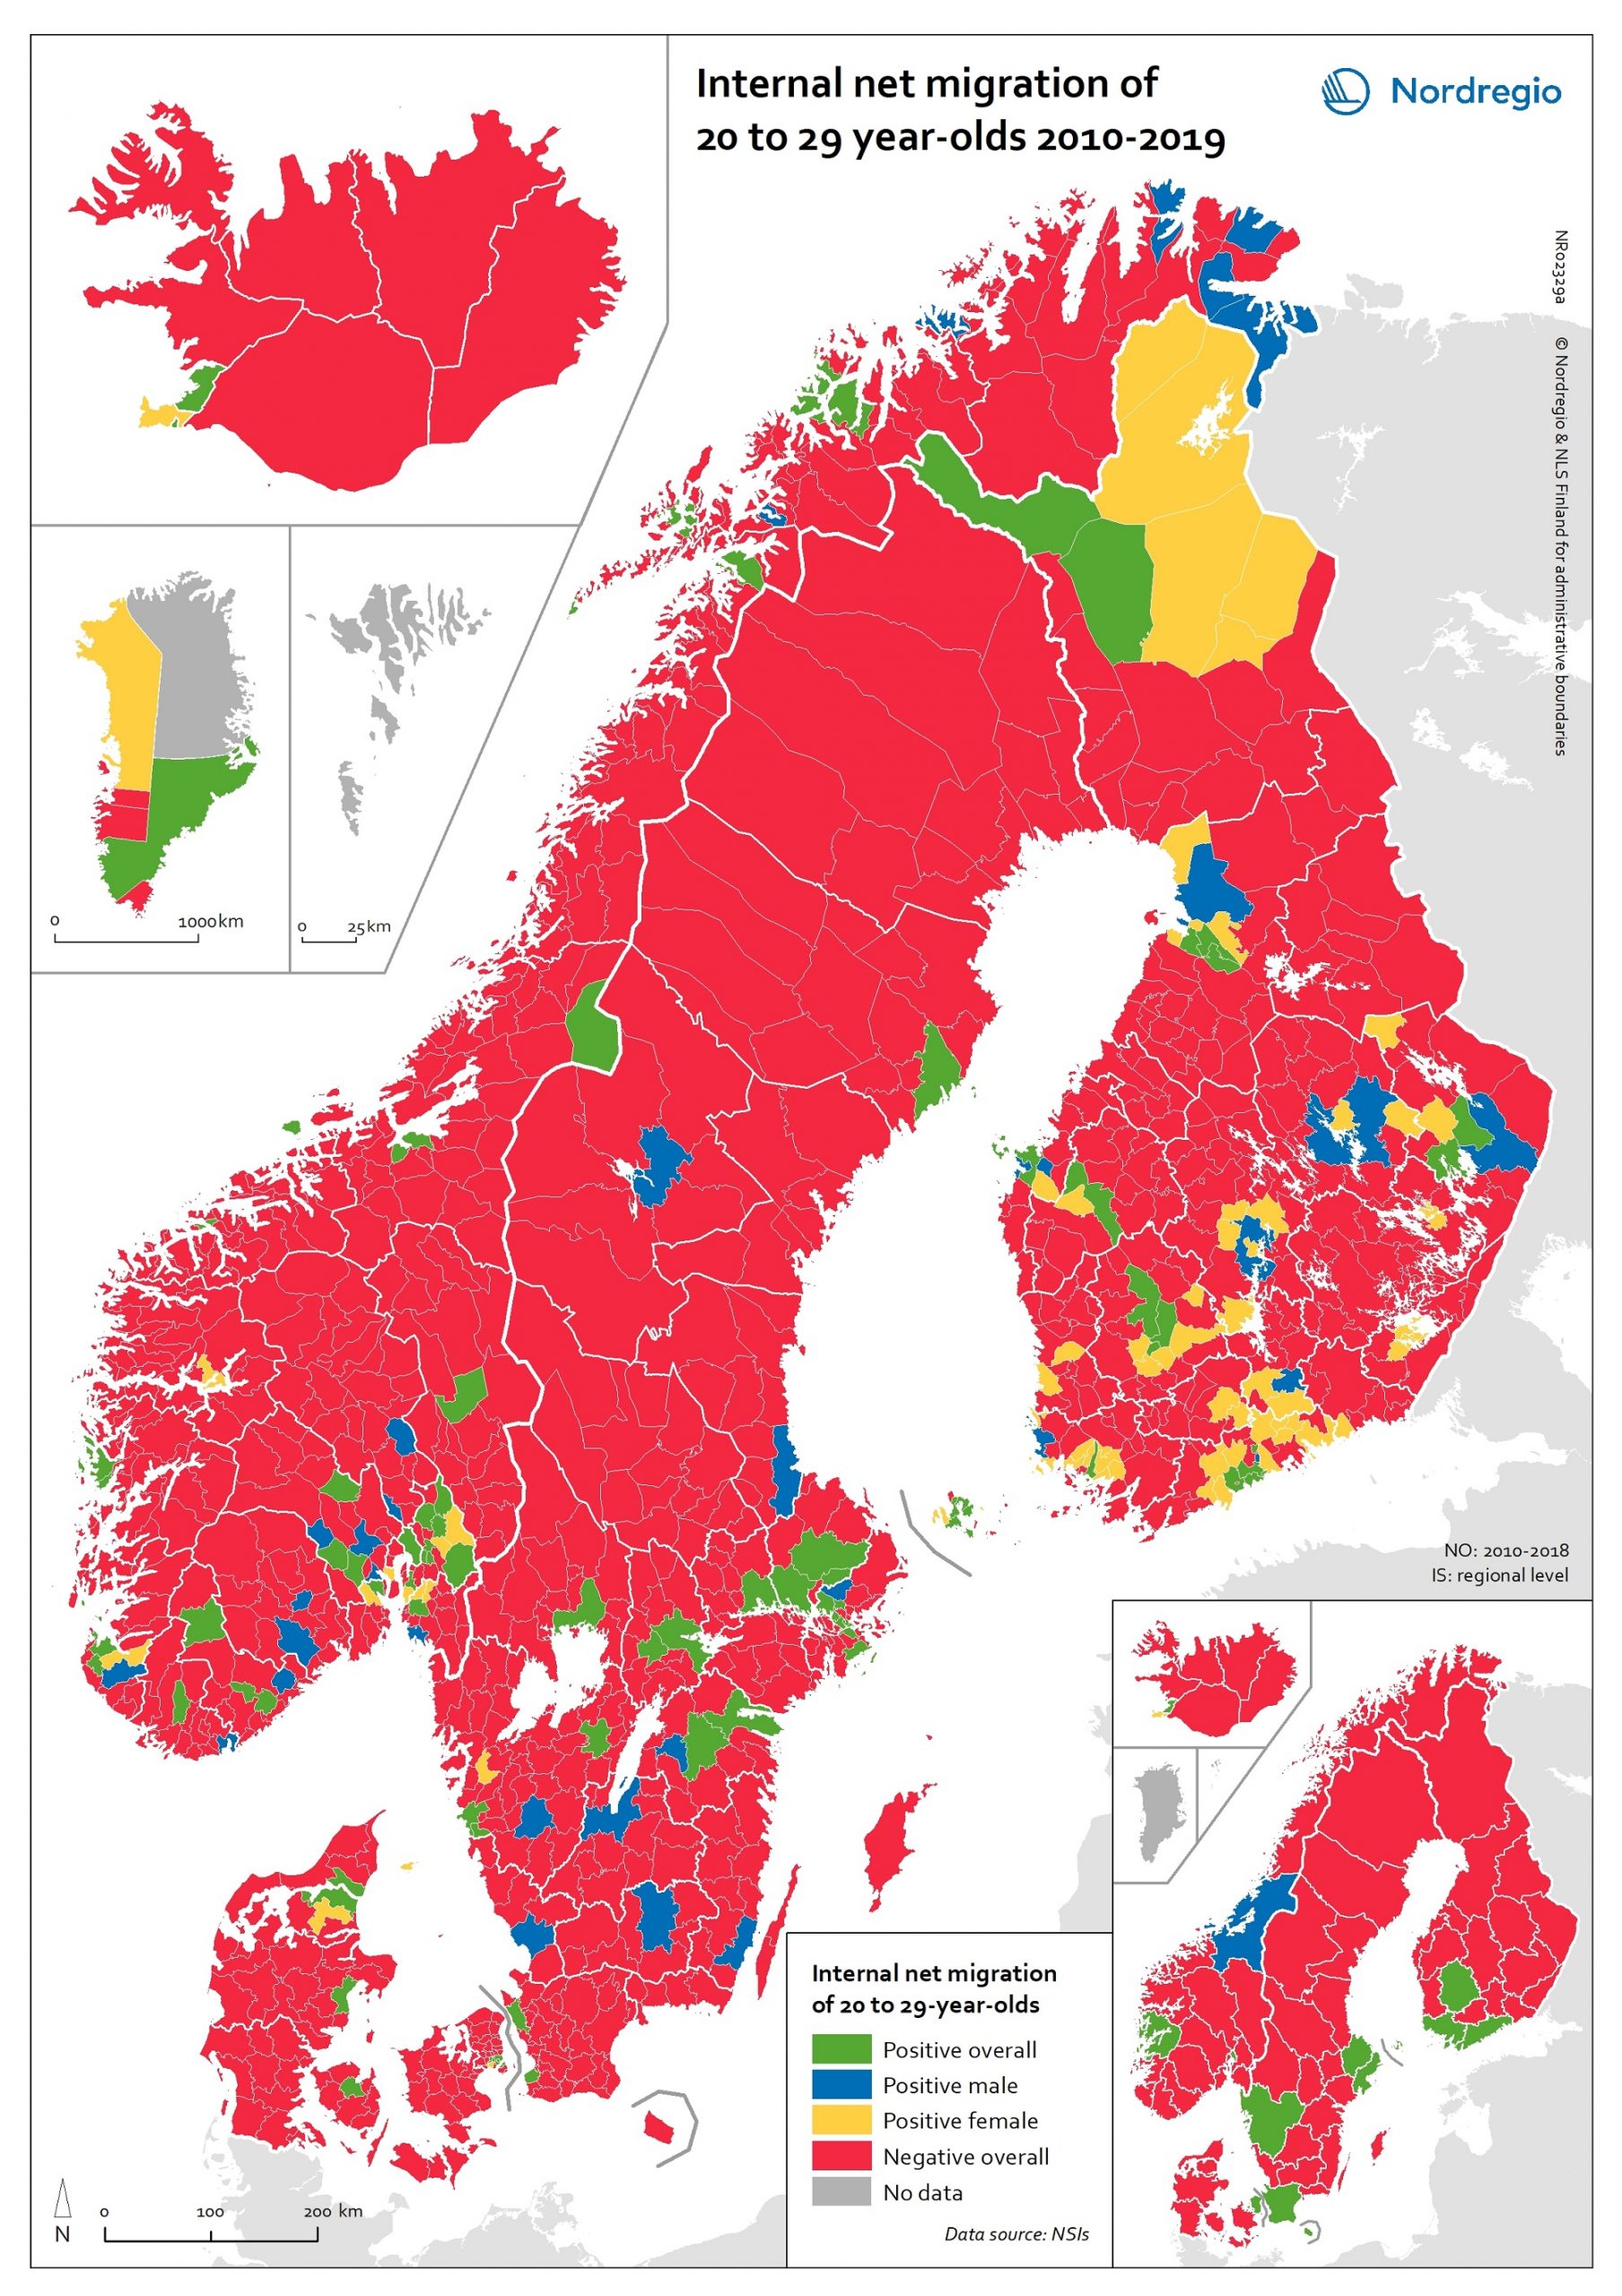
Internal net migration of 20 to 29 years-of-age, by gender, in 2010-2019
This map shows a typology that divides the Nordic municipalities and regions into four migration categories: positive net migration for both males and females (green on the map), positive male net migration (blue on the map), positive female net migration (yellow on the map), and negative net migration for both males and females (red on the map). These migration flows of 20 to 29-year-olds are of interest since there is a particularly high level of internal migration among young adults across the Nordic countries compared to other EU countries. While the map shows that the great majority of municipalities experience negative net migration of young adults in favour of a few functional urban areas and some larger towns, it is possible to observe a number of exceptions to this general rule. The rural municipalities of Utsira, Moskenes, Valle, Smøla, Ballangen and Lierne in Norway have the highest positive net migration rates both for men and women. There are also positive net migration rates for males and females in the peripheral municipalities of Jomala, Kittilä, Lemland and Finström in Finland and Åland. There is positive male net migration but negative female net migration in Gratangen, Loppa, Gamvik, Drangedal and a few other Norwegian rural municipalities, plus Mariehamn in Åland, while several municipalities in remote areas of Finland have positive female net migration but negative male net migration. Some of these patterns may be related to specialised local labour markets, such as fisheries in Loppa, or recreational tourism in Kittilä. In general, the pattern of net migration among young adults is more diverse in Finland (where 72.0% of all municipalities have negative net migration), compared with 84.6% in Norway, 88.9% in Denmark and 89.0% in Sweden. However, it is important to remember that Danish, Finnish and Norwegian municipalities are smaller in size…
- 2020 October
- Demography
- Migration
- Nordic Region
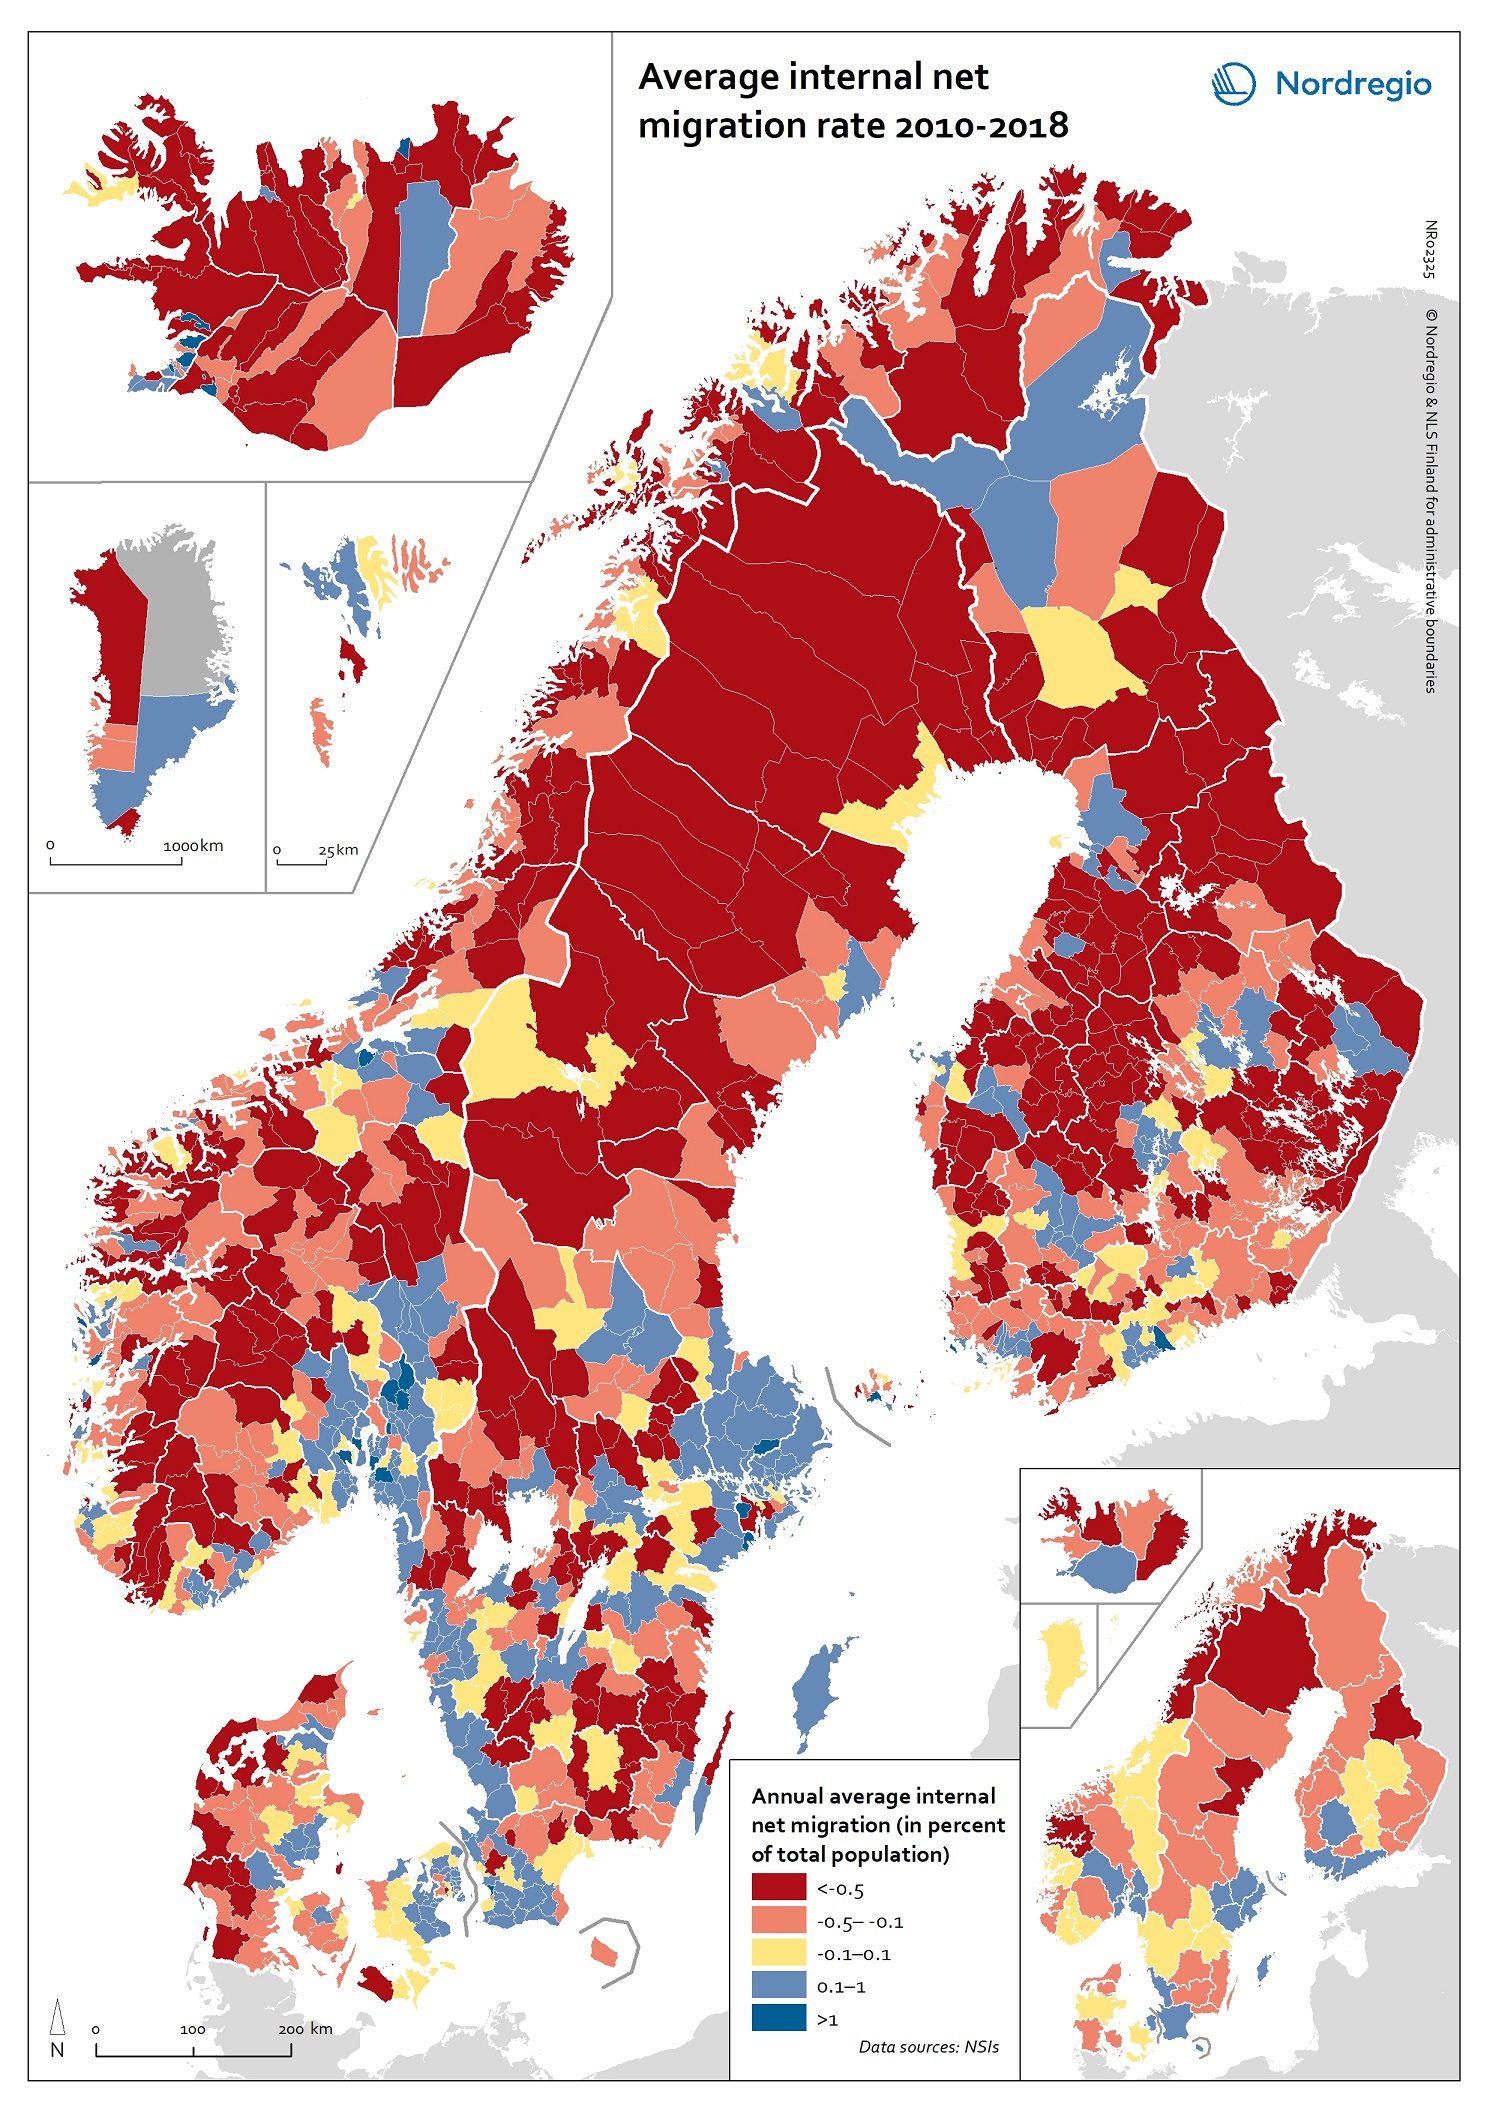
Internal net migration as percentage of population 2010–2018
This map shows annual average internal net migration rate at the municipal and regional level in 2010-2018. The map shows the percentage change from internal migration for the period 2010 to 2018. Internal or domestic migration refers to migration between municipalities and regions within the same country. The blue areas on the map show municipalities/regions with positive internal net migration (i.e. more people arriving than departing), the red areas show municipalities/regions with negative internal net migration (i.e. more people departing than arriving) and the yellow areas show municipalities/regions with balanced internal net migration rates (i.e. comparable numbers of people arriving and departing). The trend revealed is that internal migration movements are directed towards larger city regions, with many rural periphery regions losing people. The loss of people in some of these regions is felt especially acutely because of the age selectivity of migration, with young people leaving in large numbers, accelerating the ageing of the population structure in regions with high out-migration. Read the digital publication here.
- 2020 February
- Demography
- Migration
- Nordic Region
