62 Maps
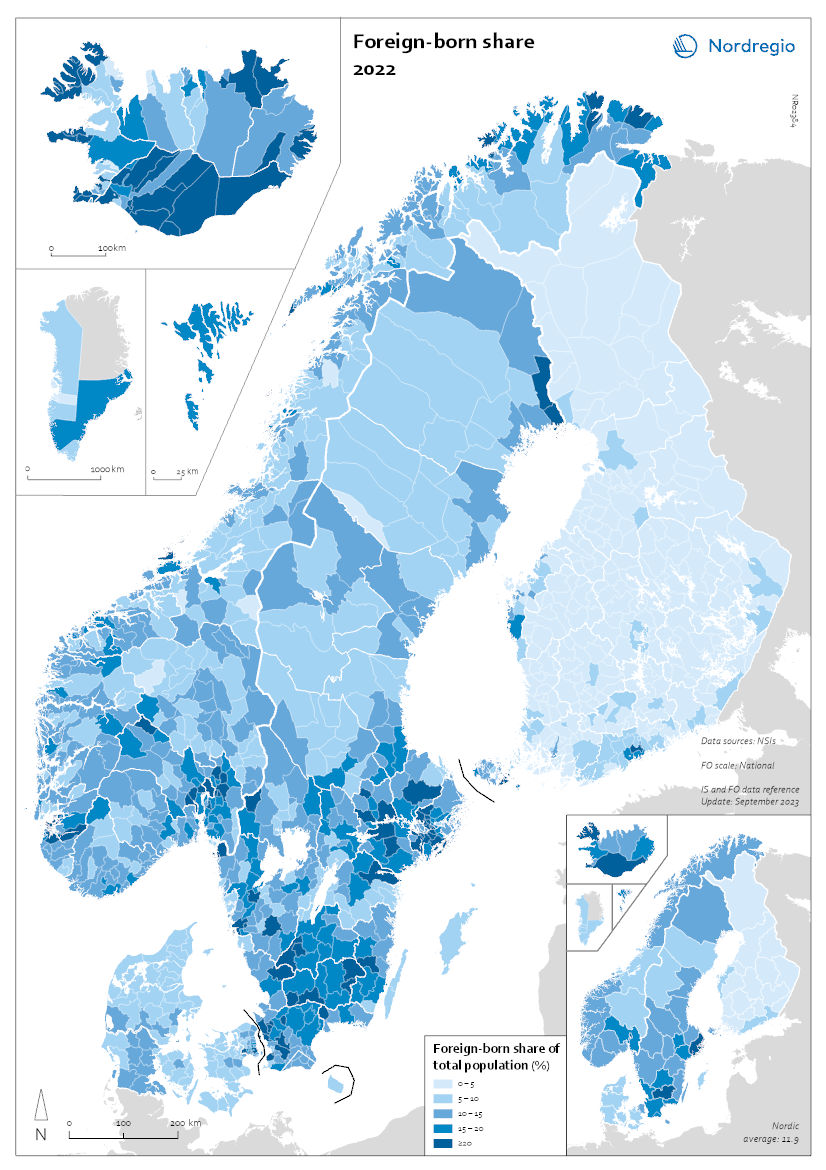
Foreign-born share 2022
This map shows the share of foreign-born of the total population in the Nordic countries. This map shows the share of foreign-born of the total population in Nordic municipalities (big map) and regions (small map), and municipalities (big map) in 2022. Iceland has the highest share of foreign-born residents in the Nordic Region, at 22%. Mýrdalshreppur, the municipality in the south containing the village of Vik, has the largest foreign-born population, at 58%. It is also the only municipality in the Nordic Region with a majority non-native population. Other municipalities in the south, some of which are quite small, also have significant foreign-born populations. Reykjanesbær, near Keflavik airport, is the largest municipality with a sizeable foreign-born population, at 29%. In Reykjavíkurborg, 20% of the population is foreign-born, about the same as the national average. Many municipalities with tiny populations in the Westfjords and the north also have small shares of foreign-born persons. In 2022, 17% of the population of Norway was foreign-born. Municipalities with high shares of foreign-born include Oslo (28%), several suburban municipalities near Oslo, and a few in the north – which have small overall populations but large numbers of foreign workers employed in the fishing industry. In Sweden, 20% of residents are foreign-born, with large differences in distribution by region and municipality. At the regional level, Stockholm has the highest share of foreign-born persons (27%), followed by Skåne, including the city of Malmö (24%). The percentage of foreign-born persons in Västra Götaland, which encompasses Gothenburg, is the same as that of Sweden as a whole. The regions with low shares of foreign-born persons are in the north of the country – Dalarna, Gävleborg, Västernorrland, Jämtland, Västerbotten, and Norrbotten – plus the island of Gotland, which has the lowest share (9%). There are no municipalities in which foreign-born…
 2025 April
 - Demography
- Migration
- Nordic Region
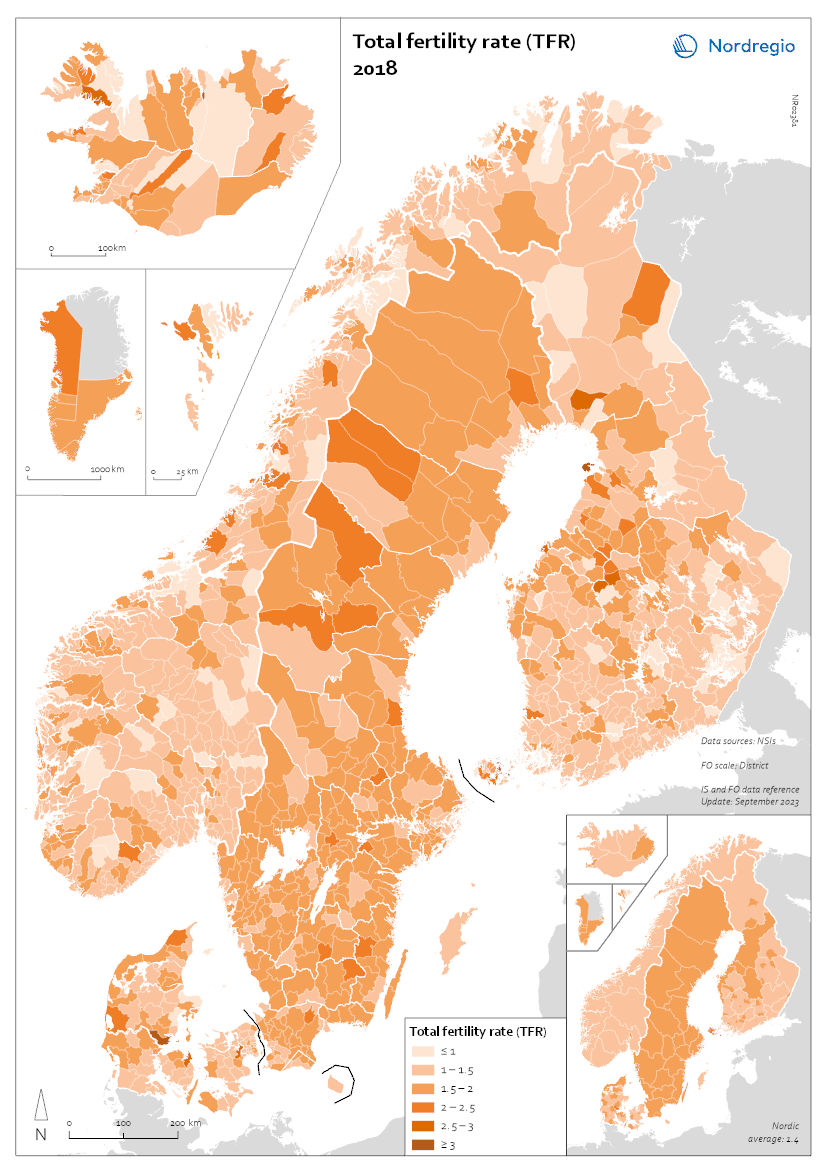
Total fertility rate (TFR) 2018
This map shows the total fertility rate (TFR) in 2018. The total fertility rate is the number of children a hypothetical cohort of women would have in one year. Data on total fertility rates is not available at the regional or municipal levels for all of the Nordic countries. The figures are estimated based on multiplying the general fertility rate by 30 (representing the typical number of reproductive years, between 15 and 45), assuming the general fertility rate is constant throughout this period. The general fertility rate is the number of births per woman during the childbearing years. At the regional level, age and gender composition are indicative of past trends but also harbingers of future population change. In 2018, prior to the pandemic, most Nordic municipalities had fertility levels in line with their respective national levels. Most municipalities within Greenland and the Faroes had fertility rates above 1.5 children per woman, consistent with national rates of about 1.9. Municipalities in Sweden and Denmark typically had fertility rates of 1.5 or higher, consistent with their national rates of 1.7. By contrast, many municipalities in Norway and Finland had fertility rates of 1.5 or lower. Iceland and Åland also showed varying rates across municipalities, ranging from 1 to over 1.5.
- 2025 April
- Demography
- Nordic Region
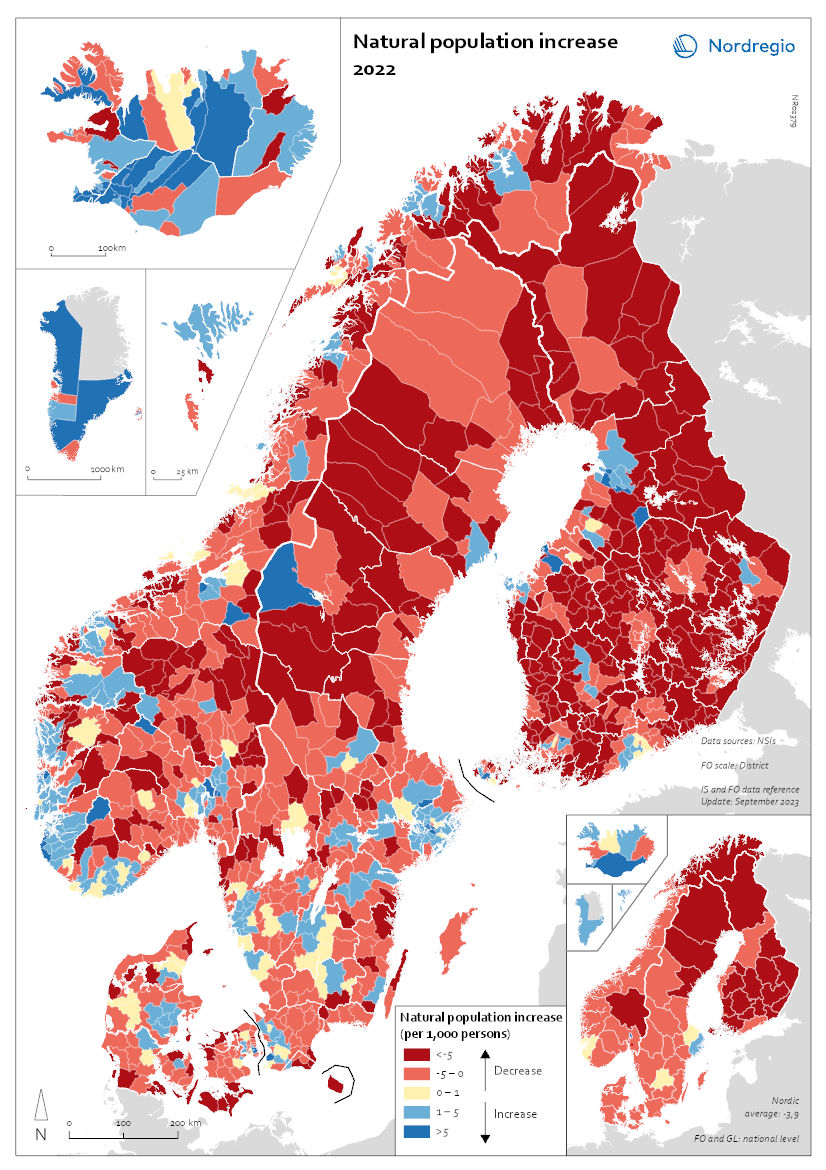
Natural population increase 2022
This map shows the natural population change per 1,000 persons in 2022. This map shows the natural population change per 1,000 persons in 2022 (i.e. between 1 Jan and 31 Dec 2022). Natural population change refers to births minus deaths (i.e. population change disregarding migration). The small map shows the result on a regional level, and the big map shows changes on the municipal level. Red shades refer to population decrease, blue shades to population increase, and yellow shades to balanced development. The map shows that levels of natural population change do not only vary across but also within the Nordic countries. Urban areas such as Stockholm and Gothenburg in Sweden; Oslo and Bergen in Norway; Copenhagen and Aarhus in Denmark; as well as Helsinki and Turku in Finland all experienced positive natural population change. This can be attributed to the comparatively young population age structure of these urban centres. Young people of child-bearing age often cluster in cities for study and work, and many start families there. By contrast, rural and remote areas often have a higher proportion of older people and, as such, tend to register more deaths than births, resulting in negative natural population change. These patterns are particularly pronounced in Finland but also in the northern parts of Sweden and Norway. Nonetheless, there are exceptions. In Iceland, Greenland, and the Faroe Islands, which had comparatively high levels of natural population growth at national level, a majority of municipalities, including many in rural areas, still registered more births than deaths in 2022 (77% of municipalities in Iceland, 60% in Greenland, 67% on the Faroe Islands). In the other Nordic countries, only a minority of municipalities, mostly in urban centres, recorded natural population increase in 2022 (30% in Norway and Sweden, 26% in Denmark, 12% in Finland).
- 2025 April
- Demography
- Nordic Region
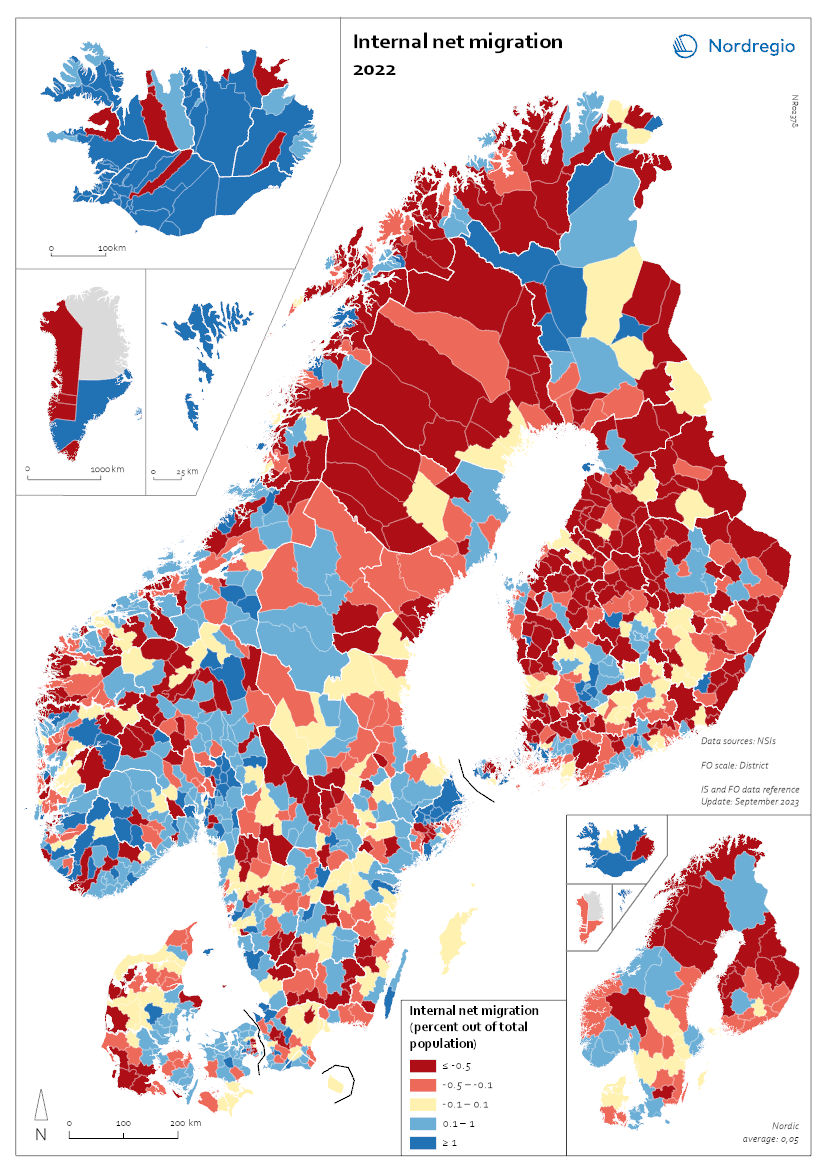
Internal Migration 2022
This map shows the internal net migration in 2022 as a percentage of the total population. This map shows the internal net migration in 2022 as a percentage of the total population. The small map shows the result on a regional level, and the big map on the municipal level. Internal (sometimes referred to as domestic) net migration refers to migration between municipalities and regions within the same country. International migration is excluded. In 2022, internal net migration was positive (indicated by shades of blue) or at least balanced (shown in yellow) in several municipalities in central and southern Sweden and Norway, as well as in central and northern Finland – areas that traditionally were more likely to lose population due to internal migration. Conversely, several municipalities in the capital regions – such as Stockholm, Oslo, and Copenhagen – exhibited negative internal net migration. Several municipalities across the Nordic Region, including in more remote and rural areas, continued to register positive internal net migration in this year. In Iceland, positive migration predominated in most of the municipalities, and the Faroe Islands also presented positive net migration. Greenland oscillated mainly between positive and negative migration flows, while Åland presented the whole spectrum of positive, balanced, and negative net migration for this year.
- 2025 April
- Demography
- Nordic Region
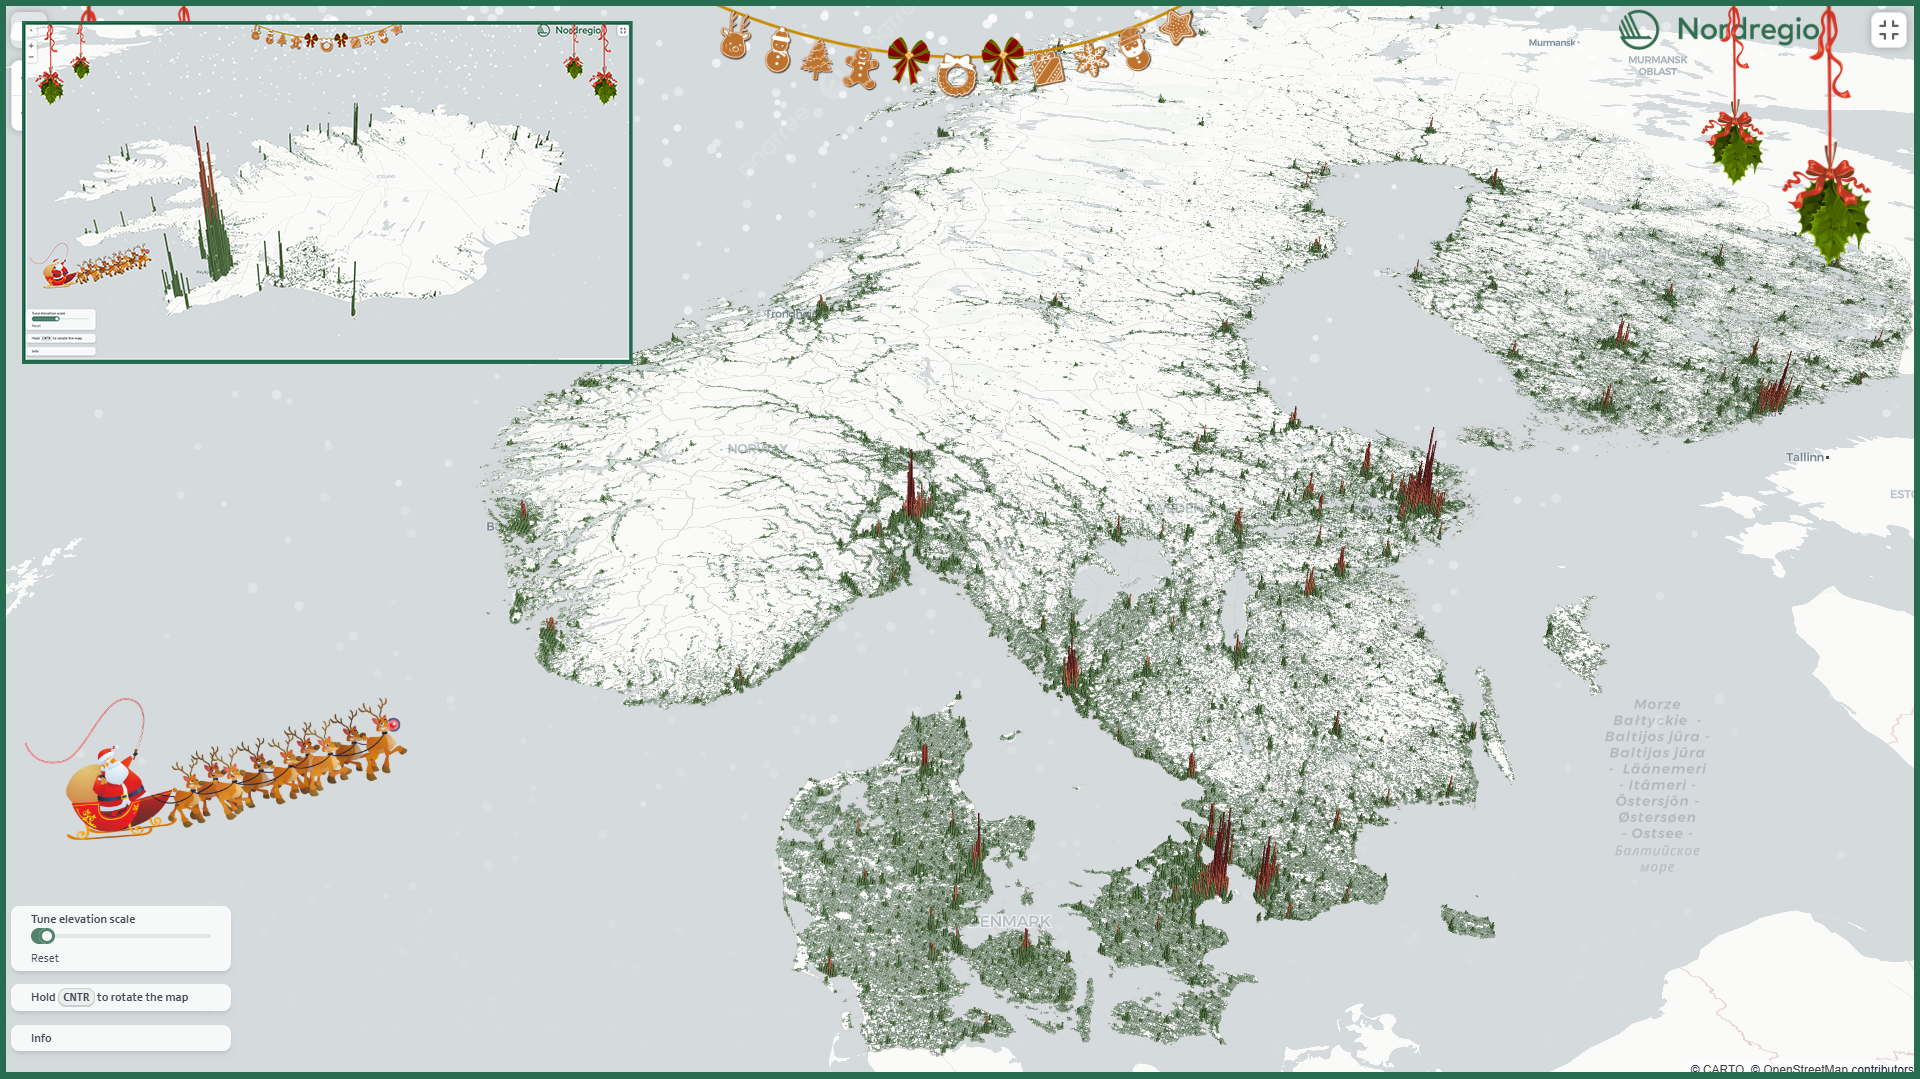
A 3D population map for the holiday season
This Christmas, we’re gifting all fellow data nerds our first-ever interactive 3D map! The map displays the number of residents in each 1km grid cell, with the height of the bars representing the number of residents in each area.
- 2024 December
- Demography
- Nordic Region
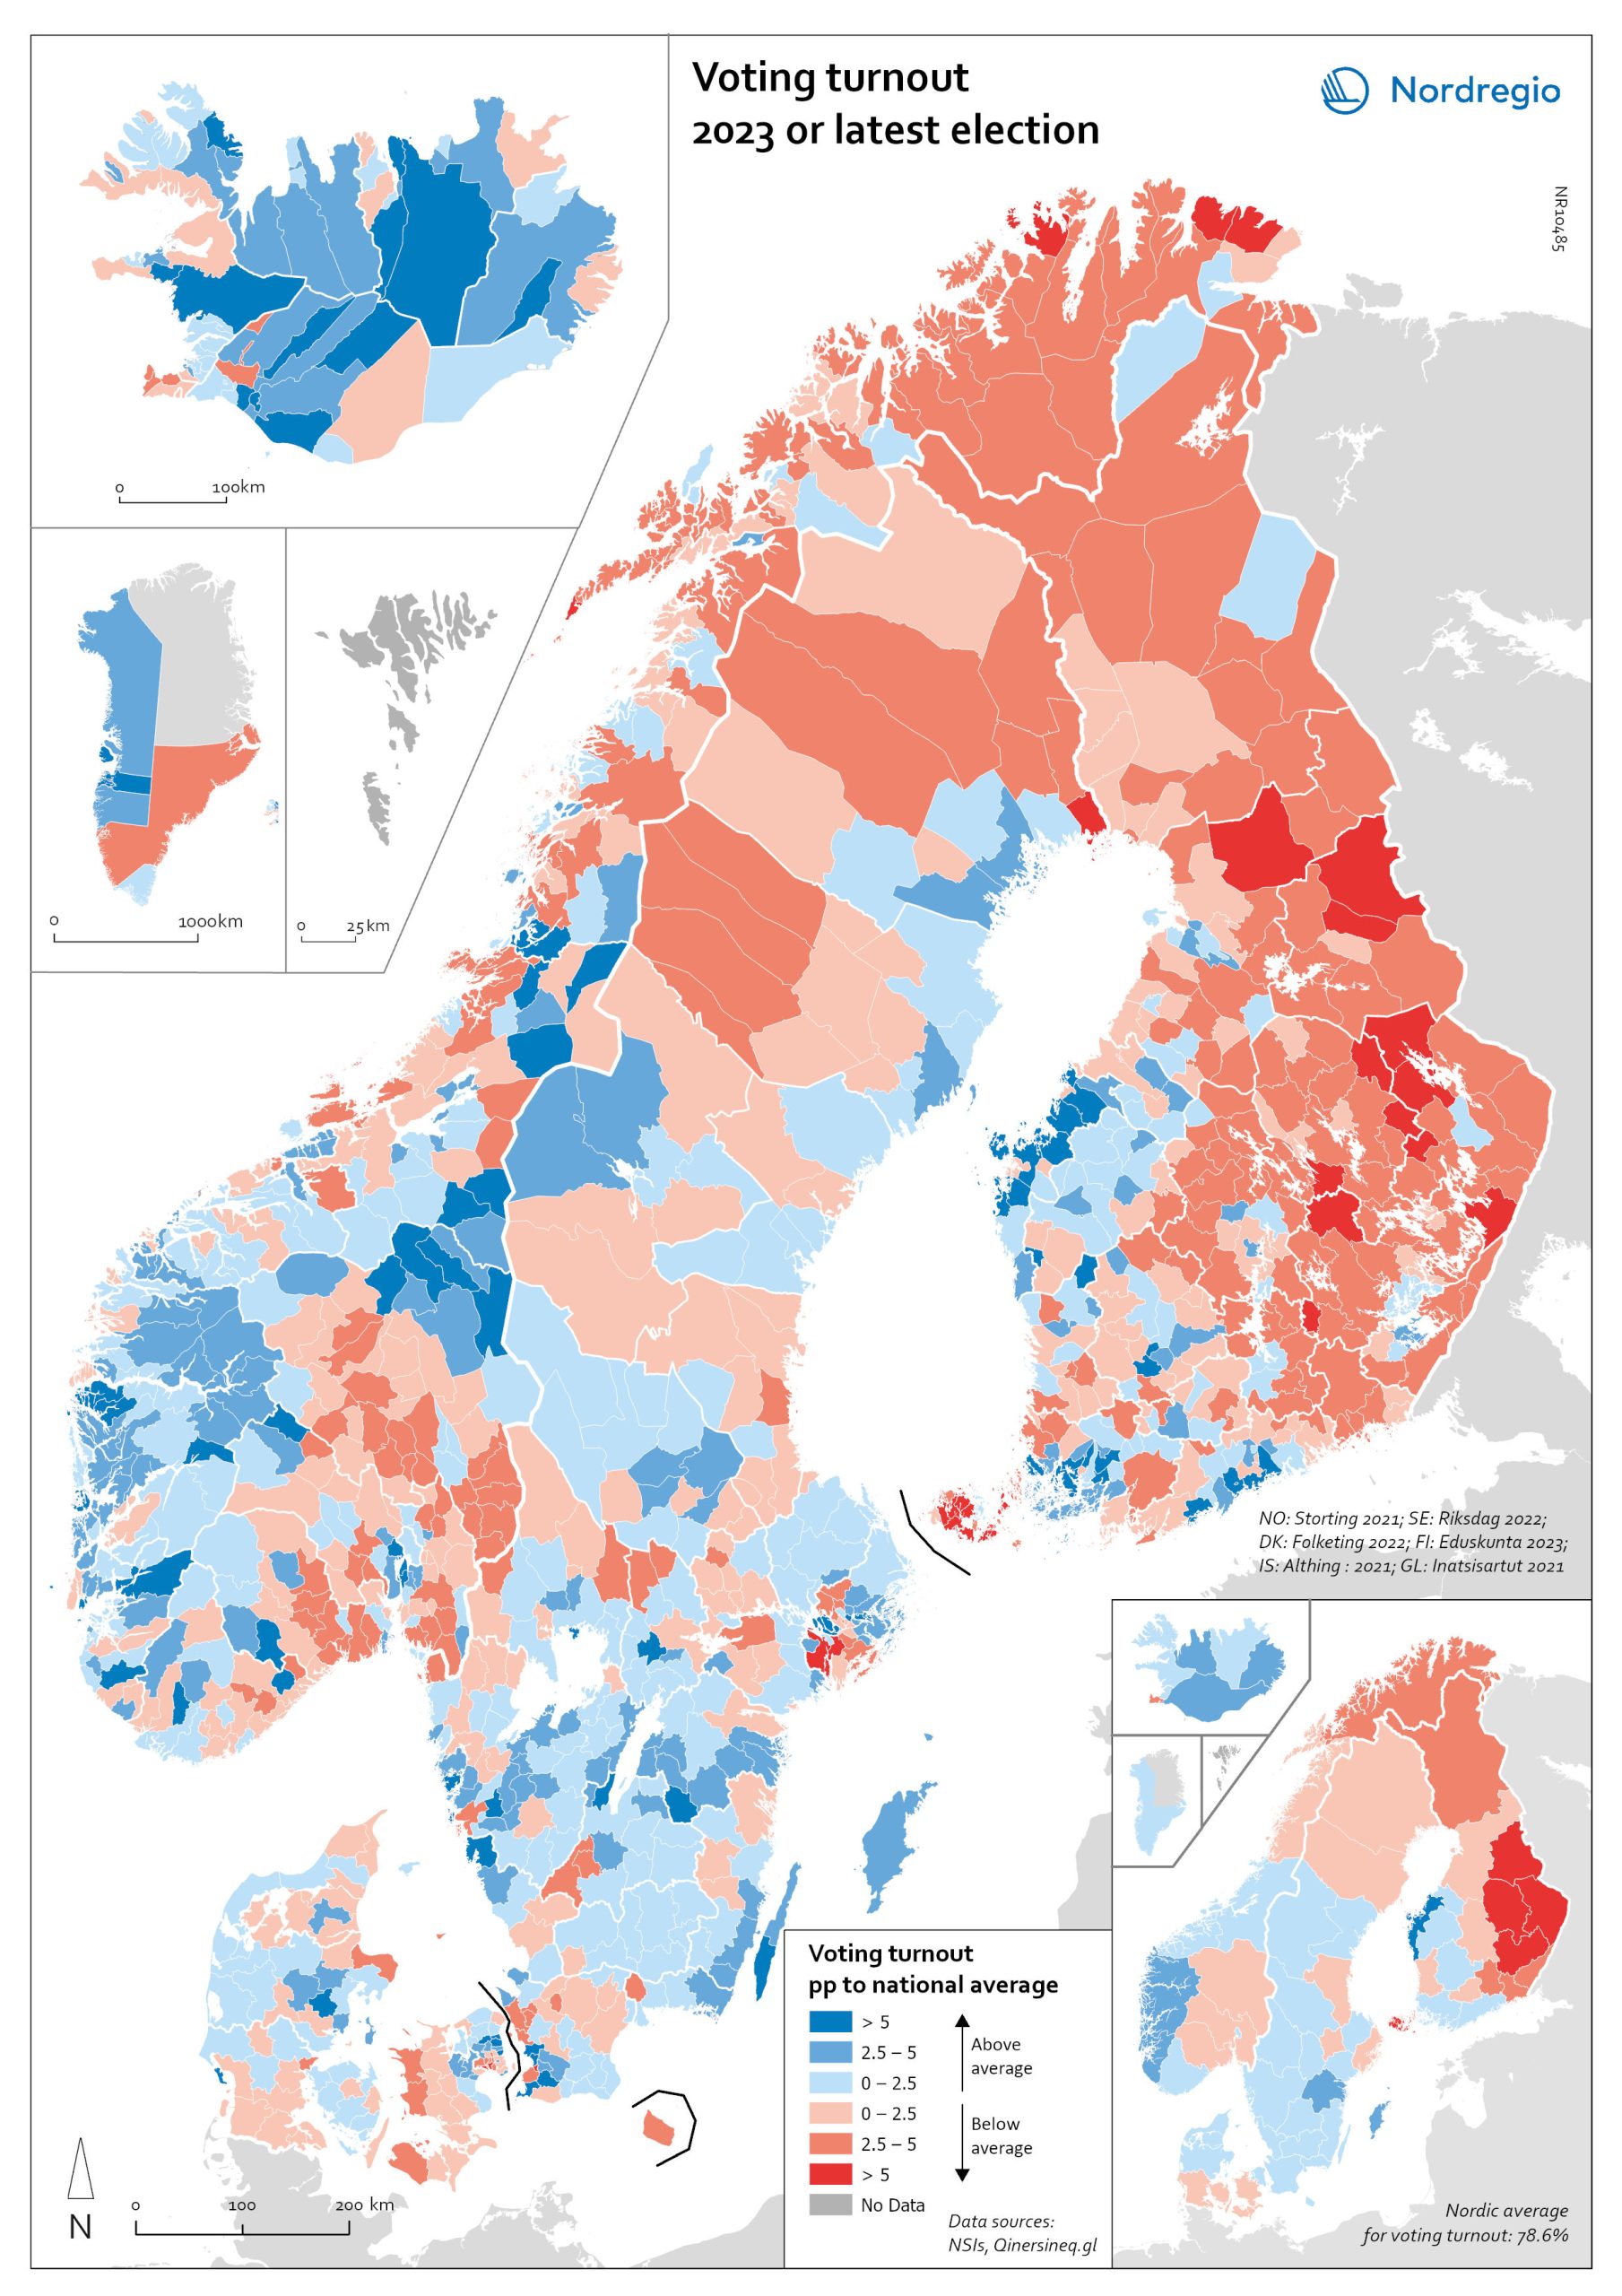
Voting turnout in national elections
Voting turnout in 2023 (or latest national election). The map illustrates voter turnout as a percentage point relative to national averages, highlighting differences in participation levels between countries. This method removes inter-country differences in participation levels, providing a clearer view of the urban-rural divide. Lower turnout is observed in eastern Finland, northern Sweden, and the more rural parts of Denmark. In Norway, the lowest turnout occurs in the north and in municipalities outside Oslo. Nationally, the highest voter turnouts are in the Faroe Islands (88%), Sweden (84.2%), and Denmark (84.16%). Lower participation rates are found in Iceland (80.1%), Norway (77.2%), Finland (68.5%), and Greenland (65.9%).
- 2024 May
- Nordic Region
- Others
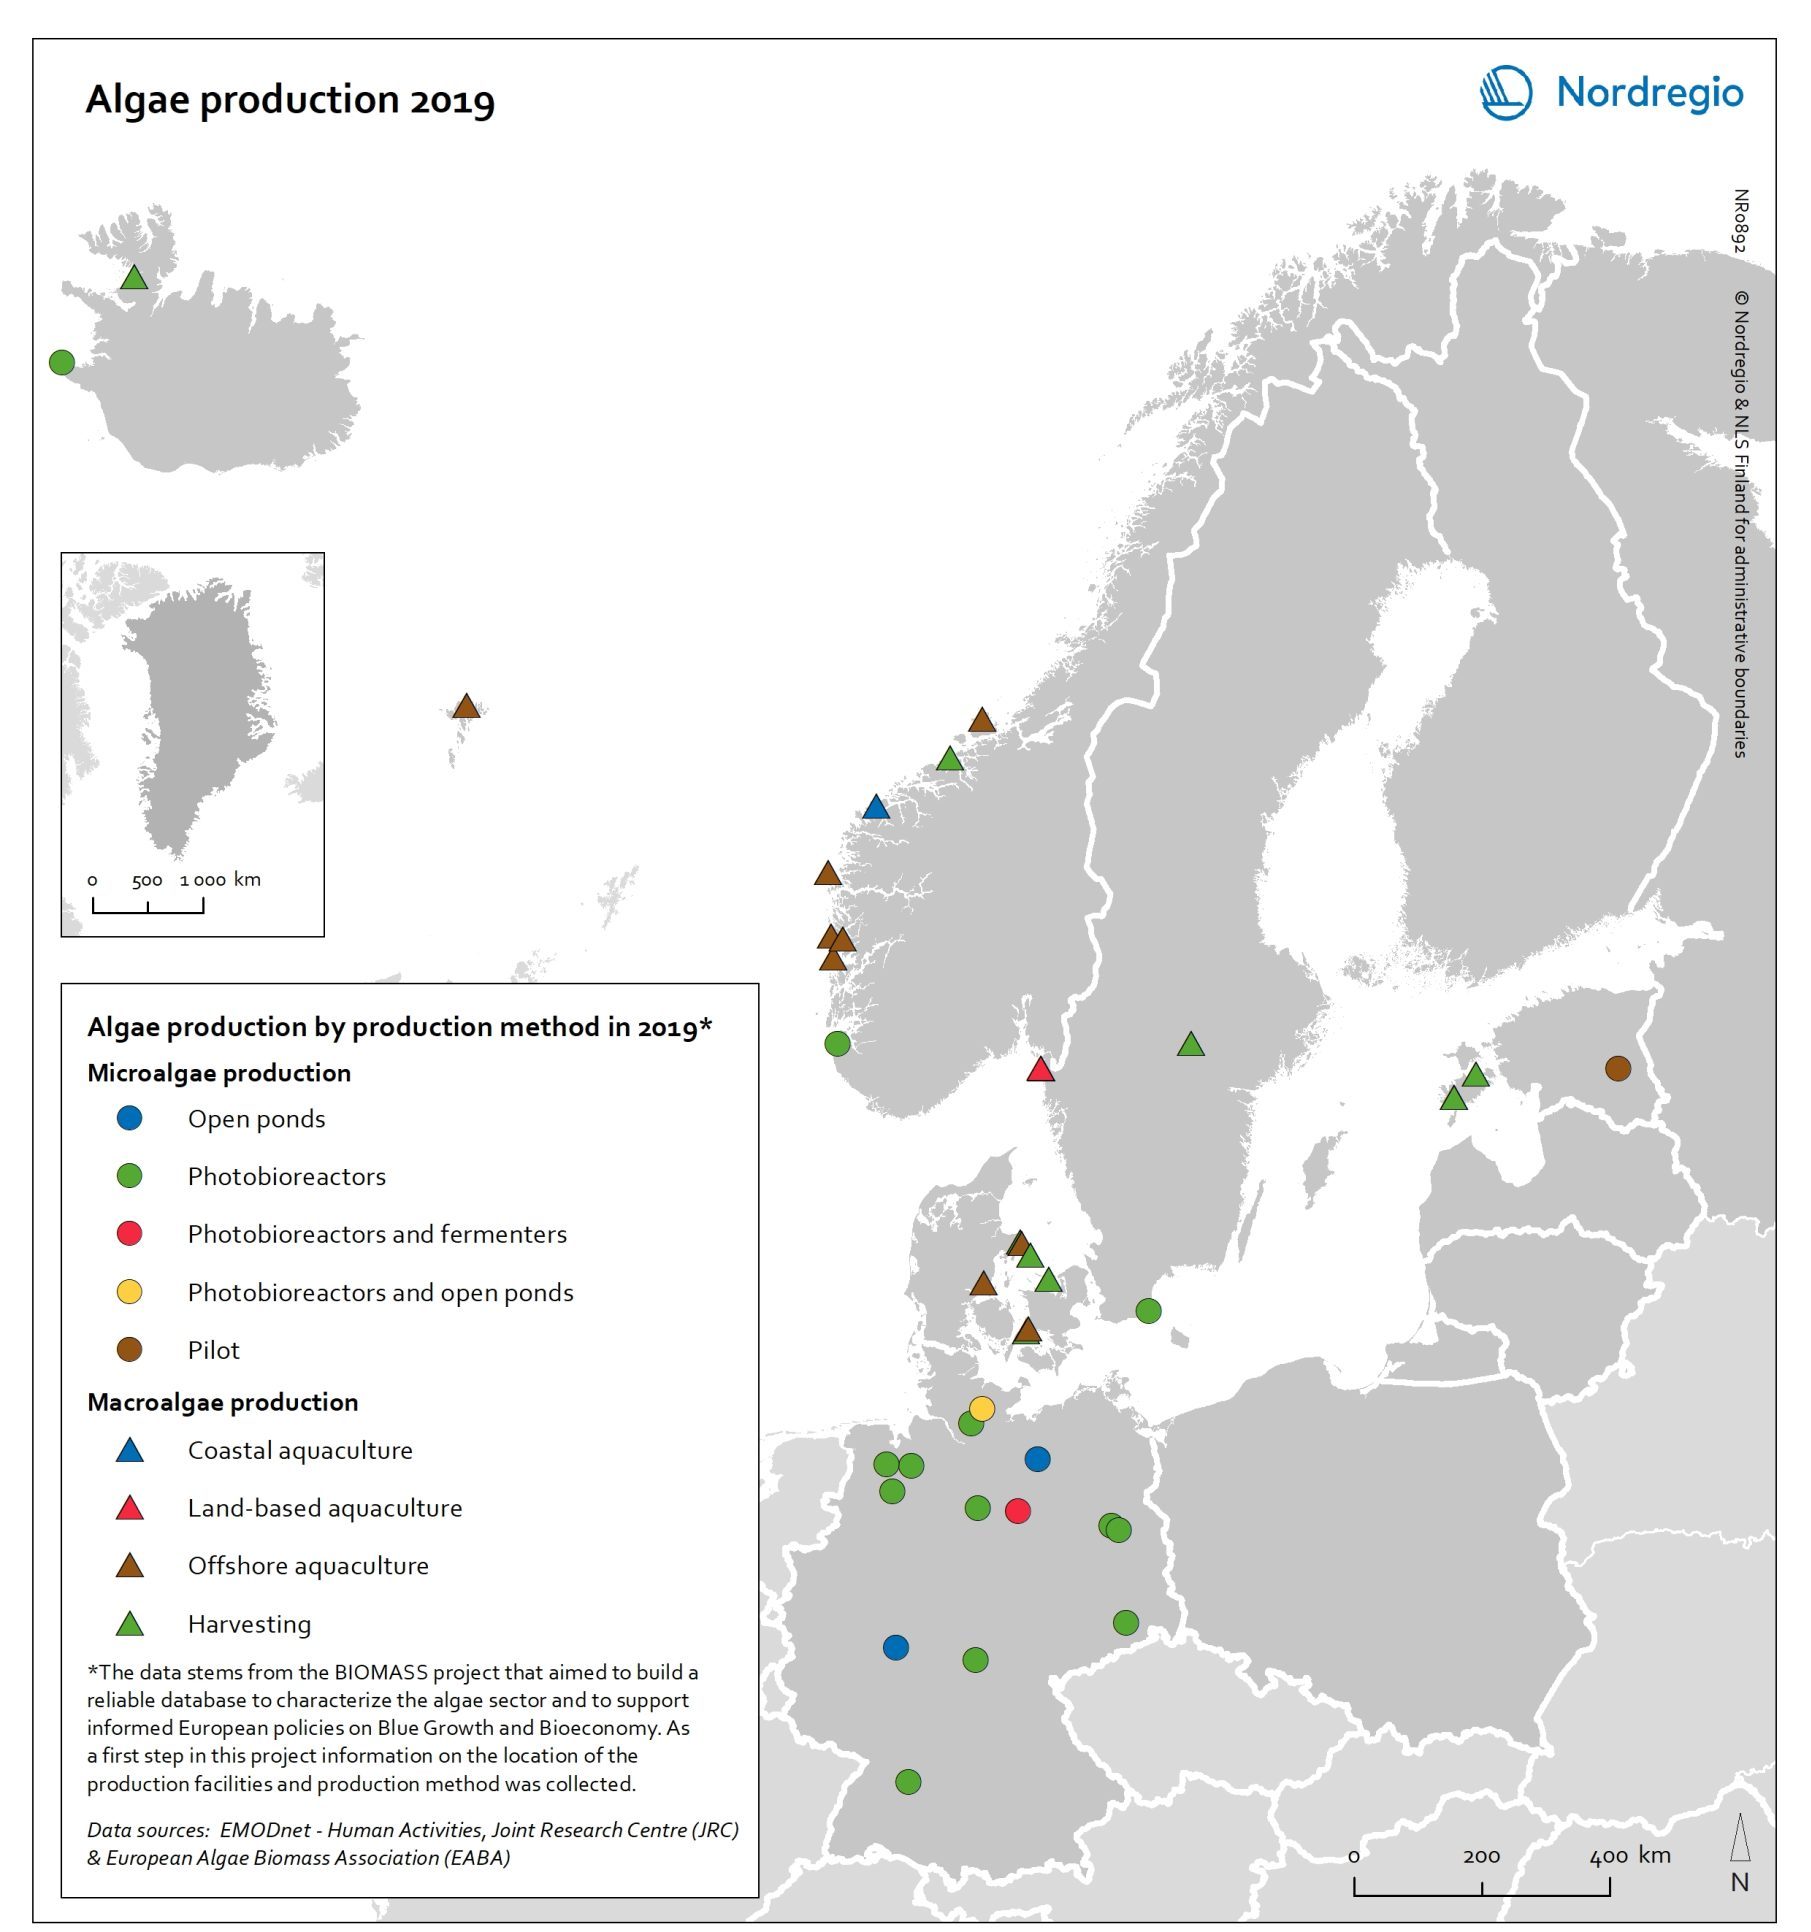
Algae production in 2019
This map shows location of algae production by production method in the Nordic Arctic and Baltic Sea Region in 2019 Algae and seaweeds are gaining attention as useful inputs for industries as diverse as energy and human food production. Aquatic vegetation – both in the seas and in freshwater – can grow at several times the pace of terrestrial plants, and the high natural oil content of some algae makes them ideal for producing a variety of products, from cosmetic oils to biofuels. At the same time, algae farming has added value in potential synergies with farming on land, as algae farms utilise nutrient run-off and reduce eutrophication. In addition, aquatic vegetation is a highly versatile feedstock. Algae and seaweed thrive in challenging and varied conditions and can be transformed into products ranging from fuel, feeds, fertiliser, and chemicals, to third-generation sugar and biomass. These benefits are the basis for seaweed and algae emerging as one of the most important bioeconomy trends in the Nordic Arctic and Baltic Sea region. The production of algae for food and industrial uses has hence significant potential, particularly in terms of environmental impact, but it is still at an early stage. The production of algae (both micro- and macroalgae) can take numerous forms, as shown by this map. At least nine different production methods were identified in the region covered in this analysis. A total of 41 production sites were operating in Denmark, Estonia, the Faroe Islands, Iceland, Norway, Germany, and Sweden. Germany has by far the most sites for microalgae production, whereas Denmark and Norway have the most macroalgae sites.
- 2021 December
- Arctic
- Baltic Sea Region
- Nordic Region
- Others
Change in share of biofuels in transport from 2010 to 2018
This map shows change in share of biofuels in final energy consumption in transport in the Nordic Arctic and Baltic Sea Region from 2010 to 2018. Even though a target for greater use of biofuels has been EU policy since the Renewable Energy and Fuel Quality Directives of 2009, development has been slow. The darker shades of blue on the map represent higher increase, and the lighter shades of blue reflect lower increase. The lilac color represent decrease. The Baltic Sea represents a divide in the region, with countries to the north and west experiencing growth in the use of biofuels for transport in recent years. Sweden stands out (16 per cent growth), while the other Nordic countries has experienced more modest increase. In the southern and eastern parts of the region, the use of biofuels for transport has largely stagnated. Total biofuel consumption for transport has risen more than the figure indicates due to an increase in transport use over the period.
- 2021 December
- Arctic
- Baltic Sea Region
- Nordic Region
- Transport
Share of biofuels in transport in 2018
This map shows the share of biofuels in final energy consumption in transport in the Nordic Arctic and Baltic Sea Region in 2018. There has been considerable political support for biofuels and in the EU, this debate has been driven by the aim of reducing dependency on imported fuels. For instance, 10 per cent of transport fuel should be produced from renewable sources. The darker shades on the map represent higher proportions, and the lighter shades reflect lower proportions. As presented by the map, only Sweden (20.7%) had reached the 10 per cent target in the Nordic Arctic and Baltic Region in 2018. Both Finland (8.3%) and Norway (8.3%) were close by the target, while the other countries in the region were still lagging behind, particularly the Baltic countries.
- 2021 December
- Arctic
- Baltic Sea Region
- Nordic Region
- Transport
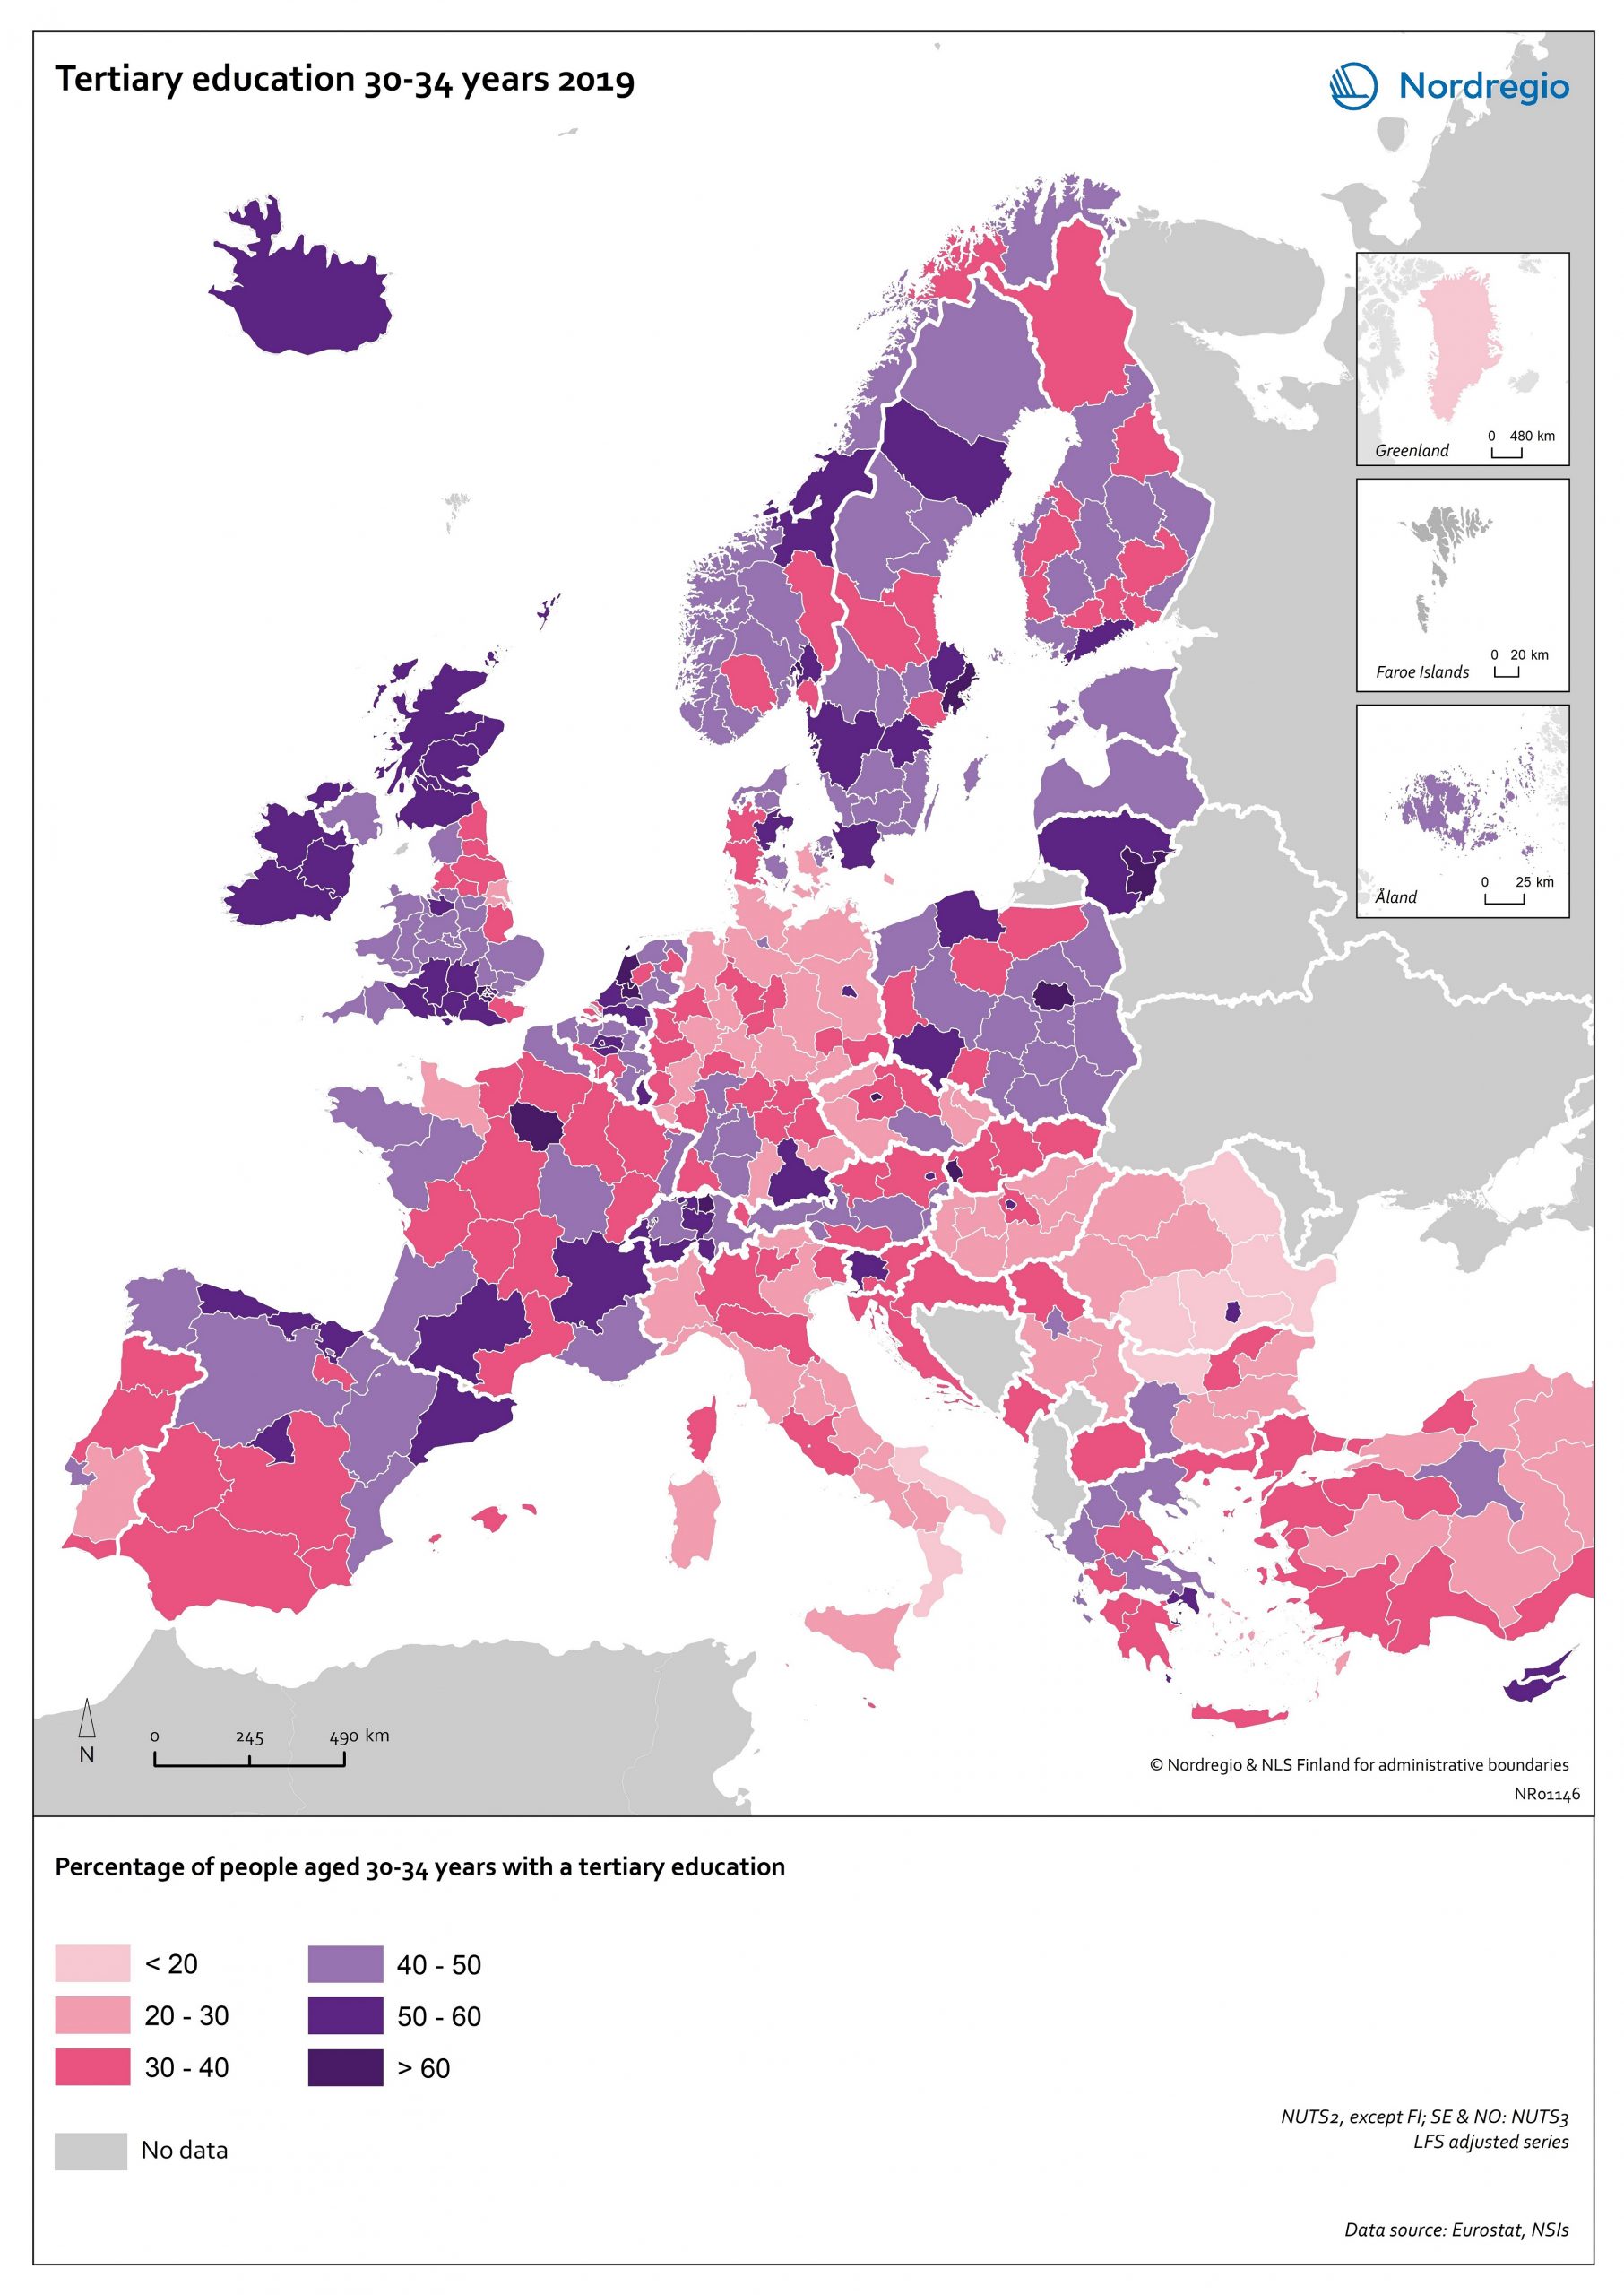
Tertiary education attainment level of 30- to 34-year-olds 2019
The map shows the proportion of the population aged 30-34 years old, who had a tertiary education at the European level in 2019. Purple shades indicate higher proportions, and pinkish shades reflect lower proportions. It is common to show the education attainment for the age group 30-34 since it is an age group where most people have finalised their studies. The focus on this age group makes it easier to see recent trends and outcomes of policies. Overall, over 40% of Europeans aged 30-34 years old had a tertiary education in 2019. Young people in the Nordic countries are among the most educated, with approximately half of 30 to 34-year-olds achieving a tertiary education across all Nordic countries. The highest proportions can be found in the capital regions. Stockholm is particularly noteworthy, with over 60% of 30 to 34-year-olds having had a tertiary education. Regions with prominent universities also stand out – for example, Skåne, Uppsala, Västerbotten and Västra Götaland (Sweden), Trøndelag (Norway) and Østjylland (Denmark).
- 2020 October
- Baltic Sea Region
- Demography
- Europe
- Nordic Region
- Others
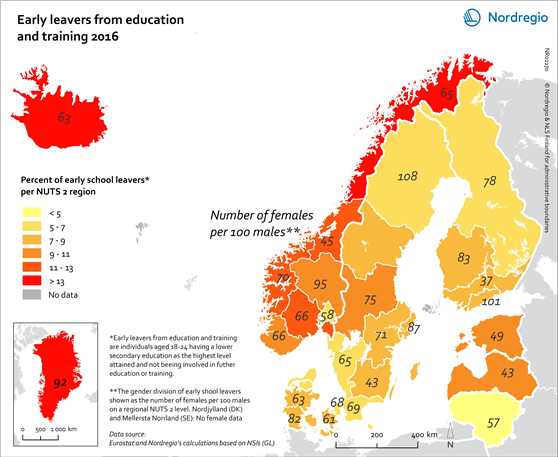
Early leavers from education and training 2016
This map shows the percent of early school leavers in the Nordic Region (NUTS 2 level) and Baltic states in 2016, calculated as the total number of individuals aged 18-24 having a lower secondary education as the highest level attained and not being involved in further education or training. The numbers in each region indicate the proportion of females per 100 males. The yellow/red shading indicates the percent of early school leavers in 2016. The lighter the colour the lower the percentage of early school leavers in 2016. The grey colour indicates no data. Early school leaving is of concern in the Nordic Region to varying degrees. From a pan-European perspective, the Danish (7.2%), Swedish (7.4%) and Finnish (7.9%) averages all fall below the EU average (10.7%) and are in line with the Europe 2020 target of below 10%. The Norwegian average (10.9%) remains slightly above the target but is comparable to the EU average. The average rate of early school leaving in Iceland (19.8%) is substantially higher than the other Nordic countries and the EU average. There is both a spatial and a gender dimension to this problem. The spatial dimension of early school leaving is highlighted in this map, which shows rates of early school leaving in the Nordic Region at the NUTS 2 level. The map highlights the comparatively high rates in Norway, particularly in the north. It is worth noting that, although still high in a Nordic comparative perspective, early school leaving rates have decreased in all Norwegian regions since 2012. Rates are also high in Greenland, with a staggering 57.5% of young people aged 18–24 years who are not currently studying and who have lower secondary as their highest level of educational attainment. The map also shows the gender dimension of early school leaving, with…
- 2018 February
- Baltic Sea Region
- Labour force
- Nordic Region
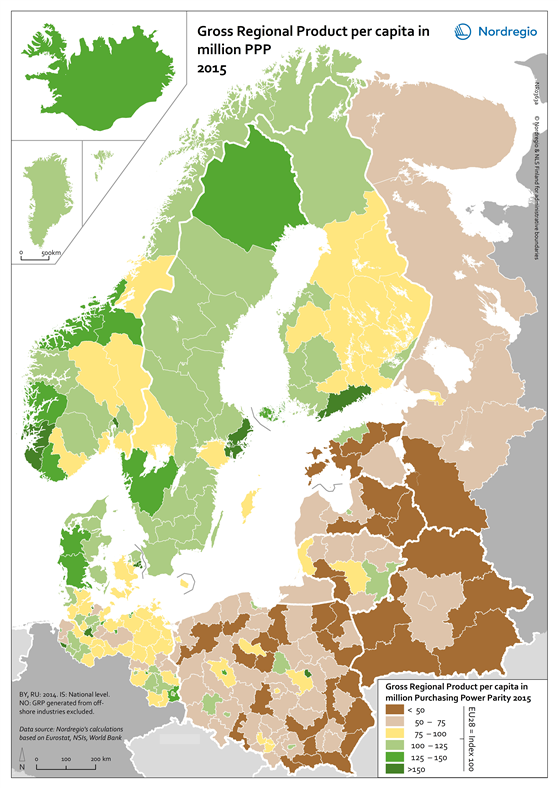
Gross Regional Product per capita in million PPP 2015
This map shows the gross regional product per capita in million purchasing power parity (PPP) in all Nordic and Baltic Regions in 2015. The green tones indicate regions with a gross regional product per capita above the EU28 average. The darker the tone the higher the gross regional product per capita. The brown/yellow shading indicates regions with a gross regional product per capita below the EU28 average. The darker the tone the lower the gross regional product per capita. In economic development terms, the Nordic Region continues to perform well in relation to the EU average. Urban and capital city regions still show high levels of GDP per capita reflecting the established pattern throughout Europe. Stockholm, Oslo, Helsinki, Copenhagen and the western Norwegian regions are among the wealthiest in Europe, again confirming that the capital regions and larger cities are the strongest economic centres in the Nordic Region. In addition to these urban regions, some others also display high levels of GRP per capita. What is interesting is that in the aftermath of the economic crisis some second-tier city regions, such as Västra Götaland with Gothenburg in Sweden, are now also displaying fast growth rates as indeed are some less metropolitan regions in the western part of Denmark. These regions display GRP per capita levels which correspond to, or even exceed, those of most metropolitan regions in Europe. most of the central and eastern parts of Finland remain below the EU average.
- 2018 February
- Baltic Sea Region
- Economy
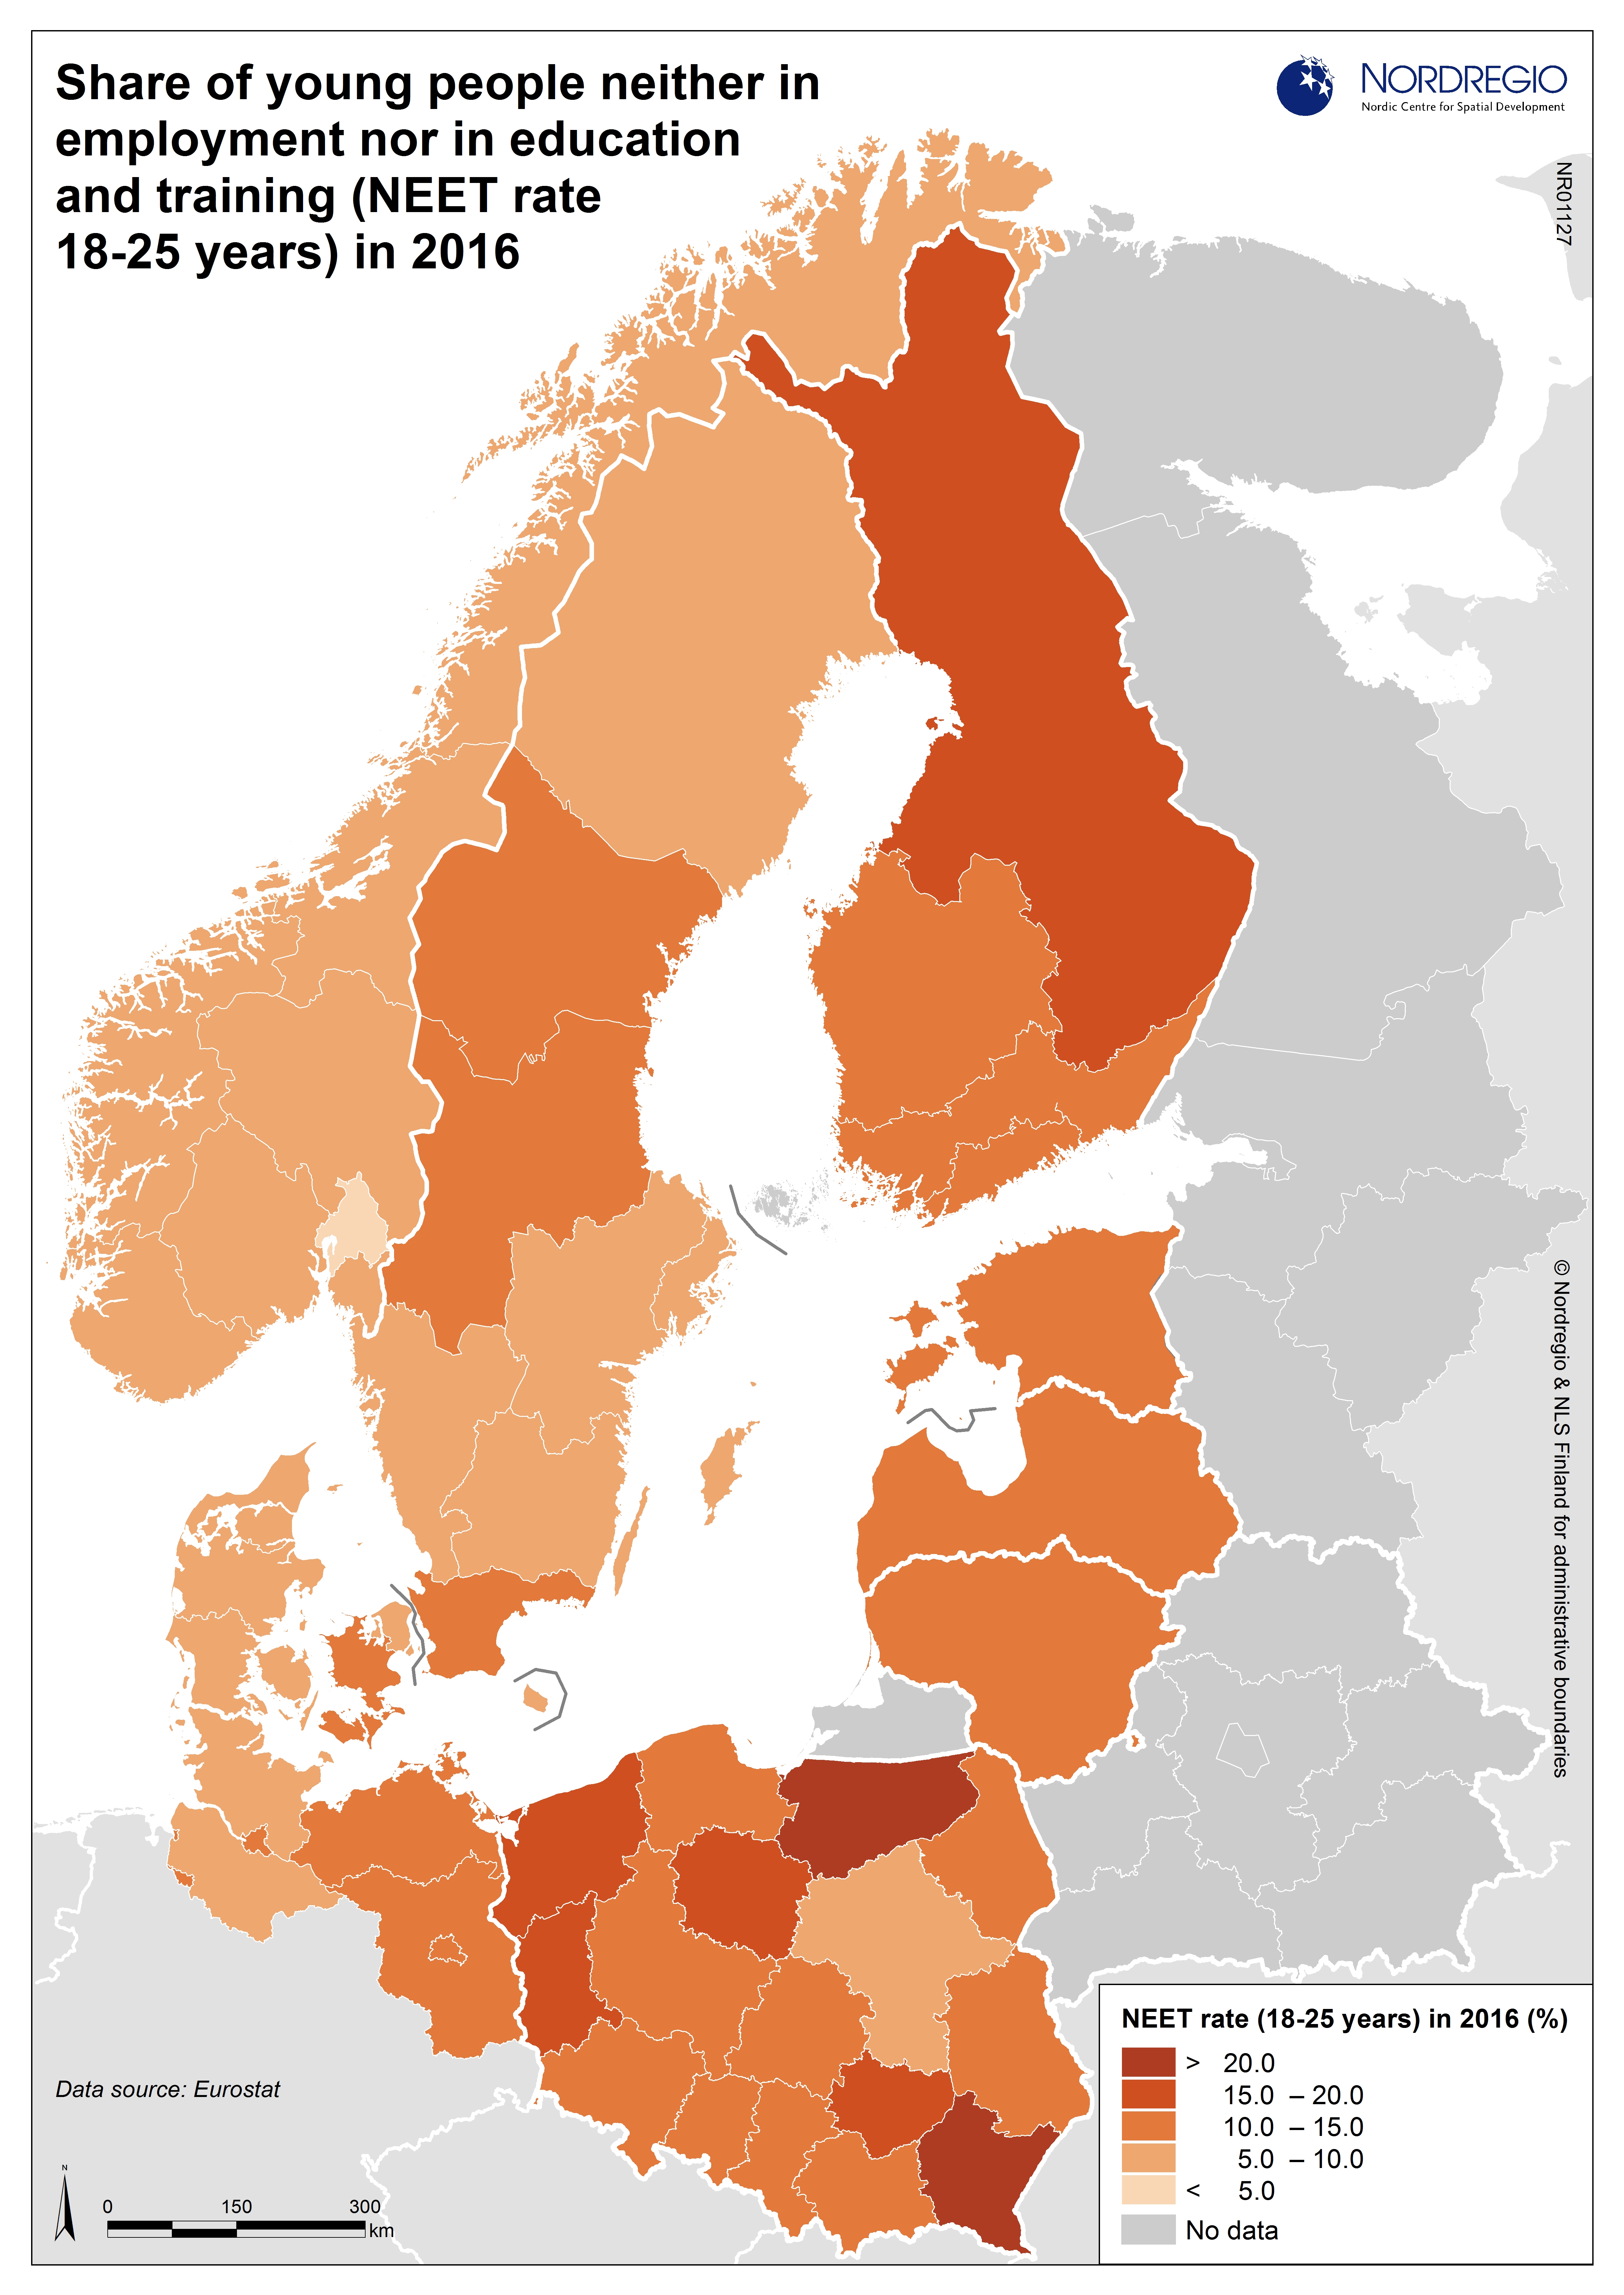
NEET rate for young people 18-25 years in 2016
Share of young people aged 18-25 years neither in employment nor in education and training in 2016 There are a range of reasons why a young person may become part of the “NEETs” group, including (but not limited to): complex personal or family related issues; young people’s greater vulnerability in the labour market during times of economic crisis; and the growing trend towards precarious forms of employment for young people. Successful reengagement of these young people with learning and/or the labour market is a key challenge for policy makers and is vital to reducing the risk of long-term unemployment and social exclusion later in life. The map highlights two Polish regions, Podkarpackie and Warminsko-Mazurskie, as having the highest NEET rates in the BSR. High rates can also be found in several other Polish regions as well as the Northern and Eastern Finland Region. The lowest NEET rates in the Baltic Sea Region can be found in the Norwegian Capital Region, followed by several regions in Sweden, Norway and Denmark.
- 2017 June
- Baltic Sea Region
- Labour force
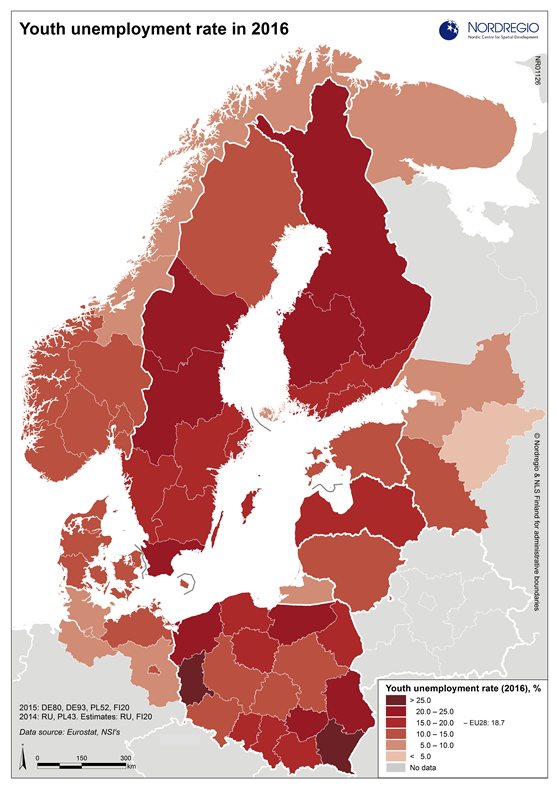
Youth unemployment rate in 2016
The map highlights two Polish regions, Podkarpackie and Lubuskie, as having the highest youth unemployment rates in the BSR. Several other regions in Poland, along with regions in Northern Finland, Central Sweden and the southernmost Swedish region of Skåne, have also been rather severely hit by youth unemployment. The lowest youth unemployment rates can be found in several Russian regions, among them St. Petersburg, and in regions in Northern Germany and Northern Norway.
- 2017 June
- Baltic Sea Region
- Labour force
- Nordic Region
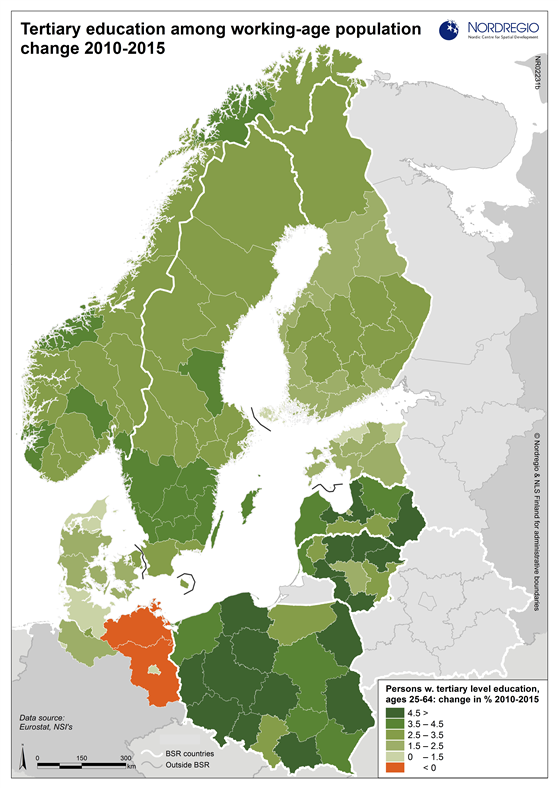
Tertiary education among working-age population, change 2010-2015
The Nordic countries, as well as Estonia and Lithuania, have had among the highest levels of tertiary education in Europe in recent years. This map demonstrates that many regions, particularly those in Poland, are catching up. Several Lithuanian and Latvian regions have also had high rates of positive change between 2010 and 2015. The most modest growth rates, between 0 and 1.5 percent change, were experienced in two Estonian regions, one in Denmark and one in Northern Germany. Mecklenburg-Vorpommern and Brandenburg, in North-Eastern Germany, were the only regions within the Baltic Sea Region to experience a decrease in the share of working-age persons with tertiary level education from 2010-2015.
- 2017 March
- Baltic Sea Region
- Labour force
- Nordic Region