The second parallel session was about planning tools for green and liveable city regions. A key question was about current planning and analytical tools that help to integrate environmental dimensions and well-being with efforts to improve economic competitiveness? And in turn, how these integrated understandings can support planning actions?
Christian Fertner from University of Copenhagen started by presenting about patterns of urban energy production and consumption, with a specific focus on planning issues, monitoring indicators and potential rebound effects in the urban domain. His research, which has been taking place within the PLEEC-project (read more: http://www.pleecproject.eu/) aims at developing a general policy model for supporting energy efficiency within city planning.
Fertner presented the key findings from the project. One of the core tasks has been to develop a list of spatial planning measures with aim of measuring how urban planning could contribute to lower energy use in our cities.
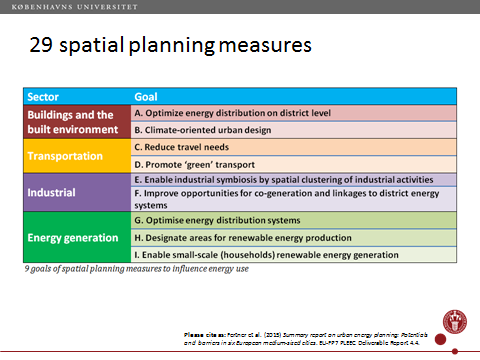
The indicator set of 29 measures has been developed and tested in close cooperation with six medium-sized cities (Eskilstuna, Turku, Jyvaskyla, Tartu, Stoke-On-Trent, Santiago de Compostela). The main result from the testing has shown the importance of local contexts and administrative conditions for using indicators. The results have identified challenges of working with indicators generally, as well as the importance of being aware about how rebound effects can counter against certain planning and policy initiatives. For instance, much of the discussion in the question period focussed on how people living in dense urban areas in Nordic capitals can often have a larger environmental footprint than rural residents because they have second homes, or travel internationally for recreation more often.
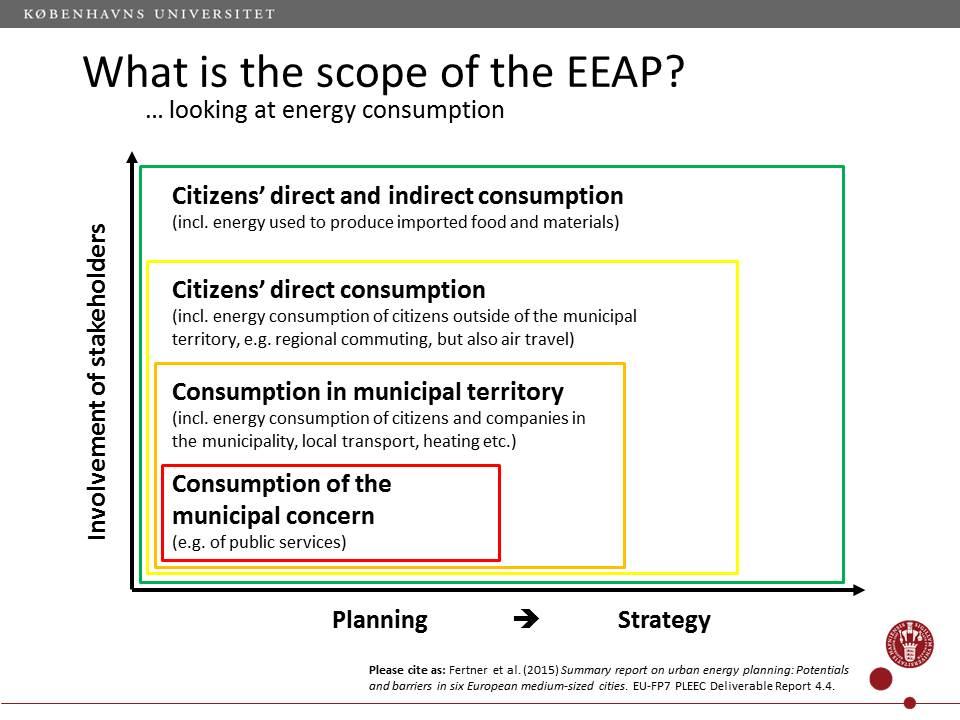
Christian’s key conclusions were that it is important to understand energy consumption from the municipal perspective, from the spatial perspective, to monitor and assess consumption patterns comprehensively and not least, to understand that energy consumption has an environmental impact regardless of whether it’s directly or indirectly consumed.
Sara Borgström from Stockholm Resilience Centre: “What do we know about integrating an ecosystem services perspective in urban development and what are the challenges?” The current sustainability problem consists of balancing the three pillars of sustainability: economic, social and environmental. The ecosystem approach could tap in to this problem by promoting the fact that nature serves such a variety of purposes, including in an urban systems perspective. However, while placing a price-tag or market value on nature services is very important, it can be tricky to measure environmental services in economic terms. ? We can utilize nature when creating sustainable cities and nature based solutions, and these benefits can be promoted even more once we have better and more widely known understandings about the benefit of the ecosystem services perspective.
What is a Good life index? Johanna Lundström from Region Syddanmark introduced us how to measure regional and local well-being by going beyond GDP and including quality of life measures to well-being. Region Syddanmark uses the Good Life Index created by the OECD as a means of understanding growth, competitiveness and attractiveness within their region. Good Life includes 42 indicators separated into three pillars: society municipality profile, individual perception of life and society citizen profile.
Lundström presented results of the Good Life Index from a Varde, which is a municipality among many in the region dealing with population decline. The indicators showed the perceived attractiveness of the area was very positive even if the municipal population has been declining, thus showing that well-being is multi-dimensional, and influences by factors that are often out of the control of local planners and policy makers.
Ryan Weber from Nordregio and Ilpo Tammi from the Council of Tampere Region introduced the audience to the factors behind an attractive and green urban form and to their key findings from NWG4 collaborative project with Region Syddanmark. The research project started off from an idea to find new approaches to map and visualise attractiveness using open source data. Key questions included:what makes cities attractive for their local residents and how can this be analysed. In response, their research has applied a new approach where they have mapped the accessibility to urban services that people tend to take advantage of on an everyday basis: services such as like public transportation, restaurants, grocery stores, schools, health care facilities, etc. The analysis was conductedin four different Nordic cities (Stockholm, Funen, Tampere, Trondheim), where nearly 20,000 service points were mapped and accessibility by all populated areas was analysed based on an average 20 minute walking distance. The analysis shows for example that the tool could be used for identifying service diversity hot spots as well as distinguishing areas with service gaps or potential for population development (e.g. infill). Furthermore, the project illustrated the vast differences in the availability and openness of data in the Nordic countries and that there is need for Nordic cooperation on common spatial data infrastructure, specifically on open data.
