Increasing temperatures in the Arctic cause permafrost thaw which will have severe consequences for the inhabitants of the Arctic Region. Sixty per cent of the settlements and more than two-thirds of the population are located on permafrost. Thawing may affect houses, roads, harbours and infrastructure and the local economy. In some cases, it may even lead to the relocation of entire coastal communities. The new Atlas of Population, Society and Economy in the Arctic provides an in-depth overview of the changes that are affecting populations in the circumpolar North.
– It is essential to keep in mind how this can affect the indigenous communities. There are more than 40 different ethnic groups who represent a significant share of the Arctic population, especially in the Canadian Arctic and Greenland where 75% or more are indigenous, says Timothy Heleniak, Senior Research Fellow at Nordregio.
As part of the EU-funded Nunataryuk project, the atlas presents a collection of standardised indicators which illustrate the state of the Arctic regions. The focus is on demography, society, economy, production, accessibility and infrastructure as well as physical conditions and resources.
Society and economy in the Arctic
Employment in public sector in 2017
This map shows the distribution of employment in public sectors in the Arctic at regional level in 2017. The darker the colour (orange for public sector and blue for private sector), the higher the share. The average employment rate in the public sector was 32% whereas it was 68% in the private sector. The public sector employment dominates in many regions of the Arctic, where States and regional authorities are involved in most regulation and planning activities.
Find out more about this map here.
Unemployment rate in the Arctic
The map shows unemployed persons as share of the labour force (aged 15 years old and over) in the Arctic regions in 2016. The dark orange tones show regions with high unemployment rates and correspondingly light orange tones show regions with low unemployment rate.
Find out more about the map here.
Gross Regional Product in the Arctic
The map shows the Gross Regional Product (GRP) per capita in purchasing power parity (PPP) in the Arctic regions in 2016. The Gross Domestic Product (GDP) measures the overall economic output of all economic activities in a country (measure in terms of purchasing power parity, or standards). The corresponding indicator at the regional level is the Gross Regional Product (GRP). Although these measures are somewhat blunt (for instance they do not consider sustainability) in the assessment of regional performance they are still the most stable and most commonly harmonised measure for economic comparisons.
Find out more about the map here.
Gross Value Added in the Arctic
The Gross Value Added (GVA) at the regional level in the Arctic in 2016 is represented by two means in this map, which are the total GVA per capita in PPP and the GVA by branch of economic activity. The Gross Value Added (GVA) is the measure of the value of goods and services produced in an area, industry, or sector of an economy. The GVA at basic prices is the economic output valued at basic prices minus intermediate consumption valued at purchaser’s prices. The GVA is linked to the GDP, as both are measures of economic output. The GVA is sector specific, and the GDP is the sum of the GVA from all sectors of economy (including taxes and excluding subsidies).
Find out more about the map here.
Cluster analysis of employment in 2016
The employment structure differs in the Arctic in terms of specific branch of economic activity. The map shows how the employment structure of the regions in relation to the Arctic average. The method applied is cluster analysis in the software Philcarto. We calculated the share of employment in each economic branch at the regional level, as well as the Arctic average. We then compared the regional values with the Arctic average. This method allows identifying regions with an over-representation of employment in each economic branch.
Find out more about the map here.
Tertiary educational attainment level in the Arctic
The map shows the percent of individuals aged 25-64 with tertiary education as the highest attainment level in the Arctic regions in 2017. Tertiary education corresponds to International Standard Classification of Education (ISCED) 2011 levels 5-8, which represent bachelor or equivalent and all higher attainment levels. The dark green tones show regions where more than 30% of individuals attained tertiary education as highest level. The light green tones show regions where less than 15% of individuals attained tertiary education as highest level.
Find out more about the map here.
Higher educational institutions in the Arctic
The map shows universities and other educational institutions on post-secondary and tertiary level located in the Arctic. The red circles indicate a location of a university, college, or campus areas within the Arctic. The size of the circle corresponds to the number of educational institutions in a specific location.
Find out more about the map here.
Housing by type of dwelling in the Arctic
The map shows the housing condition in the Arctic regions in 2016. The pie charts represent the share of own and rented dwellings. Green indicates the share of privately-owned dwellings and blue indicates the share of publicly-owned dwellings.
Find out more about this map here.
-During fieldwork for the Nunataryuk project, we saw that in a small Greenlandic town in Disko Bay, some fishermen started using a drone for navigating around the thickest ice-flakes. Using drones saved them fuel for the boat and helped them navigate easier. They also got stunning photos which they shared on Facebook – and other fishers became aware of the benefits, and suddenly it became the new way of navigating the area, explains Research Fellow Leneisja Jungsberg, Nordregio.
Thawing affects the infrastructure and industry
Much of the Arctic is still underlain by permafrost, but it is melting faster than expected, with significant negative consequences according to a recently-released Special Report on the Ocean and Cryosphere in a Changing Climate from the IPCC. Permafrost thaw can harm rural and coastal settlements due to their small populations and limited means of commuting. The accessibility of many Arctic settlements depends on existing land, sea and aviation infrastructure. Permafrost thaw causes several construction challenges and may have a detrimental impact on many of these modes of transport. But it will also open up new possibilities to reach natural resources through land and sea. Mining sites are constantly moving farther north due to technical innovation, permafrost thaw and declining sea-ice. On the other hand, access to natural resources is highly dependent on technical capacities and environmental challenges. The high economic costs of exploitation and transportation, as well as high demand for environmental protection, are decisive factors in the exploitation of Arctic resources.
Accessibility and infrastructure in the Arctic
Road accessibility of Arctic settlements
The accessibility of Arctic settlements by road is illustrated in this map showing the road network in the Arctic. The distribution of permafrost is displayed as a background layer indicating physical condition underneath the road infrastructure. The road infrastructure is considerably less dense on continuous permafrost-covered land. There are road connections in the Arctic that are only open for transport during winter time, but they are not distinguished in the map.
Read more about the map here.
Broadband access in 2015
This map shows the percentage of households with broadband access at the regional level in the Arctic in 2015. Dark purple tones indicate regions with high share of households with broadband access and light purple tones indicate regions with low share of households with access to broadband. The grey colour indicates regions with no data.
Read more about the map here.
Sea Routes and Ports in the Arctic
The main and secondary zones for maritime traffic are based on 2017 vessel traffic data gathered on Automatic Identification System (AIS) by Marine Traffic (blue colours on map). The data shows the locations of vessels during their travels. The main transport areas are in Northern Europe – from Iceland to the Kara Sea through the Norwegian coast – and along the coast of Alaska (USA).
Cargo ships as well as government vessels, including icebreakers, account for the largest share of the traffic in the Arctic. The number of tourism-related shipping activity and private yachts is increasing.
Read more about the map here.
Airports in the Arctic 2019
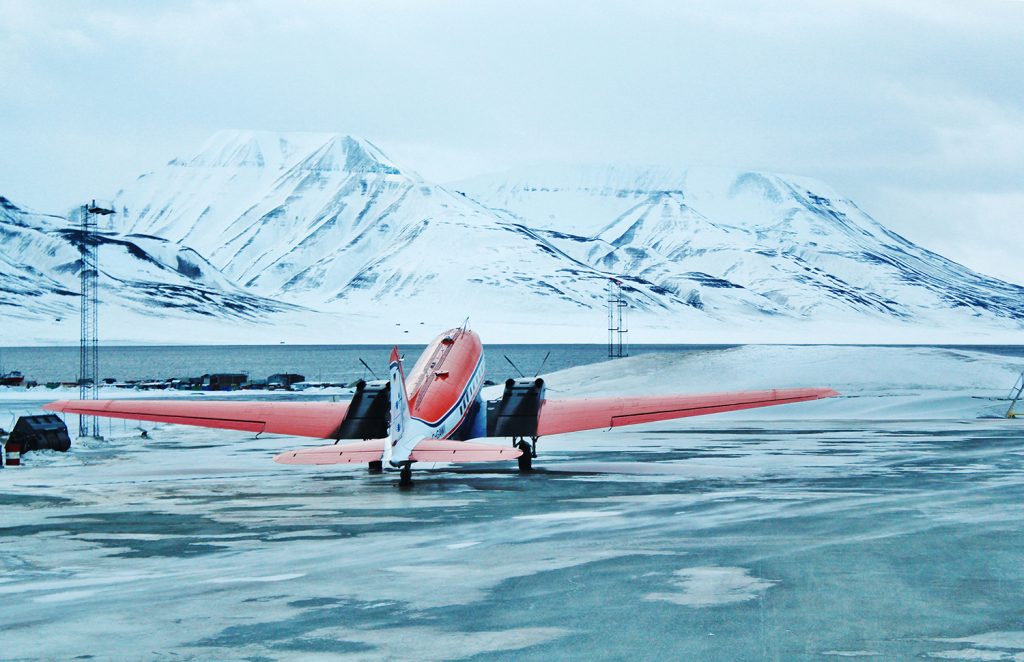
Long distances in combination to the lack of road and railroad connections and seasonal accessibility of water transport makes airports an important element of local accessibility in the Arctic. There are only a few large airports in the Arctic with regular air connections to national capitals or other main cities more south – or abroad – however, there is a large number of small airports.
Read more about the map here.
Nordregio will join the Arctic Circle Assembly 10-12 October to discuss the ways to enhance scientific knowledge in the Arctic. Read more: https://nordregio.org/events/arctic-circle-assembly-2019/