This map shows the population size in number of inhabitants in 2016, and the population change between 2011 and 2016 in the Nordic urban settlements of at least 2,000 inhabitants in 2016.
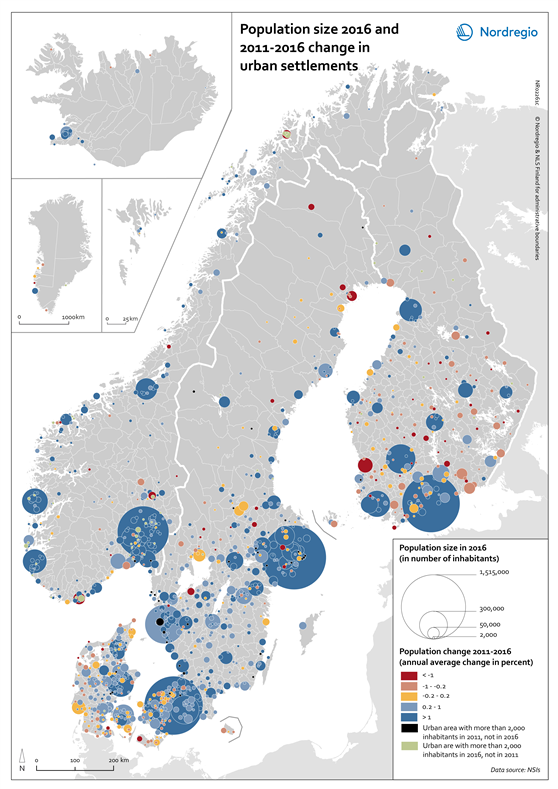
The circles indicate the population size in 2016, with large circles representing high number of inhabitants in urban settlements; small circles representing low number of inhabitants in urban settlements. The blue tones indicate increasing population, the red tones indicate decreasing population, and the yellow colour indicate stable population growth between 2011 and 2016. The black colour indicates urban areas that had more than 2,000 inhabitants in 2011 but not anymore in 2016. On the contrary the green colour indicates urban areas that had less than 2,000 inhabitants in 2011 and more in 2016.
Populations in urban settlements with more than 2,000 inhabitants have grown by 7.5%, while that in the functional urban areas have grown by more than 6%. Population growth is unequally distributed within and between the various Nordic countries. In Sweden and Norway, the population in urban settlements has grown by around 10% while the change in Denmark, Iceland and Finland has been about 5% during the period in question. In Sweden, functional urban areas have, however, grown less in relation to the other countries and to urban settlements with 2,000 inhabitants. Norway has seen 9% population growth in both urban settlements and in the six largest functional areas.