This map shows the disposable income Gini index at the municipal level in 2017.
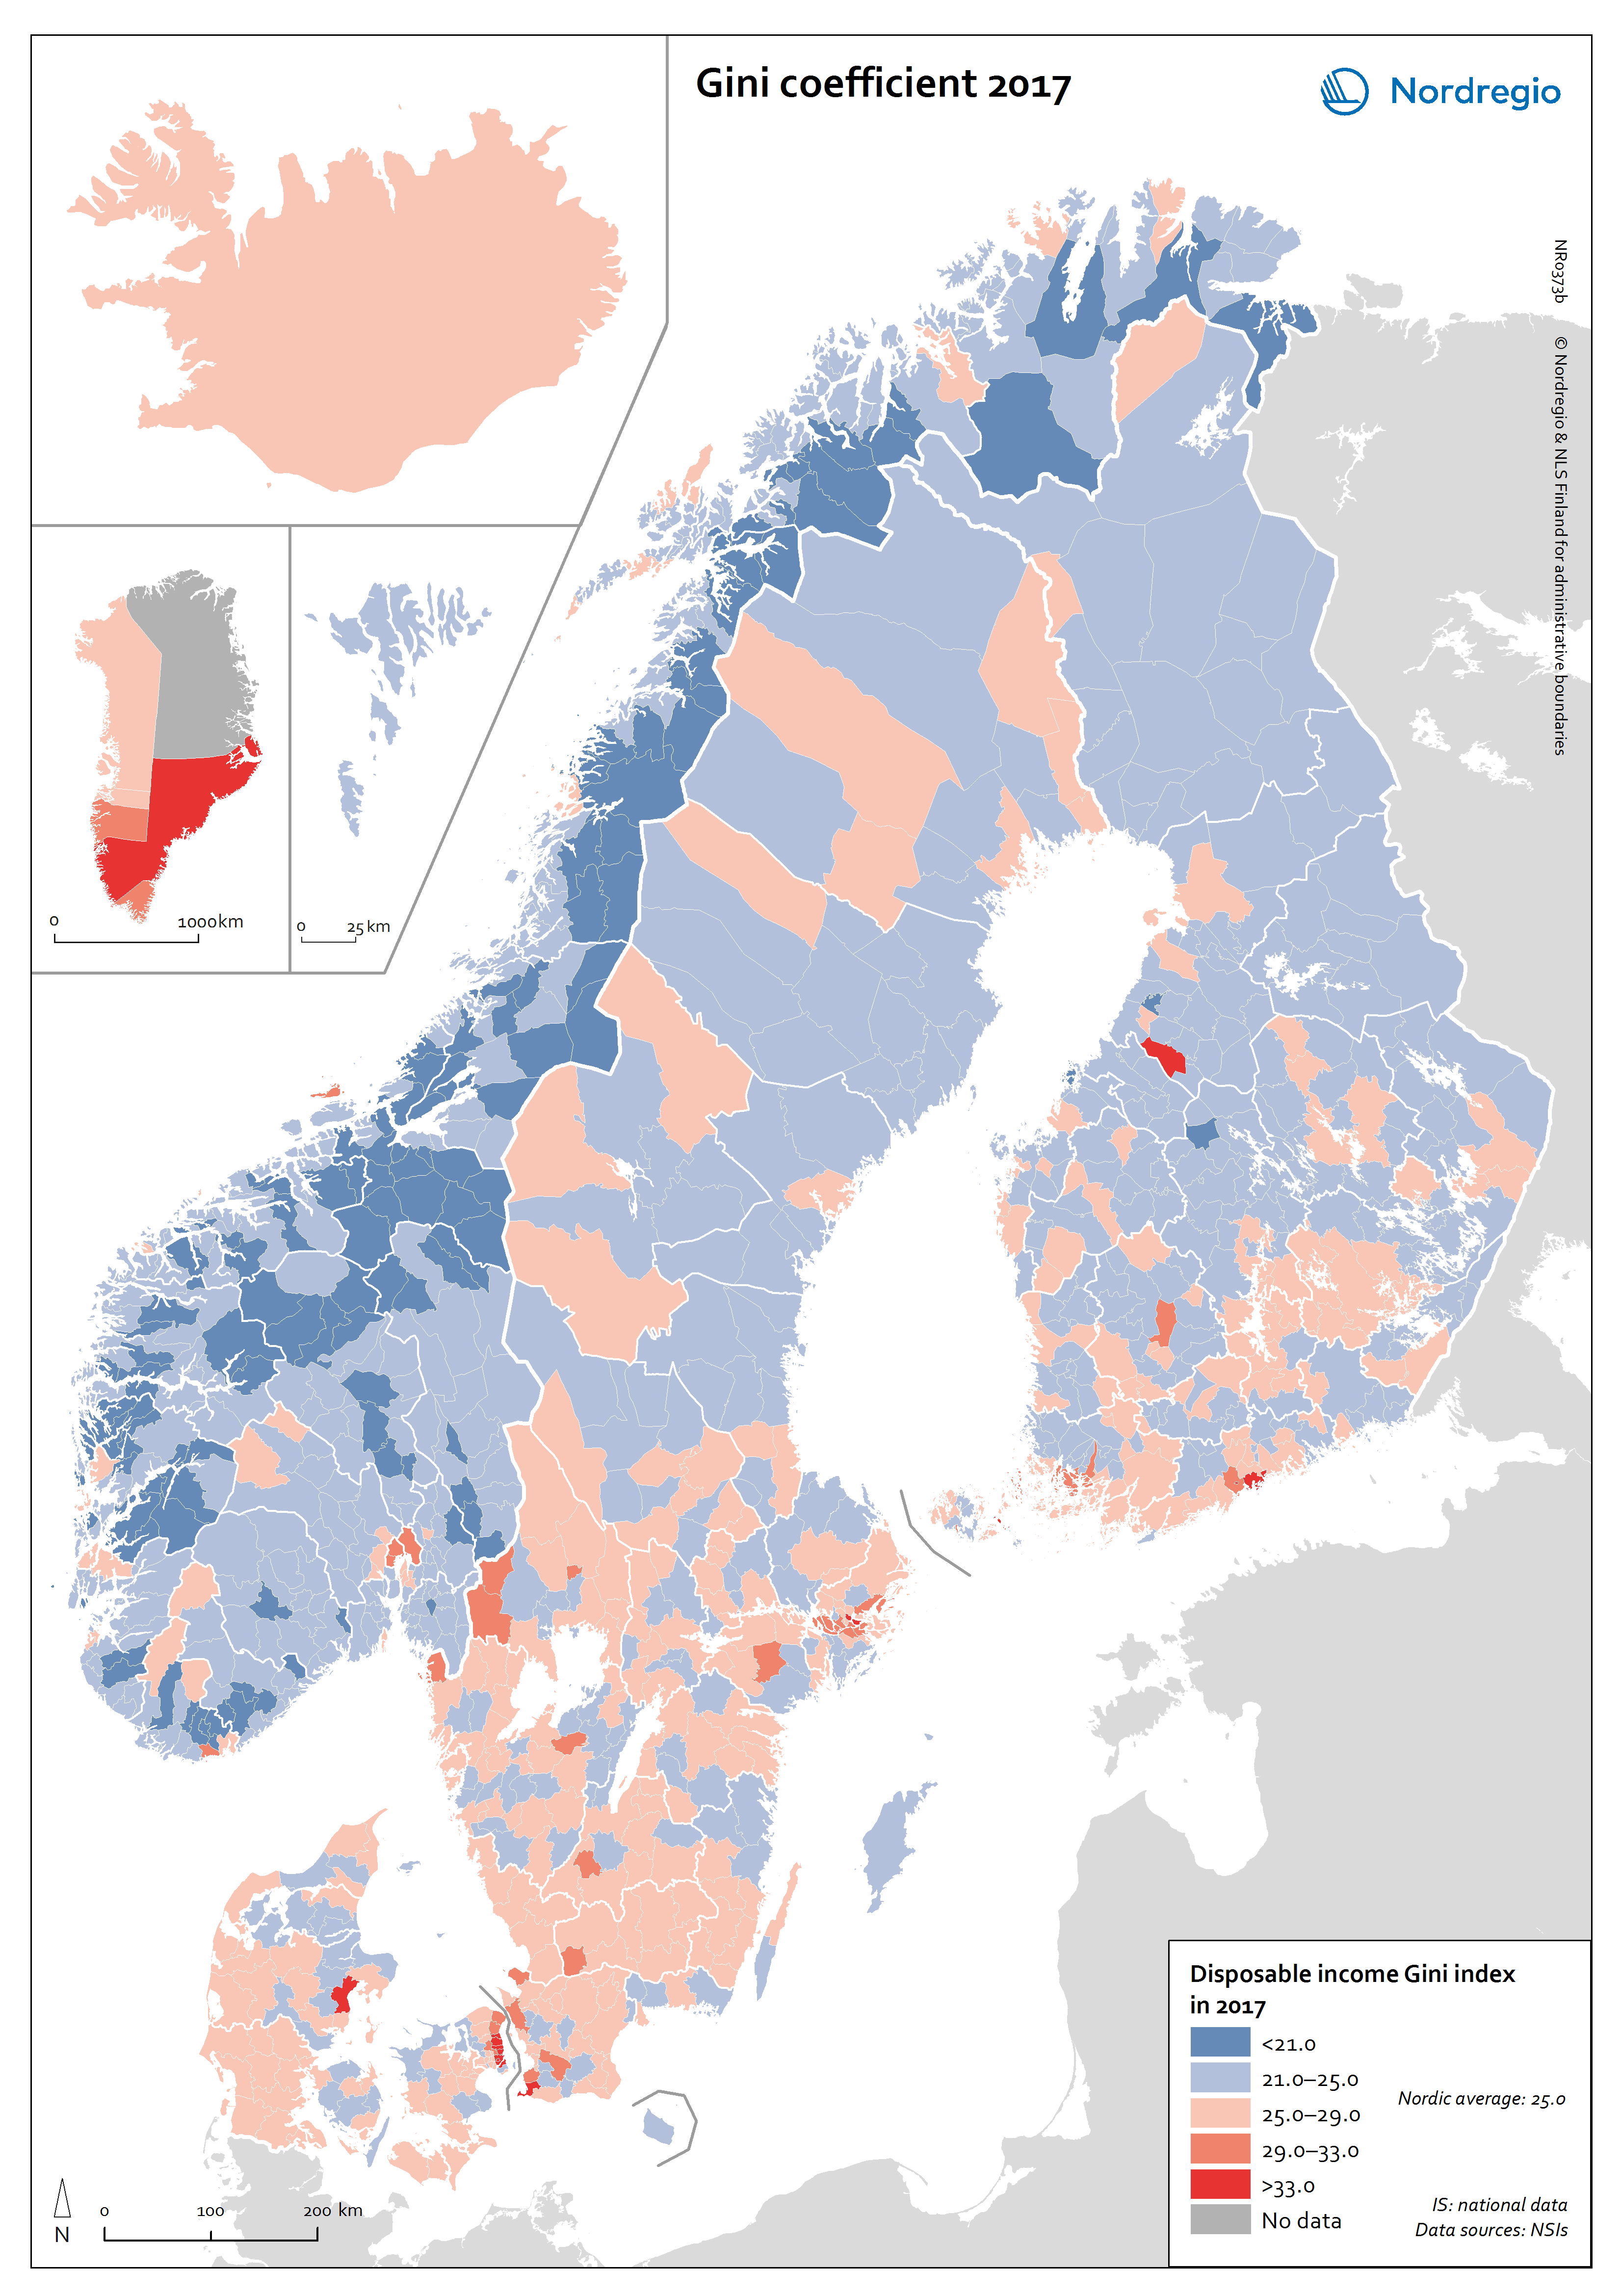
The blue colours indicate value of Gini coefficient below the Nordic average and the red colours indicates value of Gini coefficient above the Nordic average.
The map reveals that inequalities are largest in Sweden and Greenland, whereas they are more contained in Norway and the Faroe Islands. Denmark, Finland and Åland are somewhere in-between. The absence of data for municipalities in Iceland makes comparison with the rest of the Nordic Region impossible.
The highest intra-municipal inequalities were found in the capital city regions of Denmark, Finland and Sweden in 2017. Specifically, Danderyd (49.0), located in the Stockholm Region, and Gentofte (45.4), in the capital region of Denmark, were the Nordic municipalities with the largest intra-municipal household income inequality in 2017. It is in Norway that municipalities have the lowest intra-municipal income inequality, with values below 20. The low level of inequality is due to the relatively small number of households with very low income and households with very high disposable income.
Read the digital publication here.