These maps provide a comparative overview of the eco-innovation performance on the Eco-Innovation Index of the states of the European Union (EU) in 2010 (upper map) and in 2016 (lower map). Eco-innovation is currently at the core of EU policies as it is believed to be a key driver in the transition to a green economy, growth generation and new job creation in the years to come.
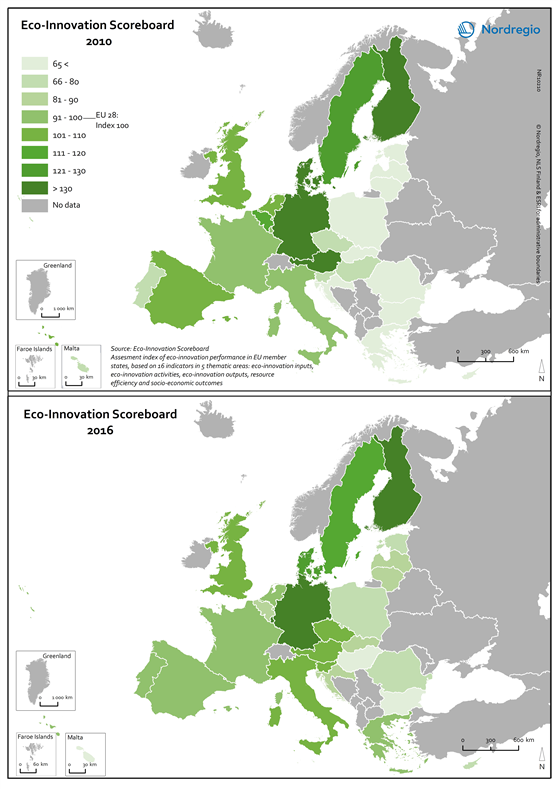
The eco-innovation scoreboard is an index of eco-innovation performance in the EU-member states, based on 16 indicators in 5 thematic areas. It promotes a holistic view of economic, environmental and social performance and complement other measurement approaches in terms of assessing the innovativeness of the EU countries. The green tones indicate differences in eco-innovation performance in the EU-member states in 2010 and 2016. The darker the green, the more performant the state in eco-innovation. The grey colour indicates no data.
The high scores of the three Nordic countries, along with Germany and Austria, can partly be explained by the fact that the Eco-Innovation Scoreboard is measured in relation to EU averages. The eco-innovation landscape has remained stable across the Nordic countries during the period 2010–2016, with no significant change in performance. Finland, Denmark and Sweden remain among the top-performing countries. In 2016, Finland scored highest in terms of the overall eco-innovation performance of all the Nordic countries, followed by Denmark and Sweden. In 2010, Denmark was the best Nordic performer on the eco-innovation index, closely followed by Finland and Sweden. Placing the Nordic countries in a European context, we see that other European countries are catching up but with different intensities. Lithuania and Latvia have significantly improved their positioning on the eco-innovation index in 2016 as have Slovakia, Greece and Portugal compared to their scores in 2010. In contrast, Austria, Belgium and the Netherlands have seen their performance on the index decline as compared to 2010.