The map shows the net migration as a share of the total population at sub-regional level in the Arctic between 2013 and 2017.
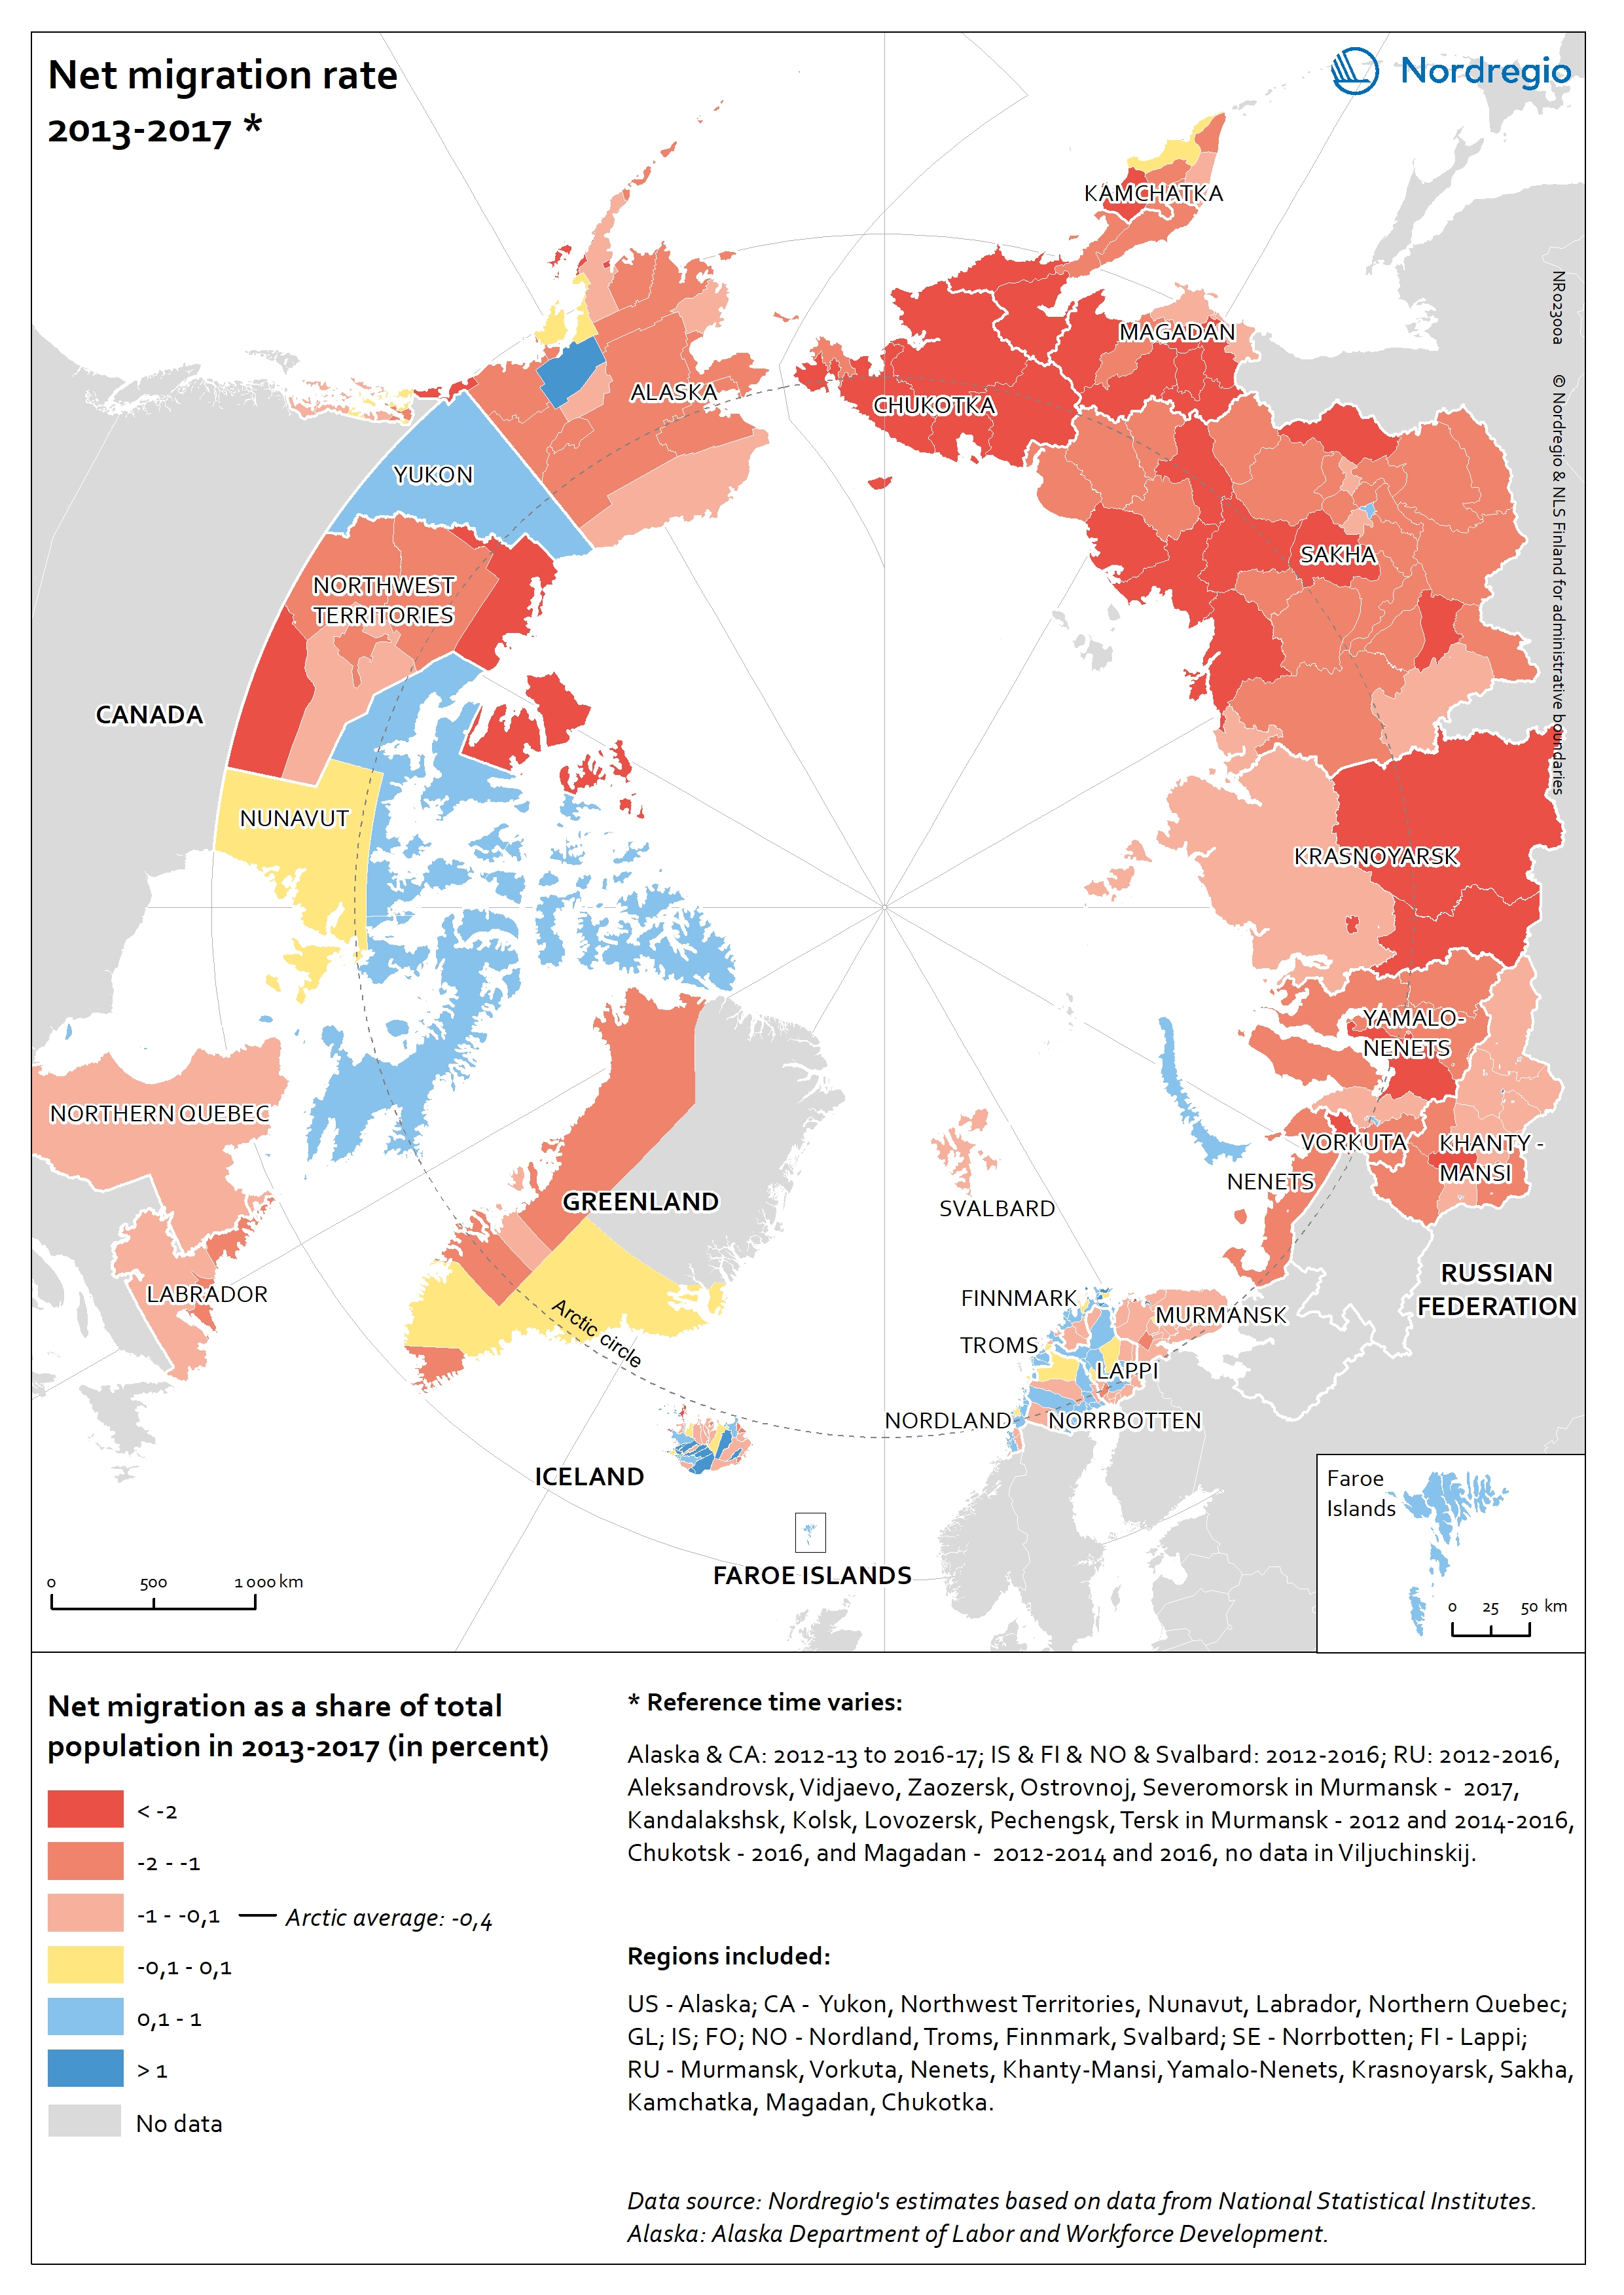
The blue tones indicate subregions with positive net migration, and the red tones indicate subregions with negative net migration. The yellow colour indicates stable net migration.
The Arctic had an annual average net migration rate of -0,4% during the period 2013-2017. The differences between Arctic subregions are significant. The out-migration played a predominant role in in Alaska (USA), the Northwest Territories, Northern Quebec and Labrador (Canada), Greenland, and the Russian Arctic. On the contrary, in-migration became the major source of population increase in the Nordic Arctic subregions. The Yukon and Nunavut (Canada) witnessed positive net migration rates. Across the Arctic, in-migration prevailed in subregions with lager urban centres, while sparsely-populated areas in which consist the majority of the Arctic region were losing their population.