This map shows the forest felling at the regional level in the Nordic Region (average 2013-2015). The chart shows the forest felling by category in 1,000 m3 at the national level in the Nordic Region in 2015.
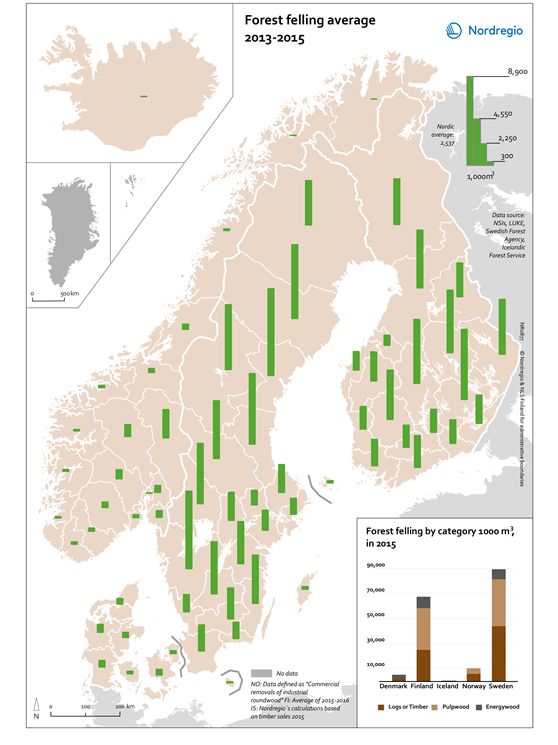
On the map, the green bars indicate the average 2013-2015 forest felling. The higher the bar, the greater the forest felling in the region. The grey colour indicates regions with no data. The chart shows different forest felling categories in 1,000 m3 in 2015. The dark brown represents logs or timber, the light brown represents pulpwood, and the dark grey the energywood.
The Nordic Region has a large potential for forest multi-use. Sweden and Finland have the largest forest felling in 1,000 m3, with the greatest use in logs and timber. Wood bi-products is extensively used for energy purposes and the forests display a large potential for increasing the production of renewable energy as well as other bio-based products.