This map shows the change in youth unemployment rate (15-24 years) between 2009 and 2016 in the European continent.
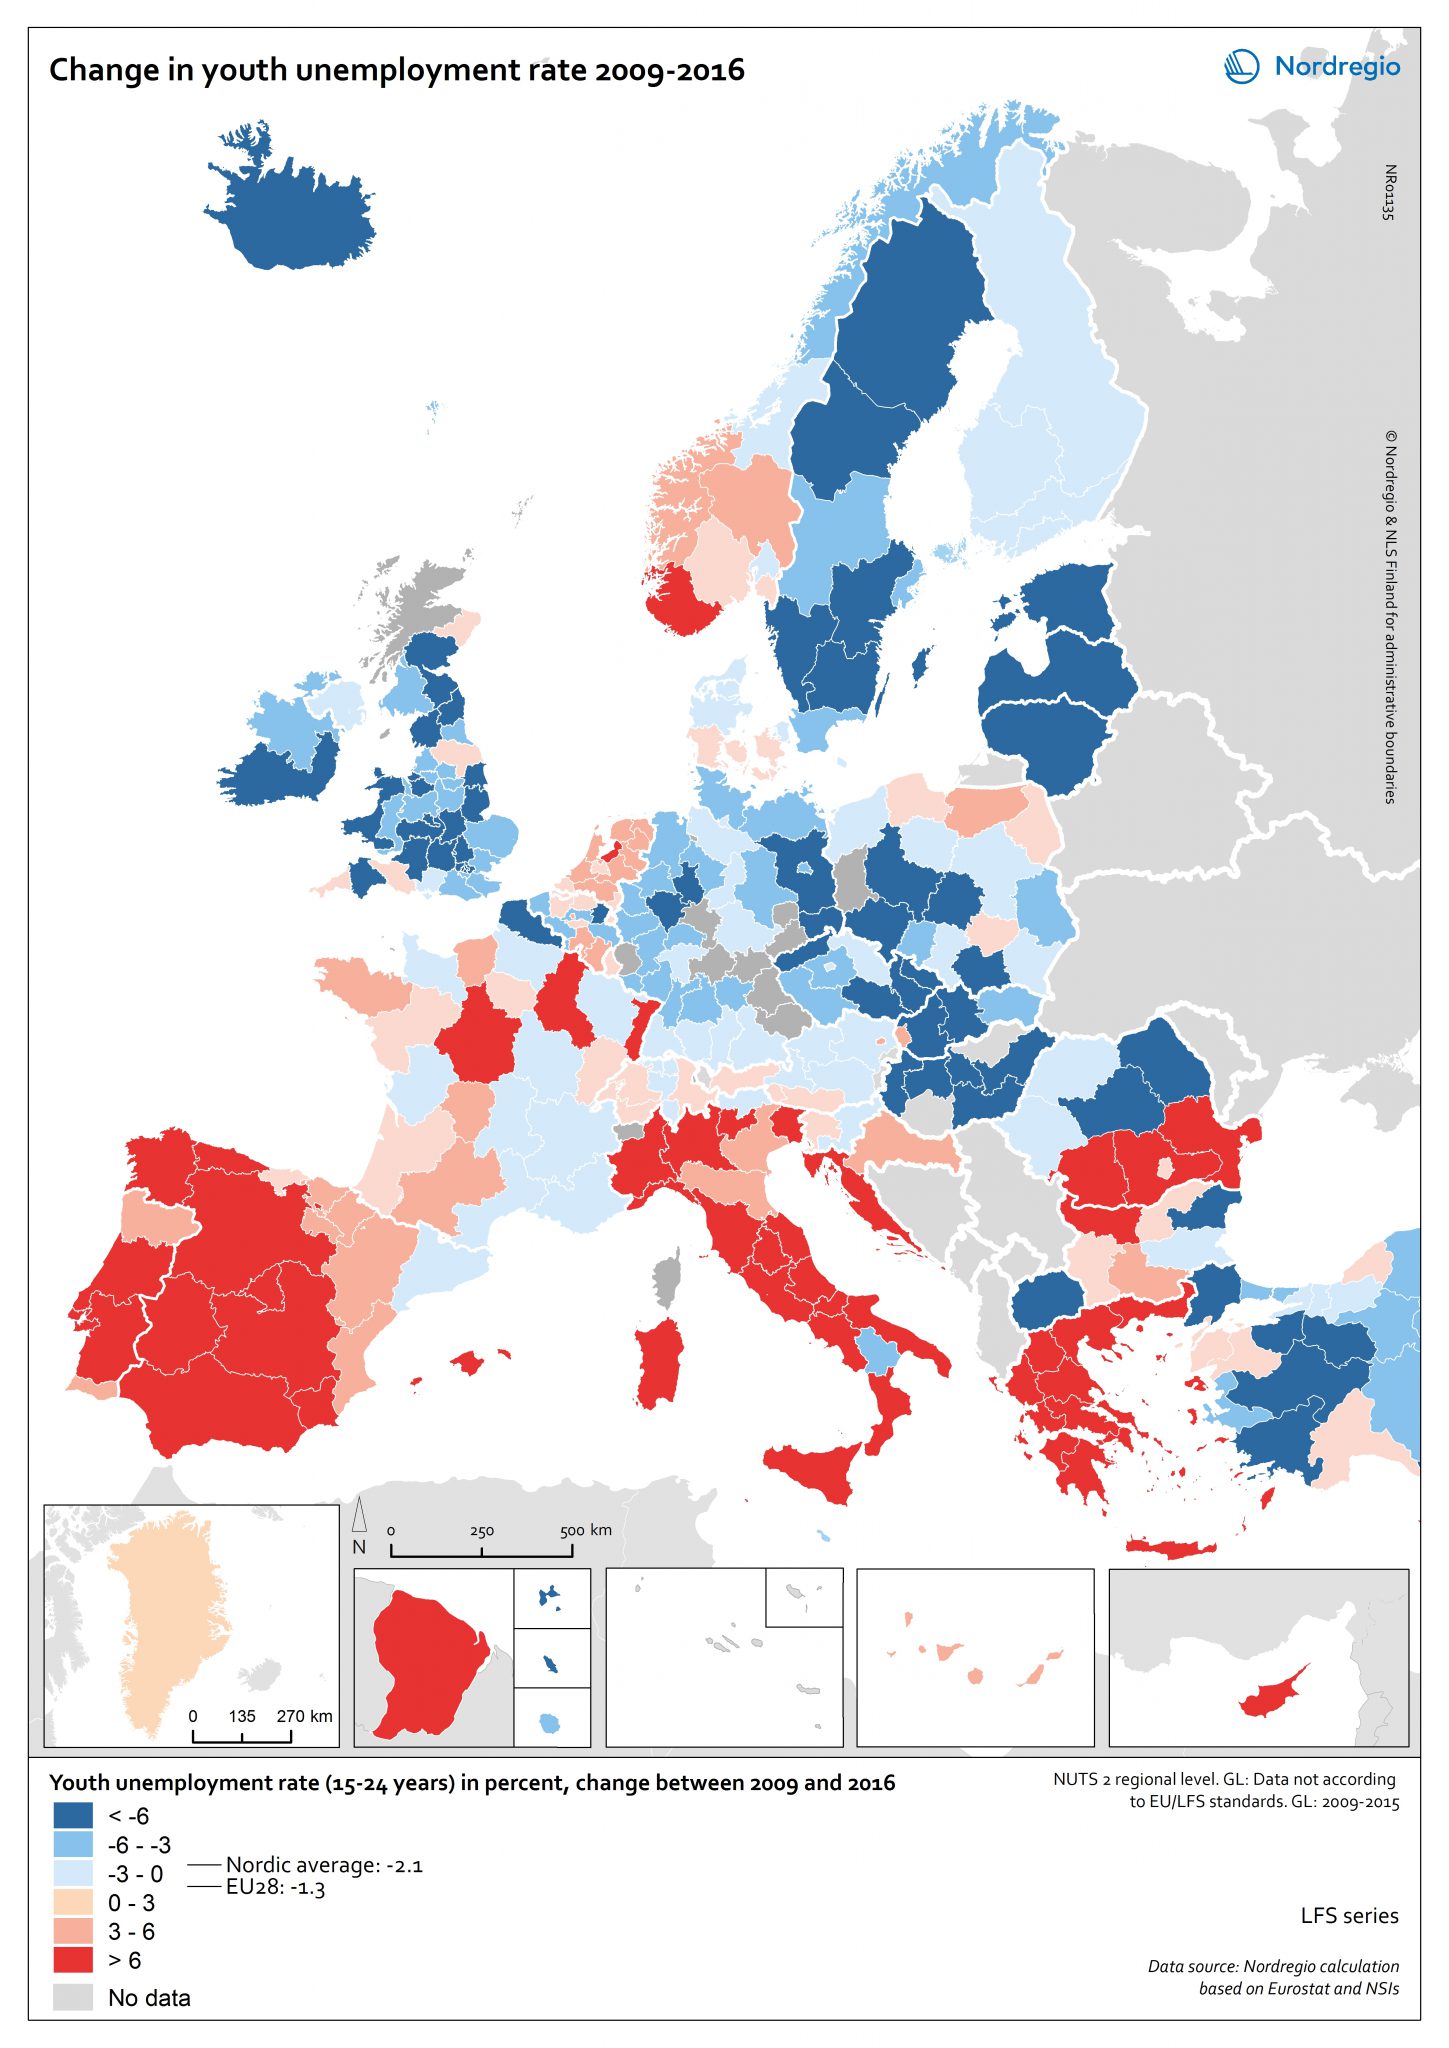
The red tones indicate regions with positive change in the youth unemployment rates between 2009 and 2016. The blue tones indicate regions with negative change in the youth unemployment rates between 2009 and 2016. The darker the colour, the highest/lowest change in the youth unemployment rate. The grey colour indicates regions with no data available.
Young people are more likely to experience labour market disadvantage due to their relative lack of experience. In many European countries, recovery from the 2008 crisis is an ongoing process that continues to have a serious impact on young people’s participation in economic and social life. In a European comparative perspective, the Nordic countries have bounced back fairly well overall, though some variation between the countries is evident. In Sweden, Iceland and Finland, all regions have experienced at least some decrease in the youth unemployment rate, with the most substantial drops observed in Sweden. In some regions in Norway and Denmark however, the youth unemployment rate was higher in 2016 than in 2009. It is important to consider the recovery evident in the context of the current youth unemployment rate.