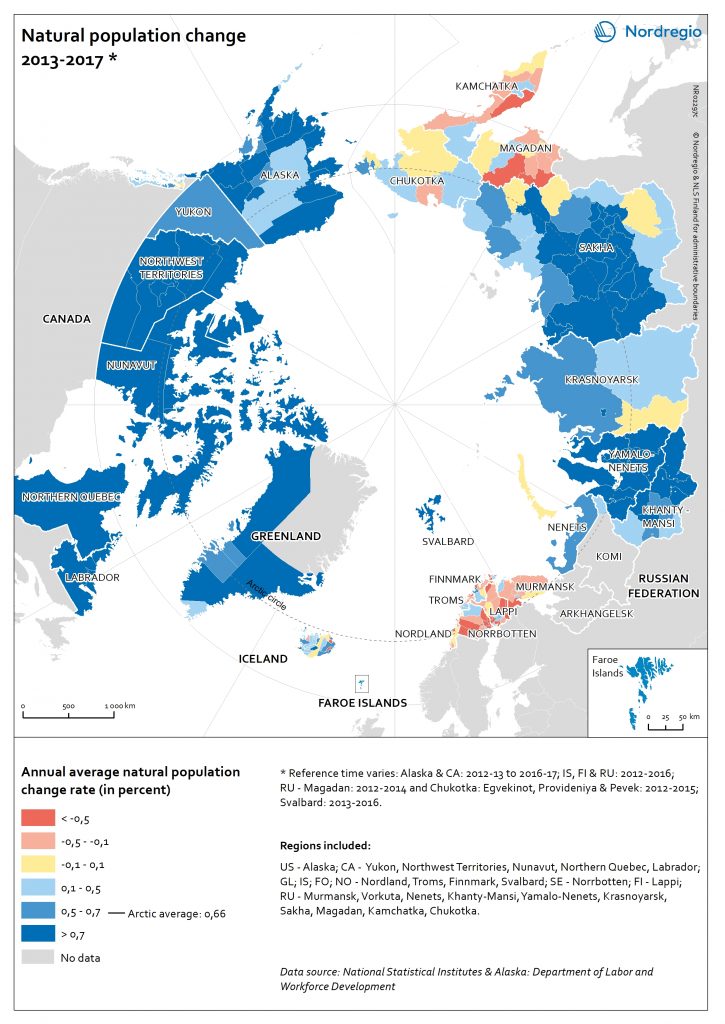
The map shows the annual natural population change rates in the Arctic subregions between 2013 and 2017.
The blue tones indicate a positive change: subregions where the number of live births exceeds the number of deaths. The yellow colour indicates no or little change: subregions where the difference between births and deaths are close to zero. The red tones indicate negative change: subregions where the number of deaths exceed the number of live births.
In the Artic the annual average natural population change rate was 0,66% between 2013 and 2017. The natural population change was positive especially in the Canadian Arctic, Alaska (USA), Greenland as well as in Yamalo-Nenets, Khanty-Mansi and in Sakha regions (Russian Federation). Natural population decline was the strongest in the Nordic Arctic, as well as in Murmansk, Magadan, and Kamchatka (Russian Federation).