During the last two decades, the Nordic Region has experienced significant regional- and local-level demographic changes due to international and domestic migration. Nordregio analyses of the major trends and challenges resulting from these phenomena are illustrated with a map showing 20 years of change.
The Nordic Region population increased by three million inhabitants between 1997 and 2007, from 24 million to nearly 27 million. The map shows indexed population change between 1997 and 2017 in municipalities (main map) and regions (map inset, lower-right corner). Observed unbalanced population change is of particular interest in the context of regional and municipal development. The different rates of population change between urban and rural areas present a challenge to maintaining services and quality of life in both growing and declining regions.
With an index of 100 during 1997 (i.e. using this year as reference), the Nordic region population reached an index value of 112 in 2017. In comparison, the 2017 index value for the European Union was 106, highlighting the relatively significant Nordic region demographic growth within the European context. However, this demographic trend is not uniform across the Nordic region; both regional and municipal patterns can be identified. Red and blue represent directions of population change; red indicates decrease and blue indicates increase in the total number of inhabitants in each municipality and region between 1997 and 2017 (again, using 1997 as the index value). Light beige represents the municipalities and regions with a stable population level during these 20 years, with index values varying from 95 to 105.
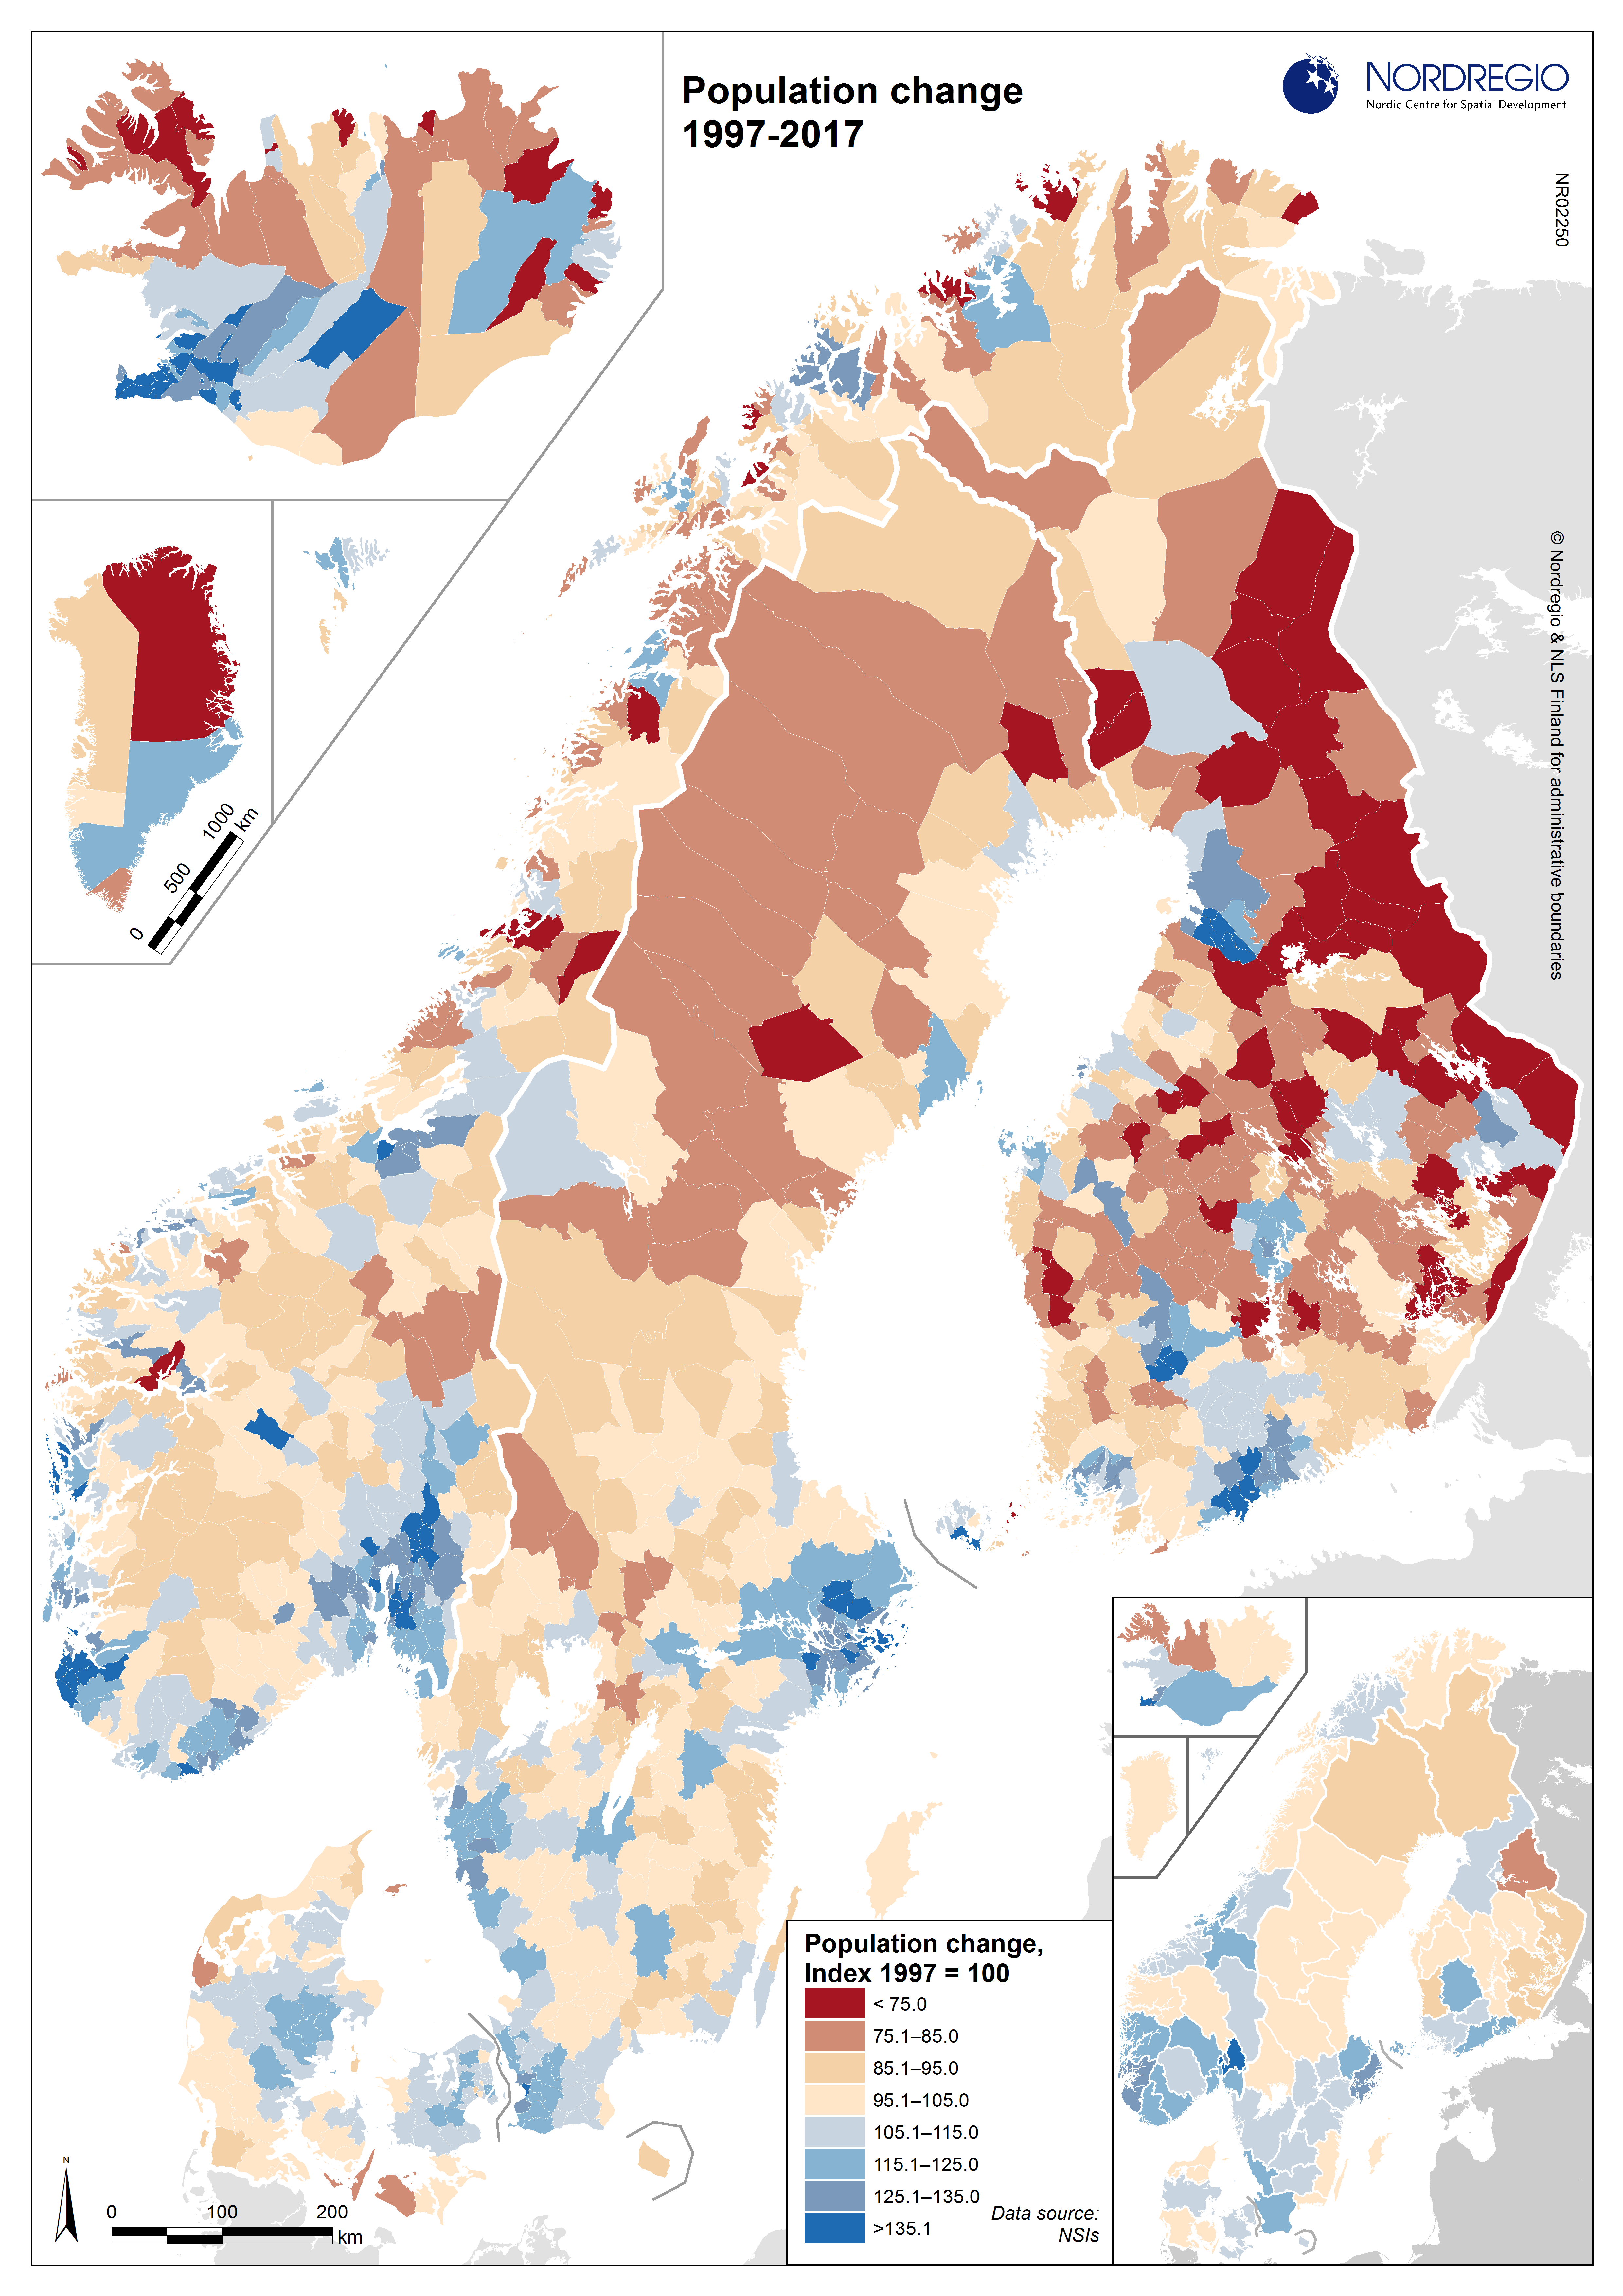
THE MAP CLEARLY SHOWS TWO SPATIAL PATTERNS OF POPULATION CHANGE
The first spatial pattern is at the regional level and shows opposite trends between the south and north. The southern regions are characterised by population increase between 1997 and 2017 (with the exceptions of two regions in Denmark and three in Sweden). In contrast, the northern regions are characterised by population decrease. Note that Iceland has a regional spatial pattern similar to that of the general Nordic Region, with positive trends in the south-west and negative in the north-east.
DIFFERENCES AT MUNICIPAL AND REGIONAL LEVELS
The second spatial pattern is at the municipal level. The Nordic regions with the highest increases are the capital cities of Iceland, Norway, Sweden, and Finland. Suðurnes, southeast of Reykjavik, Iceland, is growing the most rapidly: from 15,655 inhabitants in 1997 to 23,993 in 2017. The municipalities with the most significant increases are the capital city areas of Iceland, Norway, and Finland. The municipality with the highest growth index is Mosfellsbær, near Reykjavik, and Ullensaker, a Norwegian municipality 40 km north of Oslo. The regions with the most significant population index decreases are in Iceland and Finland. Vestfirðir, Iceland, lost the largest share of its population compared with other Nordic regions, decreasing from 8,759 inhabitants in 1997 to 6,870 in 2017. The municipalities with the largest population decreases are in Iceland and Finland (except for Kommuneqarfiit avataanni in Greenland). The municipality of Árneshreppur in Iceland had the most marked population decrease; it is also the site of the largest decrease compared with other Nordic municipalities. These patterns of higher population growth in larger, urban areas across the Nordic Region can be explained by these locations’ higher economic and labour market growth, greater educational opportunities, and other urban life attractions. Urbanisation patterns taking place in the Nordic Region are similar to those in most developed and developing regions around the world. Methodological considerations: Faroe Islands data is from 2016.
This article is part of Nordregio News #2. 2017, read the entire issue here.