The map shows the demographic vulnerability index in Nordic municipalities in 2019.
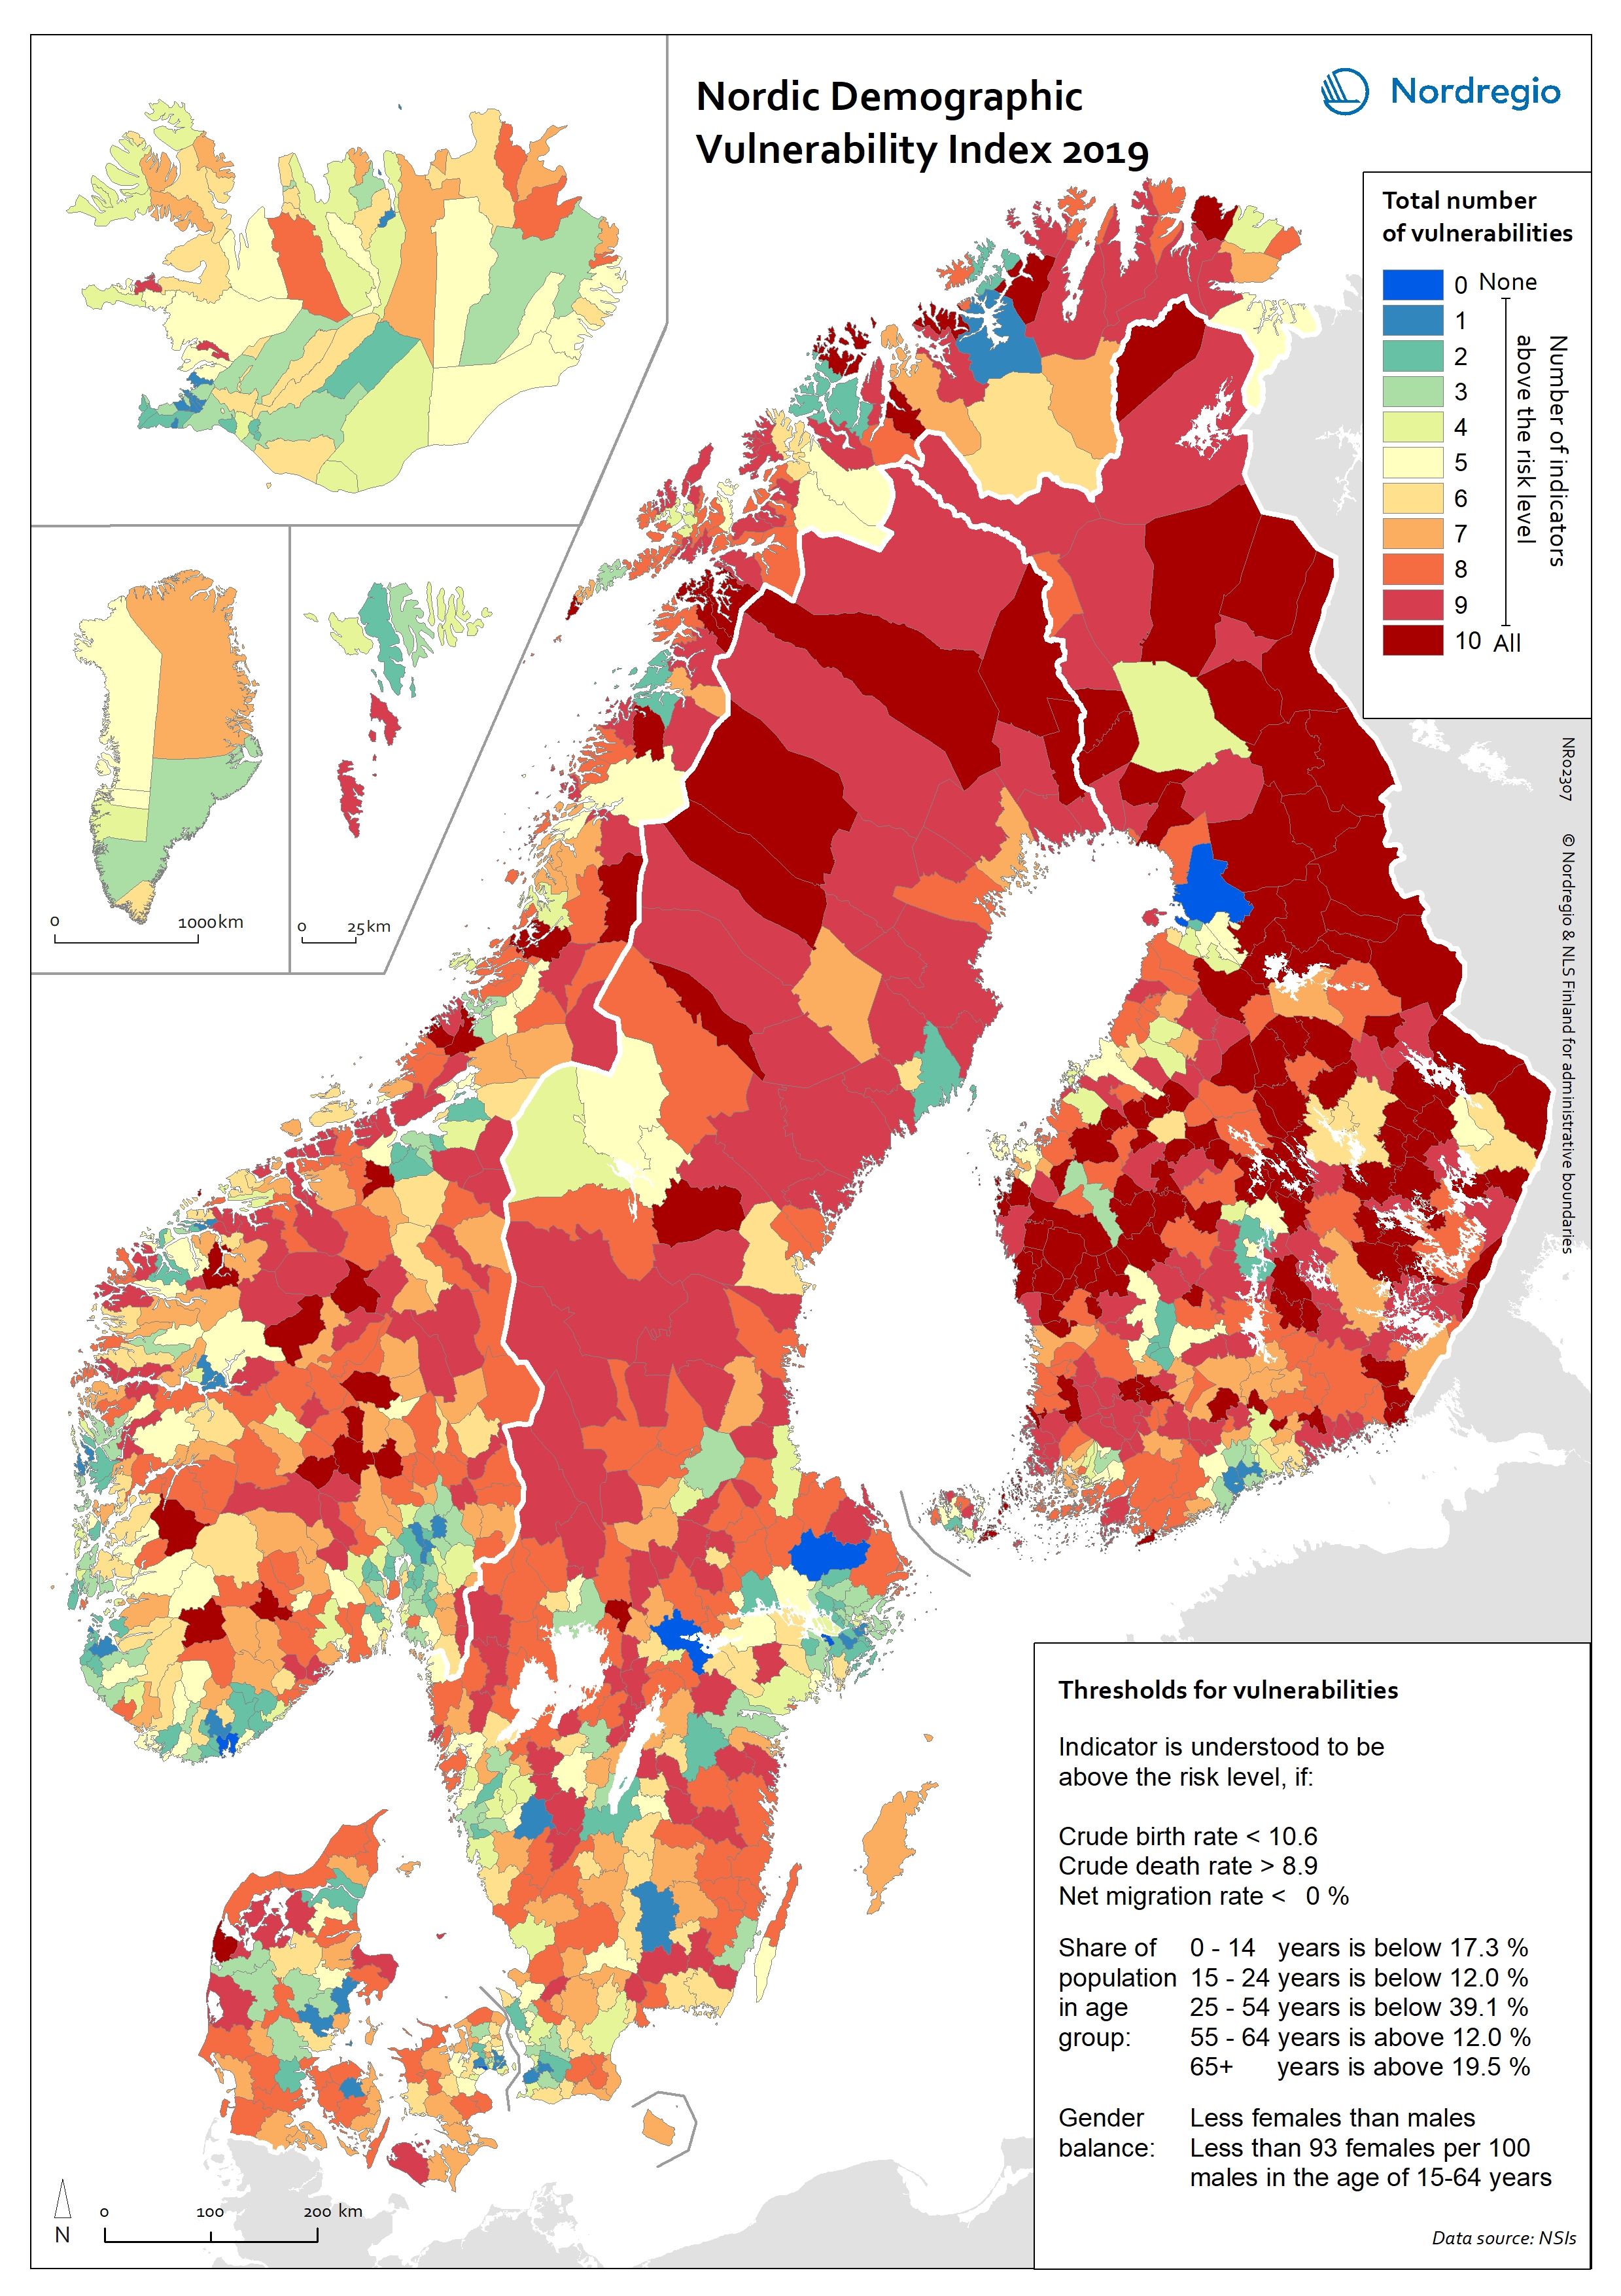
The index shows the degree to which municipalities in the Nordic region face demographic vulnerabilities. It is based on 10 demographic indicators – five related to age structure, two related to gender balance, two related to natural population change and one to migration. For each of the indicators a threshold value has been calculated, based on which a municipality can be considered ‘at risk’ or not.
The level of vulnerability has been calculated simply by counting the number of indicators on which the municipality crosses the ‘at-risk’ threshold. Therefore, a higher number indicates a higher level of risk. It is important to bear in mind that the existence of a large number of indicators over the ‘at-risk’ threshold does not necessarily indicate a bad demographic situation but rather it simply illustrates the level of complexity of the specific demographic situation. It does however illustrate a high level of complexity in the specific demographic situation.
Blue, green and light-yellow tones indicate municipalities with lower lever (1-5) of demographic risk whereas orange and red tones indicate municipalities where the number of indicators over the at- risk threshold is higher. Most municipalities in remote areas, especially in northern Sweden and Finland have a large number of vulnerabilities, while smaller numbers can be observed in capital areas and other growing city-regions.