This map shows the gross regional product per capita in million purchasing power parity (PPP) in all Nordic and Baltic Regions in 2015.
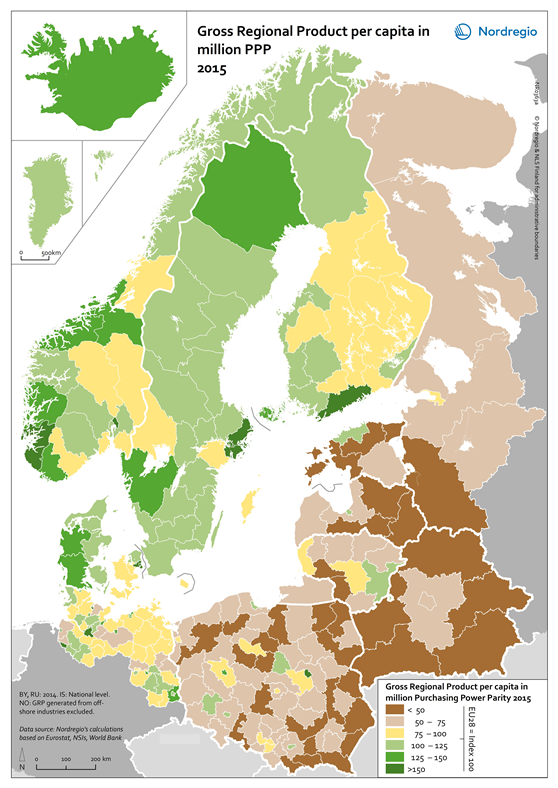
The green tones indicate regions with a gross regional product per capita above the EU28 average. The darker the tone the higher the gross regional product per capita. The brown/yellow shading indicates regions with a gross regional product per capita below the EU28 average. The darker the tone the lower the gross regional product per capita.
In economic development terms, the Nordic Region continues to perform well in relation to the EU average. Urban and capital city regions still show high levels of GDP per capita reflecting the established pattern throughout Europe. Stockholm, Oslo, Helsinki, Copenhagen and the western Norwegian regions are among the wealthiest in Europe, again confirming that the capital regions and larger cities are the strongest economic centres in the Nordic Region. In addition to these urban regions, some others also display high levels of GRP per capita. What is interesting is that in the aftermath of the economic crisis some second-tier city regions, such as Västra Götaland with Gothenburg in Sweden, are now also displaying fast growth rates as indeed are some less metropolitan regions in the western part of Denmark. These regions display GRP per capita levels which correspond to, or even exceed, those of most metropolitan regions in Europe. most of the central and eastern parts of Finland remain below the EU average.