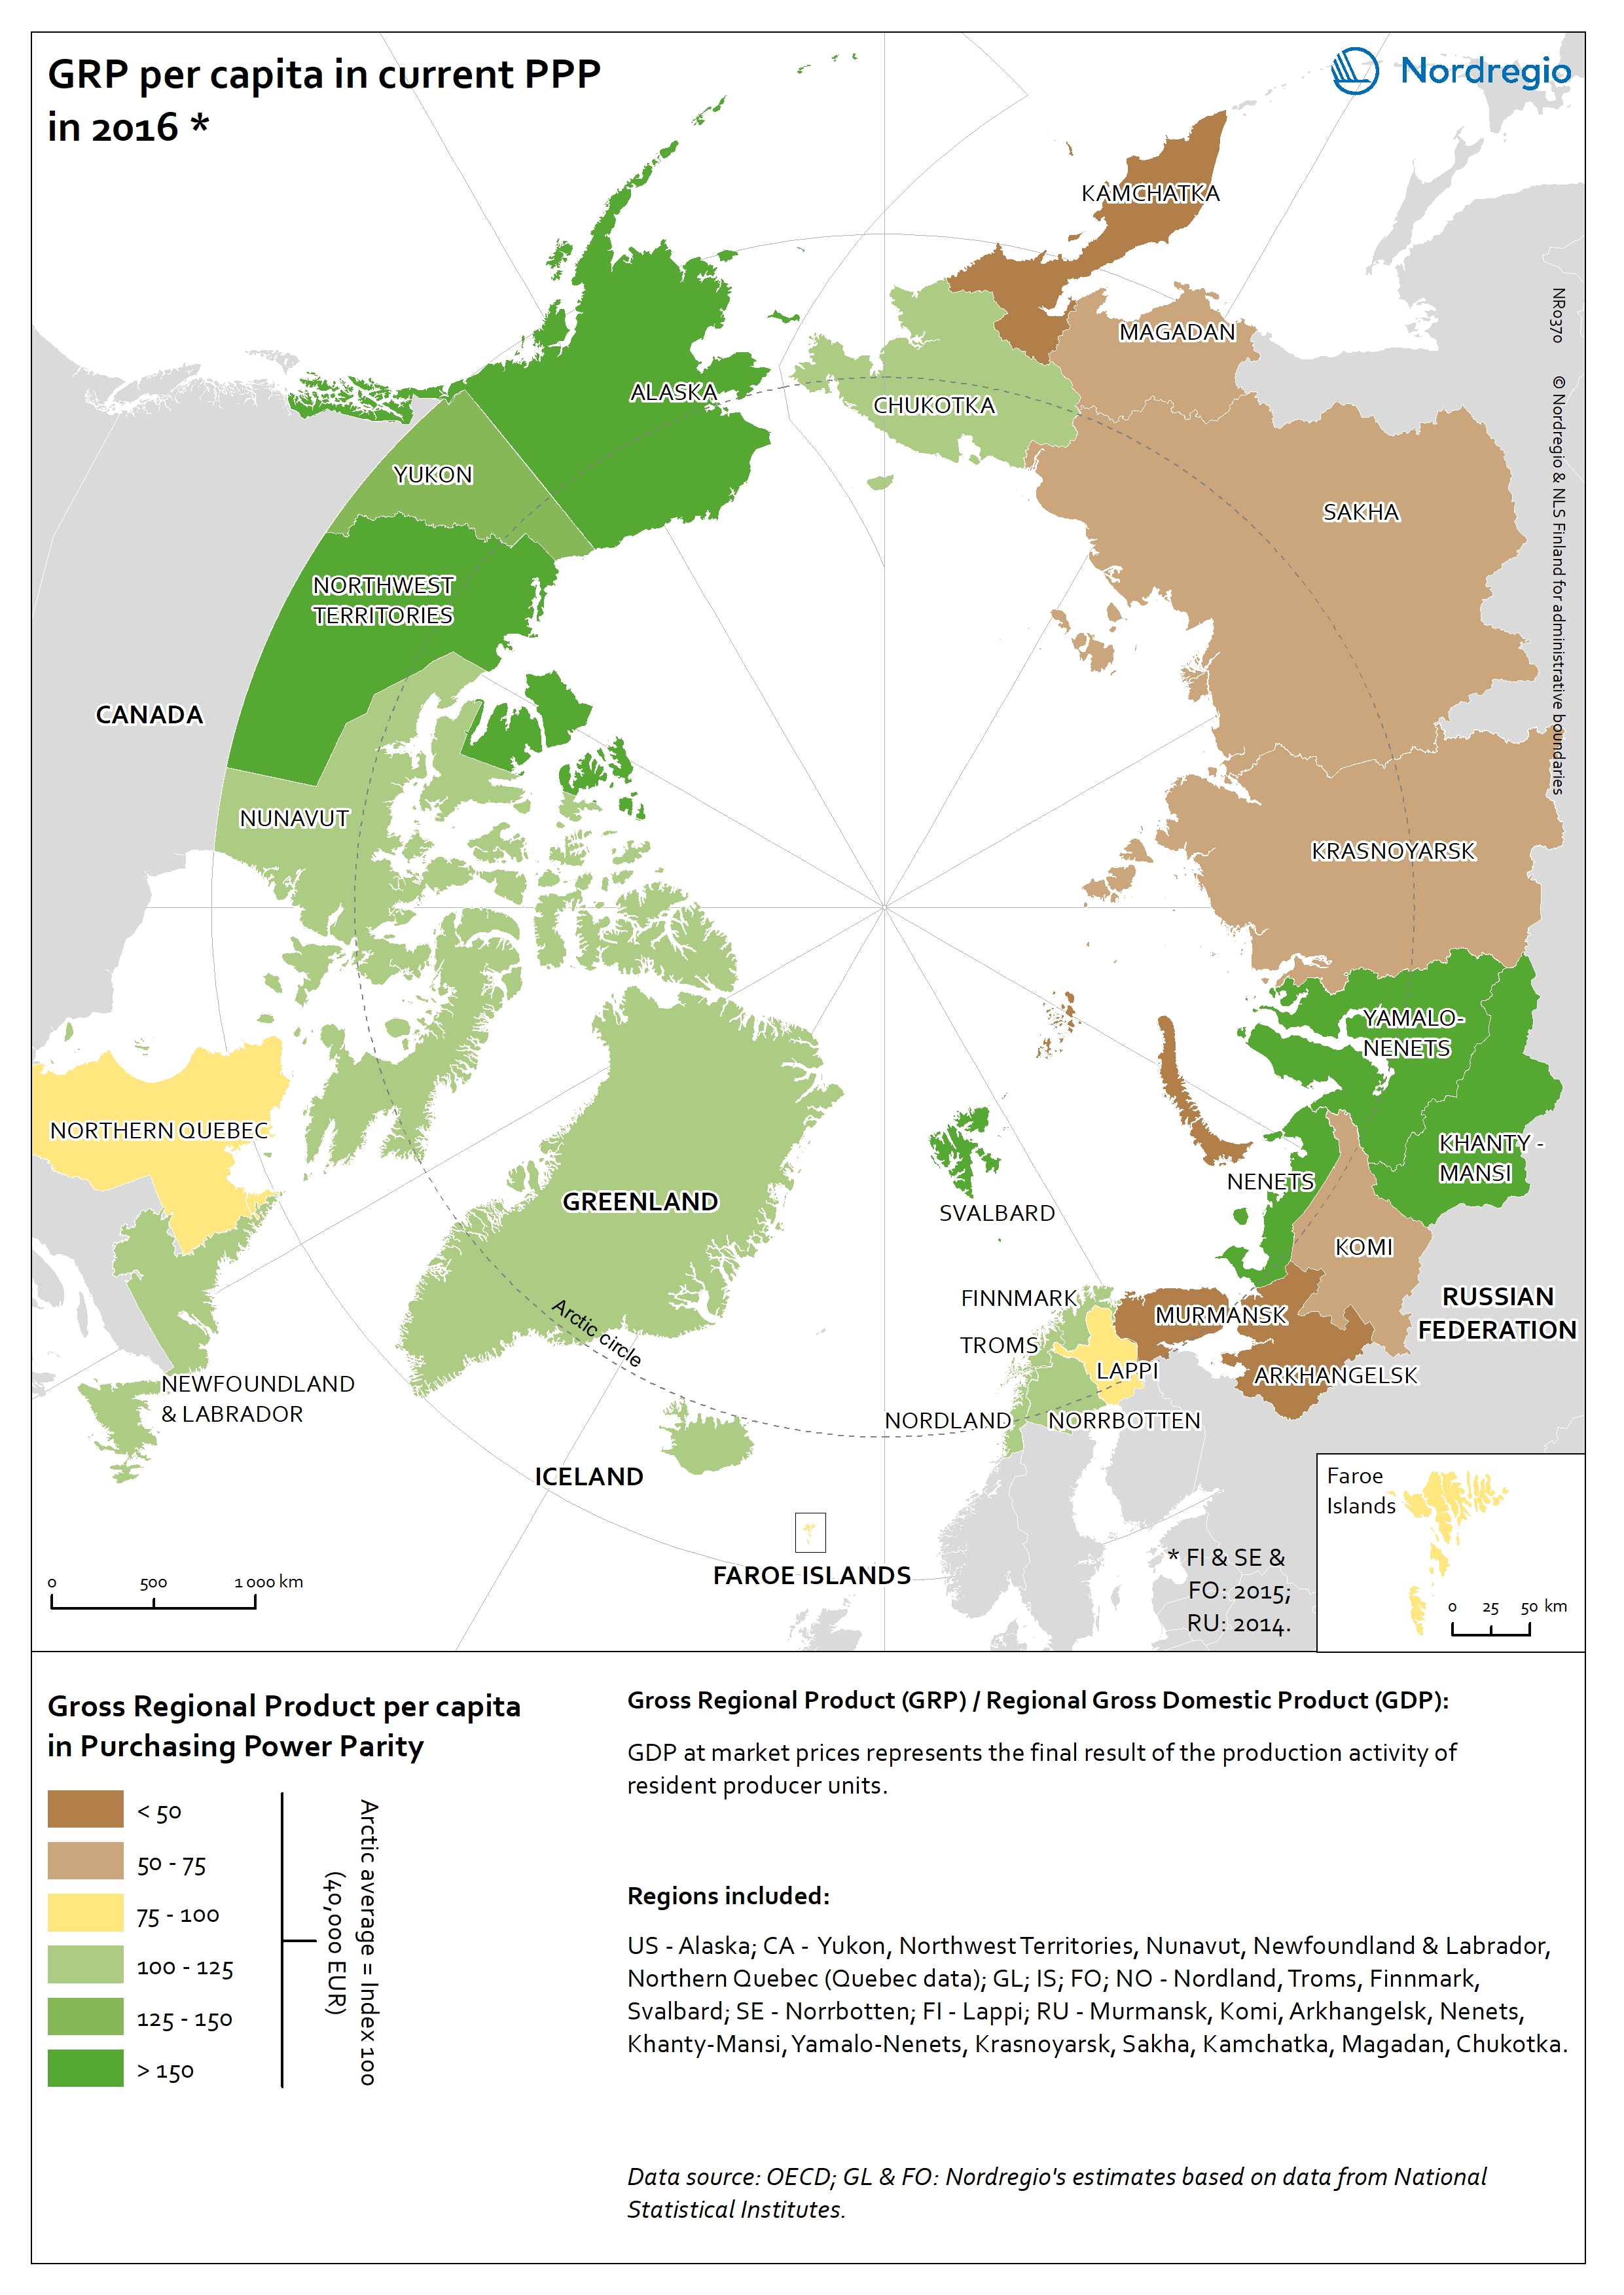
The map shows the Gross Regional Product (GRP) per capita in purchasing power parity (PPP) in the Arctic regions in 2016.
The Gross Domestic Product (GDP) measures the overall economic output of all economic activities in a country (measure in terms of purchasing power parity, or standards). The corresponding indicator at the regional level is the Gross Regional Product (GRP). Although these measures are somewhat blunt (for instance they do not consider sustainability) in the assessment of regional performance they are still the most stable and most commonly harmonised measure for economic comparisons.
The green tones indicate regions with a GRP per capita in PPP above the Arctic average. The darker the tone, the higher the GRP per capita. The brown/yellow shading indicates regions with a GRP per capita below the Arctic average. The darker the tone, the lower the GRP per capita.
Alaska (USA), the Canadian Arctic and the Nordic Arctic regions performed well in relation to the Arctic average. Alaska (USA), Northwest Territories (Canada) and Svalbard (Norway) performed best. In the Russian Arctic, there were large disparities between the regions. Nenets, Yamalo-Nenets, and Khanty-Mansi were well performing. Chukotka’s GRP in PPP was above the Arctic average as well. However, the remaining regions were far below the Arctic average, especially Murmansk, Arkhangelsk, and Kamchatka. It is largely due to the economic structure in the region. The regions with raw material extraction related industry tend to have higher GRP and better regional performance in terms of economic development.