Total number of employed (20-64 years) as a share of the total population of the same age
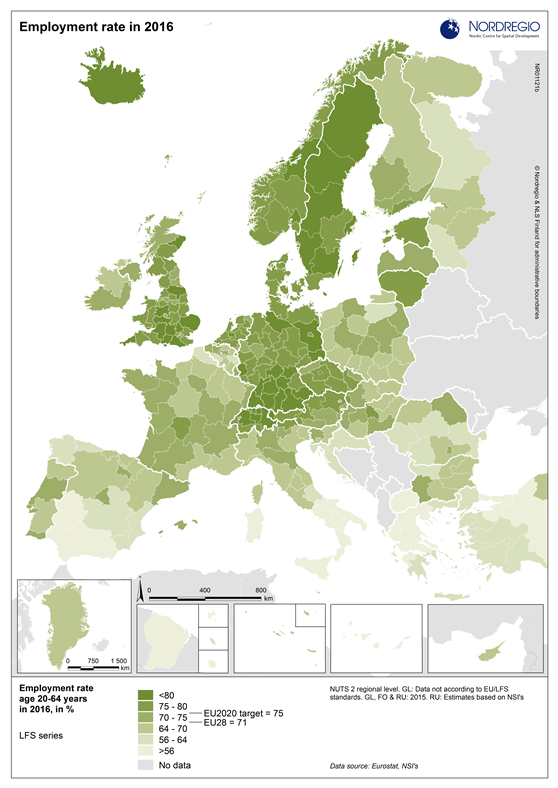
This map shows the employment rate for the age group 20-64 years at the regional level in Europe in 2016. The employment rate is here measured as the total number of employed persons in the age group 20-64 years as a share of the total population for the same age group.
The green shades on the map represents the employment rate, with darker colours showing higher employment rates and lighter colours showing lower employment rates.