This map shows the employment rate for all Nordic municipalities, calculated as the total number of employed persons as a share of the working age population (15–64 years). The small map shows the employment rate for all Nordic regions.
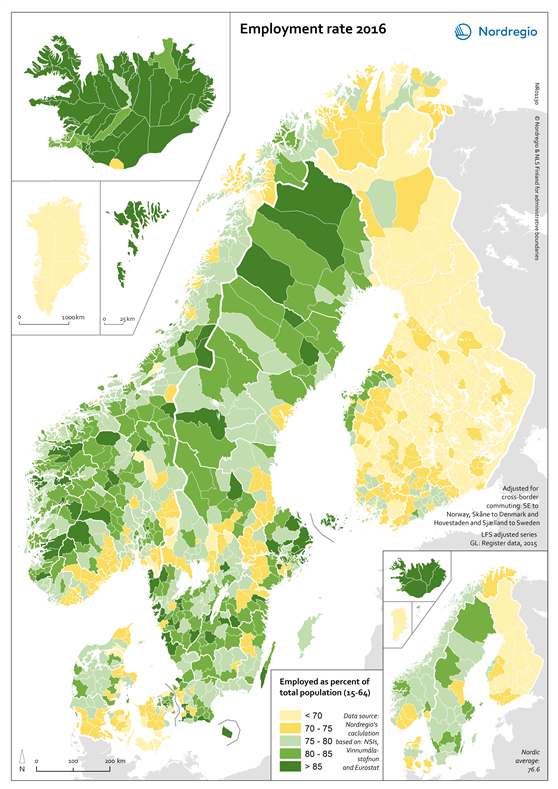
The green tones indicate municipalities with employment rates above 75% in 2016, with the darker green representing higher employment rate. The yellow tones indicate municipalities with employment rates below 75% in 2016. The light-yellow colour indicates municipalities with employment rates below 70% in 2016.
The highest employment rates in the Nordic Region can be found in Iceland, the Faroe Islands, Åland and smaller municipalities in Norway. All municipalities in the Faroe Islands and Iceland had employment rates over 85%. Employment rates of over 85% can also be found in several municipalities in Sweden, including municipalities in the main labour market regions of Stockholm (Ekerö, Täby and Värmdö); Gothenburg (Kungälv, Lerum and Stenungsund) and Malmö-Lund (Lomma and Ystad). In Denmark, the highest employment rate was found in the capital region, where three municipalities (Allerød, Egedal and Dragør) all had employment rates higher than 85% in 2016. Mainland Finland (with the exception of Österbotten), Greenland and southern Sjælland in Denmark stand out here, displaying lower employment rates than the rest of the Nordic Region.
Although there are several rural municipalities with high employment rates, the majority of jobs in the Nordic Region are concentrated in the largest labour market regions. 34% of the total Nordic labour force work in the capital city labour markets while a further 20% work in those associated with second-tier cities. The trend also suggests that the bigger cities are growing at the expense of the rural areas.