This map shows the employment recovery from the financial crisis, with the employment rate (20-64 years) in European regions in 2016 related to the EU2020 goal of 75%, as well as the change in the employment rate between 2009 and 2016.
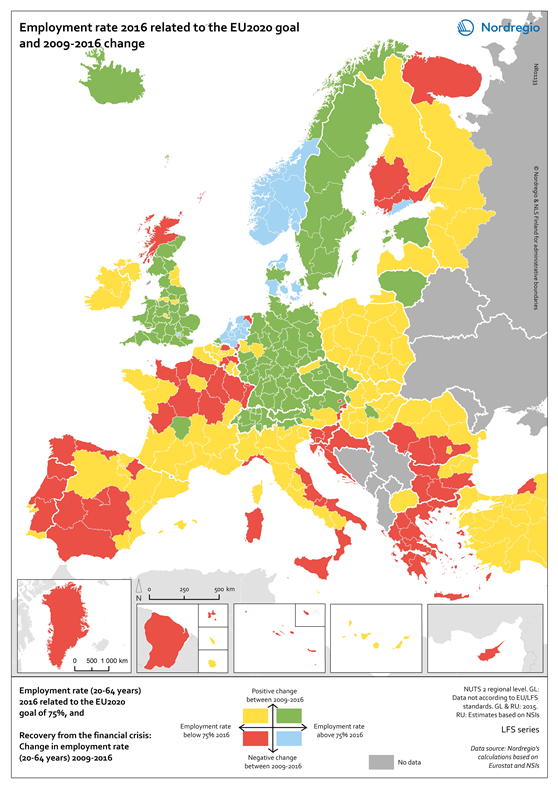
The green colour indicates regions with employment rates above 75% and an increase in the employment rate between 2009 and 2016. The red colour indicates regions with employment rates below 75% and a decrease in the employment rate between 2009 and 2016. The yellow colour indicates regions with employment rates above 75% and a decrease in the employment rate between 2009 and 2016. The blue colour indicates regions with employment rates below 75% and a decrease in the employment rate between 2009 and 2016. The grey colour indicates regions with no data available.
On a European scale, the effect of the financial crisis on employment became noticeable from 2009 onwards when average employment rates started to decline. This continued until 2013 when the average European employment rate reached its lowest level of 68.3% for the age group 20–64 years. After 2013 the employment rate started to rise again but it took until 2016 for the average European employment rate to reach and then surpass pre-crisis levels. In 2016 the average employment rate in the European union was 71%, edging closer to the EU2020 goal of 75%.
In some regions, primarily in southern Europe, employment rates have still to recover to pre-crisis levels. This is particularly so for Greece, Spain, Italy and Portugal which were particularly hard hit by the debt crisis and thus had to undertake massive cuts across the public sector. On the other hand, some countries such as Germany, Austria and Switzerland saw rising employment rates even during the financial crisis. The differential nature of outcomes in respect of the financial crisis suggest that some regions are less resilient to economic shocks than others.