This map shows the share of the economic inactivity for all Nordic regions in 2016, calculated as the total number of inactive persons as a share of the total population (25–64 years).
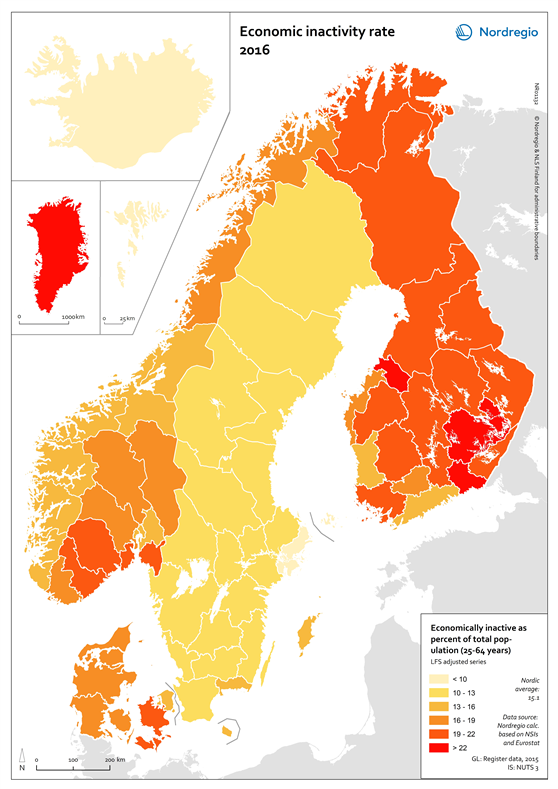
The economically inactive are commonly understood as the group furthest from the labour market in that they are neither employed, nor looking for work. This age group 25–64 was chosen in an attempt to exclude retirees and students.
The red tones indicate regions with high economic inactivity in 2016. The yellow tones indicate regions with low economic inactivity in 2016.
Inactivity rates across the Nordic Region vary both within and between countries. Iceland had the lowest share of economically inactive persons in its population in 2016 (around 9%), followed by Åland and the Stockholm Region (less than 10%). All Swedish regions had lower shares of economically inactive persons than all the Norwegian, Danish and Finnish regions (excluding Åland) and all were below 14%. The highest share of economically inactive persons was found in Northern and Eastern Finland and in Greenland where several regions had higher economic inactivity rates than the EU average (20.8%). In all countries, the capital regions had the lowest share of economically inactive persons: 15.6% in Helsinki-Uusimaa, 14.1% in capital region of Denmark – Hovedstaden and 13.8% in Oslo.