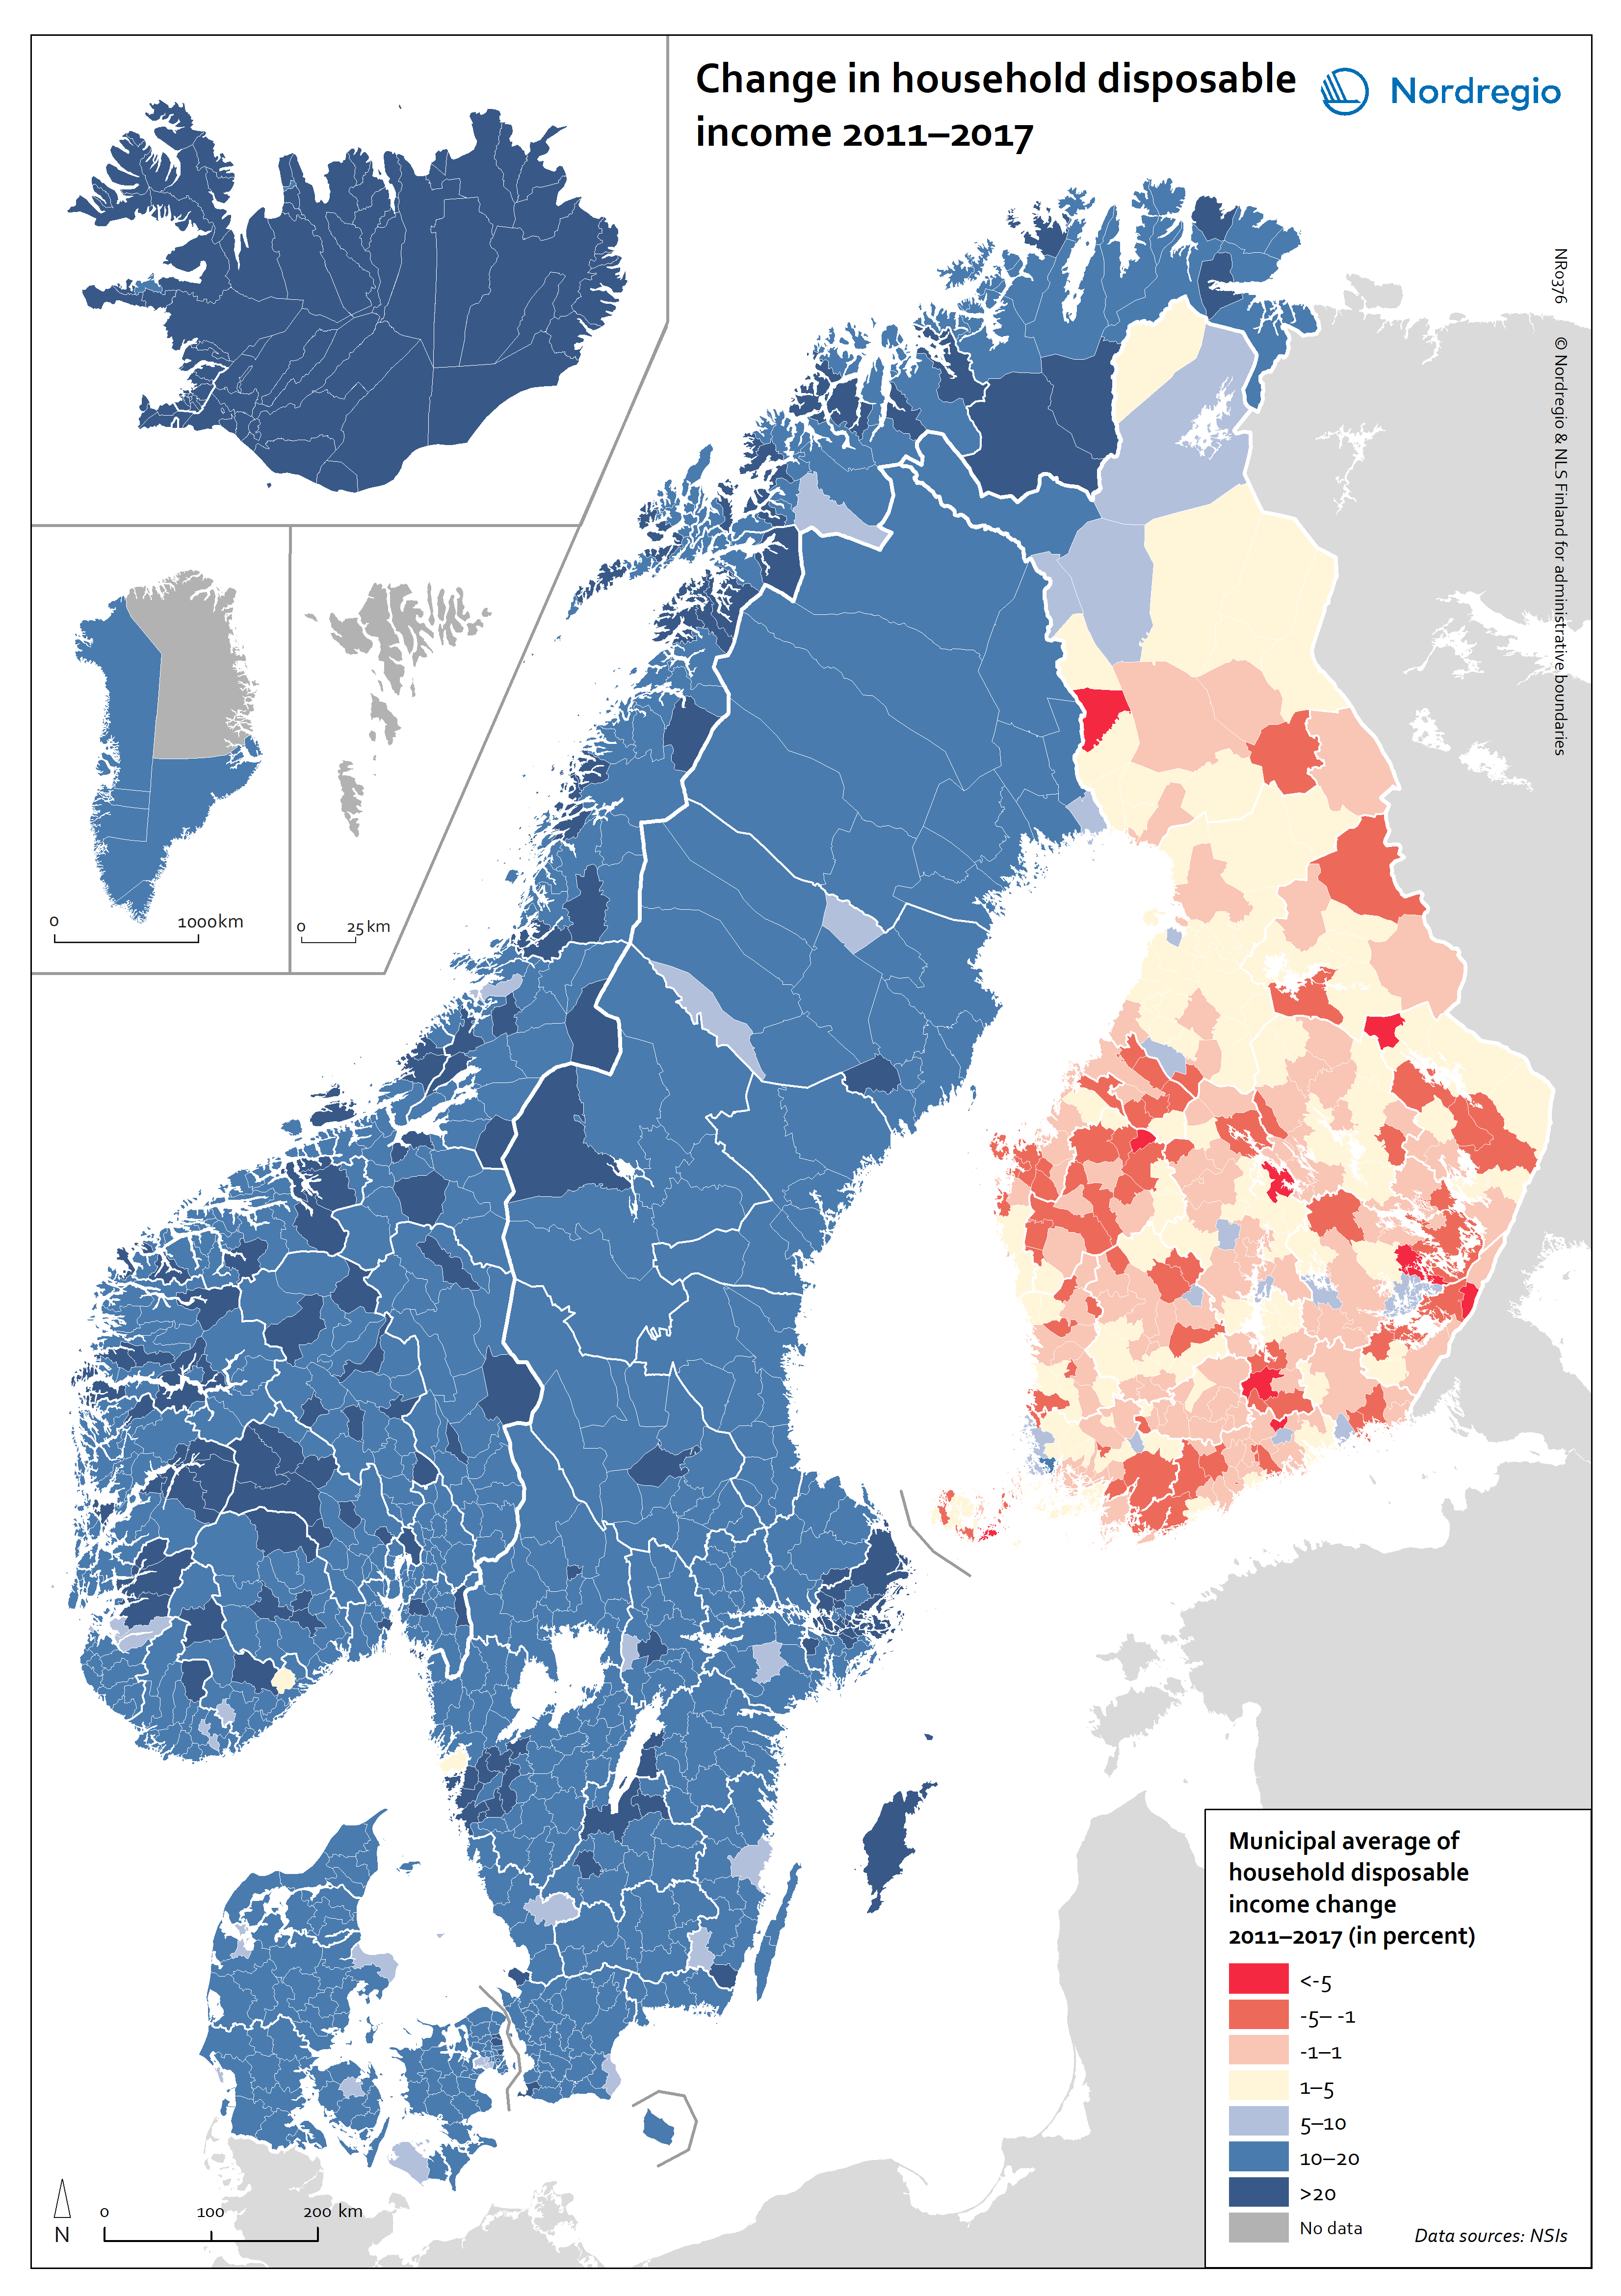
This map shows the change in household disposable income at the municipal level during the period 2011-2017.
The blue colours indicate an increase in average household disposable income and the red colours indicate a decrease in average household disposable income.
Household disposable income is defined as the sum of the income of a household (i.e. income from employment, net property income, social transfers and social benefits) minus direct taxes and social contributions, with dividends and net interest taken into consideration.
The map reveals that a striking difference between the trends in Finland and Åland and those in the rest of the Nordic Region. The average household disposable income has fallen in almost half of the municipalities in Finland and Åland, but increased in all municipalities in Denmark, Greenland, Iceland, Norway and Sweden. Vimpeli, Rautjärvi and Pukkila, all in Finland, are the municipalities which experienced the largest drop in average household income between 2011 and 2017. This negative trend in municipalities in Finland was largely the consequence of a prolonged recession in the early 2010s, when the manufacturing sector was hit by a structural crisis. The situation was exacerbated by out-migration to urban areas and a rise in the unemployment rate in Finland, which peaked in 2015.
Read the digital publication here.